

The DOI matches its Crossref record; 1 of the 1 references it cites were found in a registry or an index.
The substrate matters in the Raman spectroscopy analysis of cells
Abstract
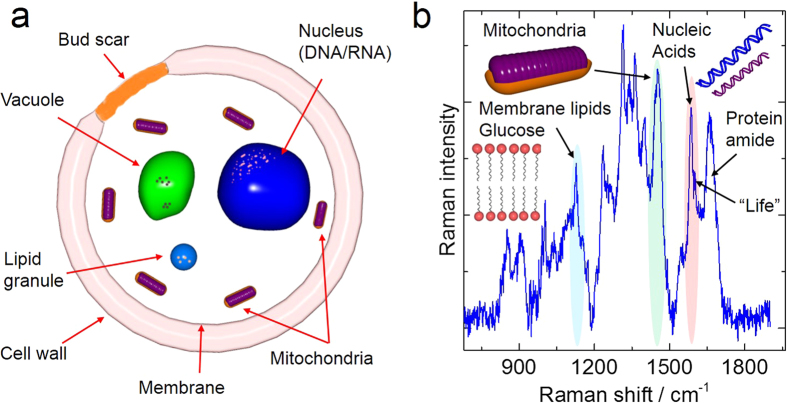
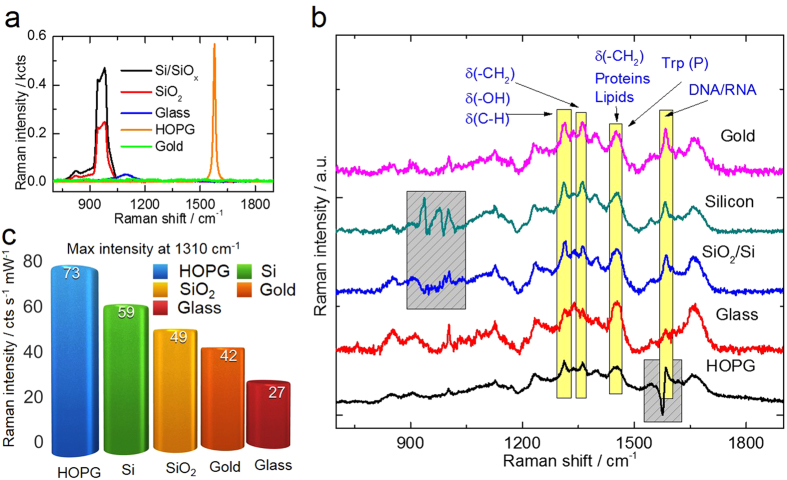
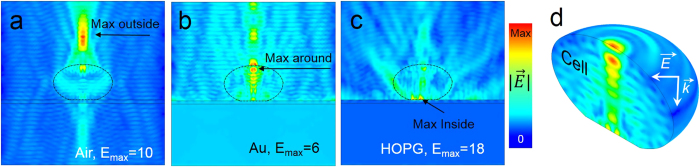
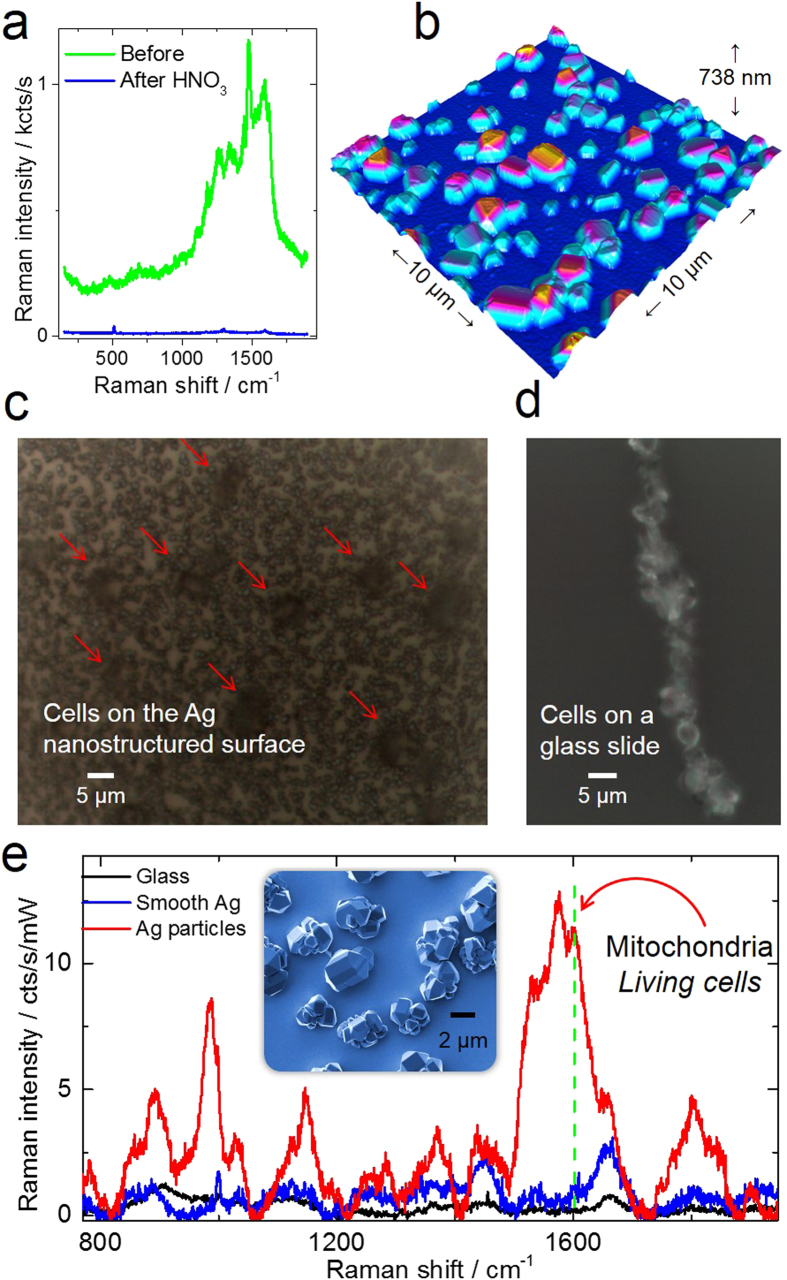
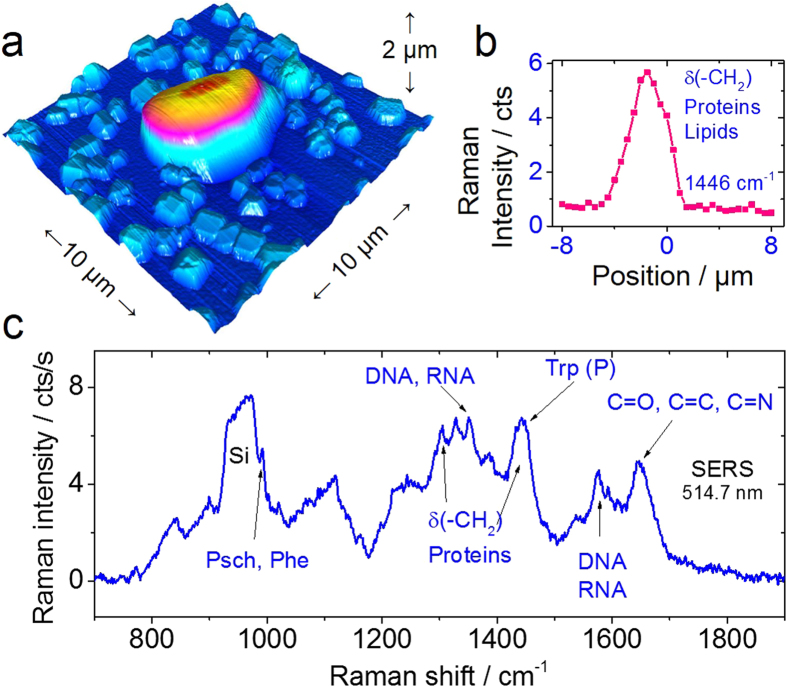
Raman spectroscopy is a powerful analytical method that allows deposited and/or immobilized cells to be evaluated without complex sample preparation or labeling. However, a main limitation of Raman spectroscopy in cell analysis is the extremely weak Raman intensity that results in low signal to noise ratios. Therefore, it is important to seize any opportunity that increases the intensity of the Raman signal and to understand whether and how the signal enhancement changes with respect to the substrate used. Our experimental results show clear differences in the spectroscopic response from cells on different surfaces. This result is partly due to the difference in spatial distribution of electric field at the substrate/cell interface as shown by numerical simulations. We found that the substrate also changes the spatial location of maximum field enhancement around the cells. Moreover, beyond conventional flat surfaces, we introduce an efficient nanostructured silver substrate that largely enhances the Raman signal intensity from a single yeast cell. This work contributes to the field of vibrational spectroscopy analysis by providing a fresh look at the significance of the substrate for Raman investigations in cell research.
Overview
The claims and statistics of this paper haven’t been checked yet.
Run the check — free, no account needed. It reads the open-access text and checks the sources it cites.
Integrity signals
Registry
Cites
Statistics
Figures
Verification
Claims the paper makes
The claims and statistics of this paper haven’t been checked yet.
Run the check — free, no account needed. It reads the open-access text and checks the sources it cites.
Claims other papers make about this one
Each is checked against this paper’s own text: does it say what the citing paper says it does?
In the citing paper
“Soda-lime silica glass slides are routinely used for microscopy imaging, and are compatible with EDF-HSI; however, they are not recommended for Raman analysis (Mikoliunaite et al. 2015).”
From Microplastics and nanoplastics science: collecting and characterizing airborne microplastics in fine particulate matter (2021) · cites this paper as Mikoliunaite et al. 2015
Self-check
Percentages, sums and reported differences re-computed from the paper’s own numbers.
The self-check needs the paper’s full text.
Citations
Cites
Extending Healthy Life Span—From Yeast to Humans
Fontana, L., Partridge, L., & Longo, V. D. (2010) · Science · doi:10.1126/science.1172539 · Cited by 3,023
Research works printed but not linked: 37
- Yagur-Kroll, S. et al. A miniature porous aluminum oxide-based flow-cell for online water quality monitoring using bacterial sensor cells. Biosens Bioelectron 64, 625–632 (2015). · DOI
- Ramanavicius, A. & Ramanaviciene, A. Hemoproteins in Design of Biofuel Cells. Fuel Cells 9, 25–36 (2009). · DOI
- Selvakumar, R. et al. Screening of silver nanoparticles containing carbonized yeast cells for adsorption of few long-lived active radionuclides. J Radioanal Nucl Ch 288, 629–633 (2011). · DOI
- Lauterbach, T. et al. Weak Glycolipid Binding of a Microdomain-Tracer Peptide Correlates with Aggregation and Slow Diffusion on Cell Membranes. Plos One 7 (2012). 10.1371/journal.pone.0051222. · DOI
- Cheng, N. C. et al. Cell death detection by quantitative three-dimensional single-cell tomography. Biomed Opt Express 3, 2111–2120 (2012). · DOI
- Bago, J. R. et al. In Vivo Bioluminescence Imaging of Cell Differentiation in Biomaterials: A Platform for Scaffold Development. Tissue Eng Pt A 19, 593–603 (2013). · DOI
- Murata, K. et al. Whole-cell imaging of the budding yeast Saccharomyces cerevisiae by high-voltage scanning transmission electron tomography. Ultramicroscopy 146, 39–45 (2014). · DOI
- Antonio, K. A. & Schultz, Z. D. Advances in Biomedical Raman Microscopy. Anal Chem 86, 30–46 (2014). · DOI
- Baniukevic, J. et al. Magnetic gold nanoparticles in SERS-based sandwich immunoassay for antigen detection by well oriented antibodies. Biosens Bioelectron 43, 281–288 (2013). · DOI
- Matousek, P. & Stone, N. Recent advances in the development of Raman spectroscopy for deep non-invasive medical diagnosis. J Biophotonics 6, 7–19 (2013). · DOI
- Ferrari, A. C. & Basko, D. M. Raman spectroscopy as a versatile tool for studying the properties of graphene. Nat Nano 8, 235–246 (2013). · DOI · Paper page
- Huang, C. K., Hamaguchi, H. & Shigeto, S. In vivo multimode Raman imaging reveals concerted molecular composition and distribution changes during yeast cell cycle. Chem Commun 47, 9423–9425 (2011). · DOI
- Huang, Y. S., Karashima, T., Yamamoto, M. & Hamaguchi, H. Molecular-level investigation of the structure, transformation and bioactivity of single living fission yeast cells by time- and space-resolved Raman spectroscopy. Biochemistry-Us 44, 10009–10019 (2005). · DOI
- Matthaus, C., Chernenko, T., Newmark, J. A., Warner, C. M. & Diem, M. Label-free detection of mitochondrial distribution in cells by nonresonant Raman microspectroscopy. Biophys J 93, 668–673 (2007). · DOI
- Notingher, I., Verrier, S., Haque, S., Polak, J. M. & Hench, L. L. Spectroscopic study of human lung epithelial cells (A549) in culture: Living cells versus dead cells. Biopolymers 72, 230–240 (2003). · DOI
- Chiu, L., Ando, M. & Hamaguchi, H. Study of the ‘Raman spectroscopic signature of life’ in mitochondria isolated from budding yeast. J Raman Spectrosc 41, 2–3 (2010). · DOI
- Onogi, C. & Hamaguchi, H. O. Photobleaching of the “Raman Spectroscopic Signature of Life” and Mitochondrial Activity in Rho(-) Budding Yeast Cells. J Phys Chem B 113, 10942–10945 (2009). · DOI
- Brauchle, E., Thude, S., Brucker, S. Y. & Schenke-Layland, K. Cell death stages in single apoptotic and necrotic cells monitored by Raman microspectroscopy. Sci. Rep. 4 (2014). 10.1038/srep04698 · DOI
- Huang, Y. S., Karashima, T., Yamamoto, M. & Hamaguchii, H. Molecular-level pursuit of yeast mitosis by time- and space-resolved Raman spectroscopy. J Raman Spectrosc 34, 1–3 (2003). · DOI
- Cheng, H. W. et al. Surface-enhanced Raman spectroscopic detection of Bacillus subtilis spores using gold nanoparticle based substrates. Anal Chim Acta 707, 155–163 (2011). · DOI
- Alexander, K. D. & Schultz, Z. D. Tip-Enhanced Raman Detection of Antibody Conjugated Nanoparticles on Cellular Membranes. Anal Chem 84, 7408–7414 (2012). · DOI
- Deckert-Gaudig, T., Bailo, E. & Deckert, V. Perspectives for spatially resolved molecular spectroscopy - Raman on the nanometer scale. J Biophotonics 1, 377–389 (2008). · DOI
- Rosch, P., Harz, M., Schmitt, M. & Popp, J. Raman spectroscopic identification of single yeast cells. J Raman Spectrosc 36, 377–379 (2005). · DOI
- Kniggendorf, A. K., Gaul, T. W. & Meinhardt-Wollweber, M. Effects of Ethanol, Formaldehyde and Gentle Heat Fixation in Confocal Resonance Raman Microscopy of Purple NonSulfur Bacteria. Microsc Res Techniq 74, 177–183 (2011). · DOI
- Draux, F. et al. Raman spectral imaging of single living cancer cells: a preliminary study. Analyst 134, 542–548 (2009). · DOI
- Novikov, S. M., Beermann, J., Bozhevolnyi, S. I., Harkness, L. M. & Kassem, M. Raman microscopy of individual living human embryonic stem cells. Proc Spie 7715 (2010). 10.1117/12.854207. · DOI
- Ocampo, A., Liu, J., Schroeder, E. A., Shadel, G. S. & Barrientos, A. Mitochondrial Respiratory Thresholds Regulate Yeast Chronological Life Span and its Extension by Caloric Restriction. Cell Metab 16, 55–67 (2012). · DOI
- Matsumoto, S., Yamanaka, K., Ogikubo, H., Akasaka, H. & Ohtake, N. Carbon nanotube dispersed conductive network for microbial fuel cells. Appl Phys Lett 105, 083904 (2014). · DOI
- Ring, J. et al. The metabolism beyond programmed cell death in yeast. Exp Cell Res 318, 1193–1200 (2012). · DOI
- Luo, S. C., Sivashanmugan, K., Liao, J. D., Yao, C. K. & Peng, H. C. Nanofabricated SERS-active substrates for single-molecule to virus detection in vitro: A review. Biosens Bioelectron 61, 232–240 (2014). · DOI
- Kleinman, S. L., Frontiera, R. R., Henry, A. I., Dieringer, J. A. & Van Duyne, R. P. Creating, characterizing and controlling chemistry with SERS hot spots. Phys Chem Chem Phys 15, 21–36 (2013). · DOI
- Kalbacova J. et al. Chemical stability of plasmon-active silver tips for tip-enhanced Raman spectroscopy. Nanospectroscopy 1, 12–18 (2015). · DOI
- Rai, M., Yadav, A. & Gade, A. Silver nanoparticles as a new generation of antimicrobials. Biotechnol Adv 27, 76–83 (2009). · DOI
- Nosoh, Y. Absorption spectrum of actively respiring yeast cells. Arch. Biochem. Biophys. 105, 439–445 (1964). · DOI
- Maquelin, K. et al. Identification of medically relevant microorganisms by vibrational spectroscopy. J Microbiol Meth 51, 255–271 (2002). · DOI
- Hancock, R. & Jeon, K. W. New Models of the Cell Nucleus: Crowding, Entropic Forces, Phase Separation and Fractals, Vol. 307 (Academic Press, 2013). · DOI
- Liang, X., Liu, A., Lim, C., Ayi, T. & Yap, P. Determining refractive index of single living cell using an integrated microchip. Sens Actuator A-Phys 133, 349–354 (2007). · DOI
Cited by
Sorted by citations
Rahman, L., Mallach, G., Kulka, R., & Halappanavar, S. (2021) · Nanotoxicology · doi:10.1080/17435390.2021.2018065 · Cited by 79
Tuberculosis determination using SERS and chemometric methods
Botta, R., Chindaudom, P., Eiamchai, P., Horprathum, M., Limwichean, S., Chananonnawathorn, C., Patthanasettakul, V., Kaewseekhao, B., Faksri, K., & Nuntawong, N. (2018) · Tuberculosis · doi:10.1016/j.tube.2017.12.008 · Cited by 51
Metadata
- Authors
- Mikoliunaite, L., Rodriguez, R. D., Sheremet, E., Kolchuzhin, V., Mehner, J., Ramanavicius, A., & Zahn, D. R. T.
- Venue
- Scientific Reports
- Published
- 2015-08-27
- Volume
- 5
- Issue
- 1
- ISSN
- 2045-2322
- PMC
- PMC4550836
- Cited by
- 87
- References
- 1
- Language
- en
About these checks
Registry, retraction, Cites and statistics results are computed, not judged, with one exception: a printed reference that no index lists is read once by a model before it counts as a citation error. Claims are extracted by a model and kept only when their quote appears verbatim in the text; each cited source is then checked, with a model’s help, for whether it says what the claim relies on. Those verdicts can be wrong — read the claim’s quote and the cited source before relying on one.
Statistics and arithmetic are recomputed, not judged.
Confidence bands are shown only for fields calibrated on our annotated test set. None is calibrated yet, so no band is shown.
What counts as a claim ›How we measure confidence ›How we check this ›
Are you an author, or do you see a problem with this page? Request a review
How to cite
Cite CoChat for the checks on this page, and the paper for its own findings.
- This page
- CoChat. (2026). Citation check: The substrate matters in the Raman spectroscopy analysis of cells. https://app.cochat.ai/papers/10.1038/srep13150
- The paper
- Mikoliunaite, L., Rodriguez, R. D., Sheremet, E., Kolchuzhin, V., Mehner, J., Ramanavicius, A., & Zahn, D. R. T. (2015). The substrate matters in the Raman spectroscopy analysis of cells. Scientific Reports. https://doi.org/10.1038/srep13150
