

The DOI matches its Crossref record; 4 of the 4 references it cites were found in a registry or an index.
Dissecting the influence of Neolithic demic diffusion on Indian Y-chromosome pool through J2-M172 haplogroup
Abstract
The global distribution of J2-M172 sub-haplogroups has been associated with Neolithic demic diffusion. Two branches of J2-M172, J2a-M410 and J2b-M102 make a considerable part of Y chromosome gene pool of the Indian subcontinent. We investigated the Neolithic contribution of demic dispersal from West to Indian paternal lineages, which majorly consists of haplogroups of Late Pleistocene ancestry. To accomplish this, we have analysed 3023 Y-chromosomes from different ethnic populations, of which 355 belonged to J2-M172. Comparison of our data with worldwide data, including Y-STRs of 1157 individuals and haplogroup frequencies of 6966 individuals, suggested a complex scenario that cannot be explained by a single wave of agricultural expansion from Near East to South Asia. Contrary to the widely accepted elite dominance model, we found a substantial presence of J2a-M410 and J2b-M102 haplogroups in both caste and tribal populations of India. Unlike demic spread in Eurasia, our results advocate a unique, complex and ancient arrival of J2a-M410 and J2b-M102 haplogroups into Indian subcontinent.
Overview
The claims and statistics of this paper haven’t been checked yet.
Run the check — free, no account needed. It reads the open-access text and checks the sources it cites.
Integrity signals
Registry
Cites
Statistics
Figures
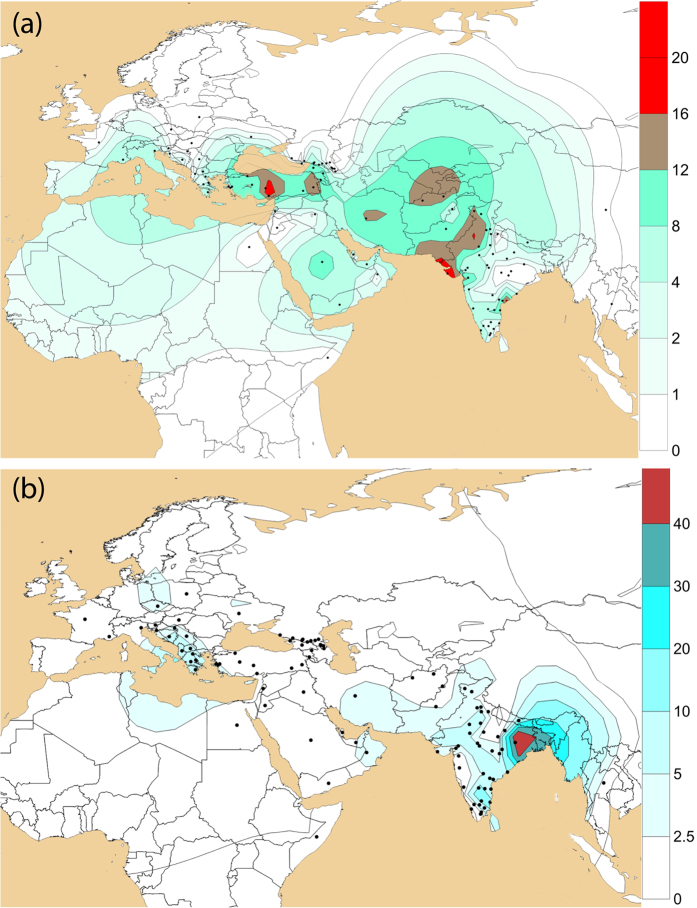
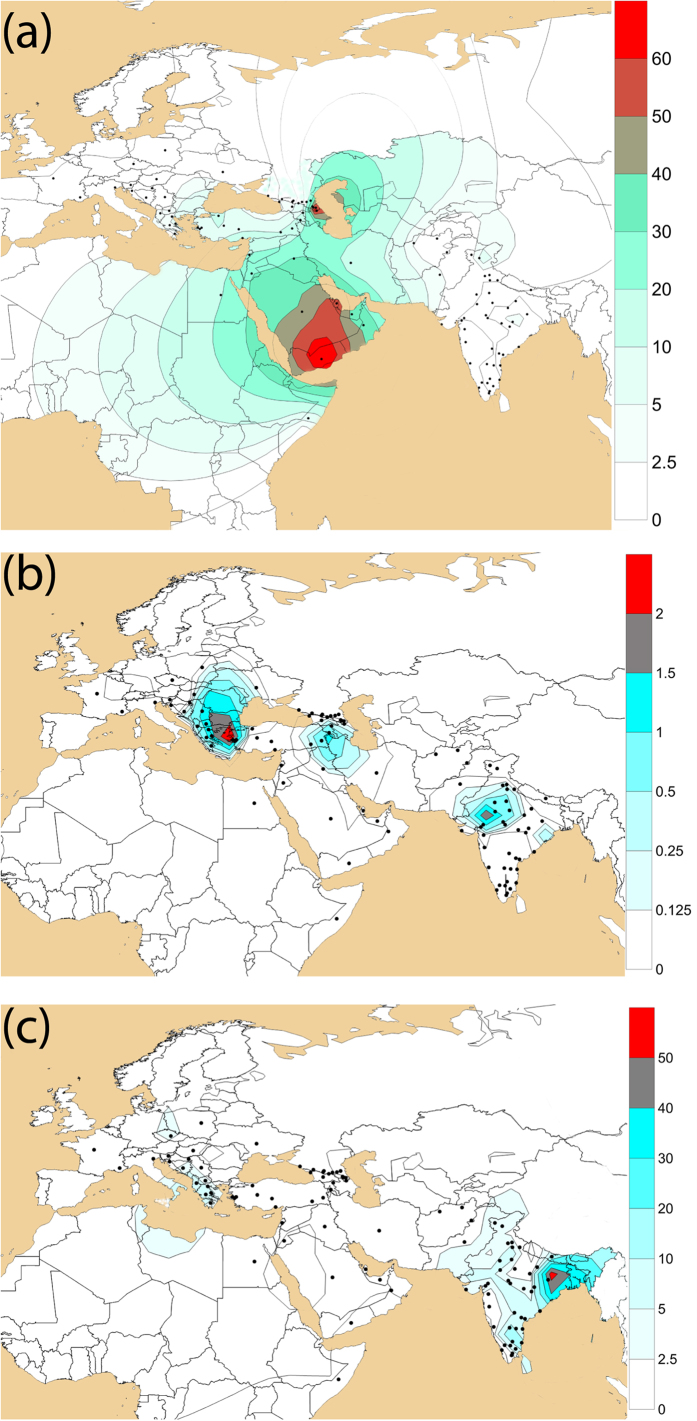
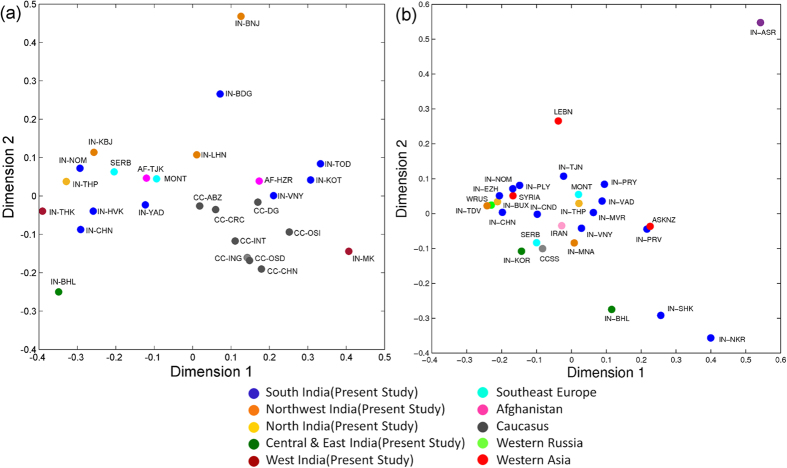
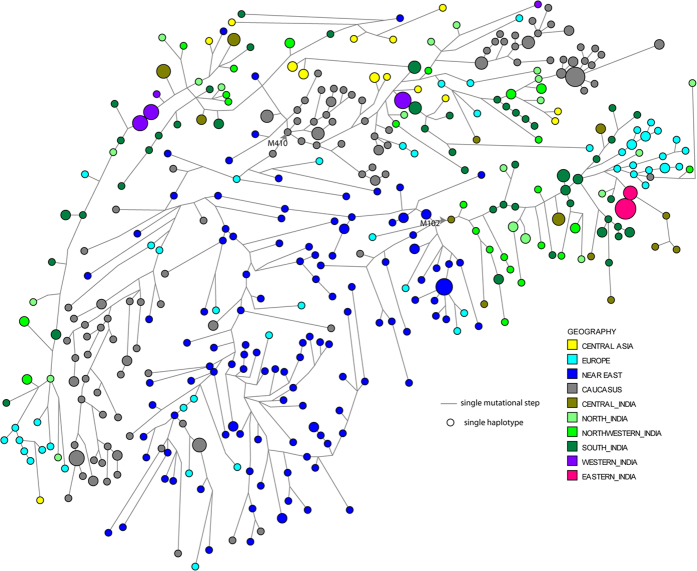
Verification
Claims the paper makes
The claims and statistics of this paper haven’t been checked yet.
Run the check — free, no account needed. It reads the open-access text and checks the sources it cites.
Claims other papers make about this one
Each is checked against this paper’s own text: does it say what the citing paper says it does?
In the citing paper
“The Neolithic evolution in the Middle East led to the global expansion of haplogroup J-M172 and related haplogroups [55].”
From Ancient Components and Recent Expansion in the Eurasian Heartland: Insights into the Revised Phylogeny of Y-Chromosomes from Central Asia (2022) · cites this paper as [55]
Self-check
Percentages, sums and reported differences re-computed from the paper’s own numbers.
The self-check needs the paper’s full text.
Citations
Cites
Reconstructing Indian population history
Reich, D., Thangaraj, K., Patterson, N., Price, A. L., & Singh, L. (2009) · Nature · doi:10.1038/nature08365 · Cited by 1,674
Self-citationAgricultural Origins and Frontiers in South Asia: A Working Synthesis
Fuller, D. Q. (2006) · Journal of World Prehistory · doi:10.1007/s10963-006-9006-8 · Cited by 387
Dulik, M. C., Zhadanov, S. I., Osipova, L. P., Askapuli, A., Gau, L., Gokcumen, O., Rubinstein, S., & Schurr, T. G. (2012) · The American Journal of Human Genetics · doi:10.1016/j.ajhg.2011.12.014 · Cited by 161
Non-human genetics, agricultural origins and historical linguistics in South Asia
Fuller, D. Q. (2007) · Vertebrate Paleobiology and Paleoanthropology Series · doi:10.1007/1-4020-5562-5_18 · Cited by 87
Research works printed but not linked: 59
- Thangaraj, K. et al. In situ origin of deep rooting lineages of mitochondrial Macrohaplogroup ‘M’ in India. BMC Genomics 7, 151 (2006). · DOI
- Mellars, P., Gori, K. C., Carr, M., Soares, P. A. & Richards, M. B. Genetic and archaeological perspectives on the initial modern human colonization of southern Asia. Proc. Natl. Acad. Sci. USA. 110, 10699–10704 (2013). · DOI · Paper page
- Misra, V. N. Prehistoric human colonisation of India. J. Biosci. 26, 491–531 (2001). · DOI
- Metspalu, M. et al. Most of the extant mtDNA boundaries in south and southwest Asia were likely shaped during the initial settlement of Eurasia by anatomically modern humans. BMC Genet. 5, 26 (2004). · DOI
- Basu, A. et al. Ethnic India: a genomic view, with special reference to peopling and structure. Genome Res. 13, 2277–2290 (2003). · DOI
- Thanseem, I. et al. Genetic affinities among the lower castes and tribal groups of India: inference from Y chromosome and mitochondrial DNA. BMC Genet. 7, 42 (2006). · DOI
- Kivisild, T. et al. The genetic heritage of earliest settlers persist in both the Indian tribal and caste populations. Am. J. Hum. Genet. 72, 313–332 (2003). · DOI
- Thangaraj, K. et al. Reconstructing the origin of Andaman Islanders. Science 308, 996 (2005). · DOI · Paper page
- Fuller, D. Q. & Murphy, C. Overlooked but not forgotten: India as a center for agricultural domestication. Gen. Anthropol. 21, 1–8 (2014). · DOI
- Diamond, J. & Bellwood, P. Farmers and their languages: the first expansions. Science 300, 597–603 (2003). · DOI · Paper page
- Al-Zahery, N. et al. Y-chromosome and mtDNA polymorphisms in Iraq, a crossroad of the early human dispersal and of post-Neolithic migrations. Mol. Phylogenet. Evol. 28, 458–472 (2003). · DOI
- Di Giacomo, F. et al. Y chromosomal haplogroup J as a signature of the post-neolithic colonization of Europe. Hum. Genet. 115, 357–371 (2004). · DOI
- Semino, O. et al. Origin, diffusion and differentiation of Y-chromosome haplogroups E and J: inferences on the neolithization of Europe and later migratory events in the Mediterranean area. Am. J. Hum. Genet. 74, 1023–1034 (2004). · DOI
- Sahoo, S. et al. A prehistory of Indian Y chromosomes: evaluating demic diffusion scenarios. Proc. Natl. Acad. Sci. USA. 103, 843–848 (2006). · DOI
- Sengupta, S. et al. Polarity and temporality of high-resolution y-chromosome distributions in India identify both indigenousand exogenous expansions and reveal minor genetic influence of Central Asian pastoralists. Am. J. Hum. Genet. 78, 202–221 (2006). · DOI · Paper page
- Cauvin, J. The Birth Of The Gods And The Origins Of Agriculture (Cambridge University Press, Cambridge 2000).
- King, R. & Underhill, P. A. Congruent distribution of Neolithic painted pottery and ceramic figurines with Y-chromosome lineages. Antiquity 76, 707–714 (2002). · DOI
- Possehl, G. L. Indus Age: The Beginnings (Univ. Pennsylvania Press, Philadelphia, 1999).
- Chaubey, G., Metspalu, M., Kivisild, T. & Villems, R. Peopling of South Asia: Investigating the caste-tribe continuum in India. Bioessays 29, 91–100 (2007). · DOI
- Arunkumar, G. et al. Population differentiation of southern Indian male lineages correlates with agricultural expansions predating the caste system. PLoS One 7, e50269 (2012). · DOI
- Eaaswarkhanth, M. et al. Traces of sub-Saharan and Middle Eastern lineages in Indian Muslim populations. Eur. J. Hum. Genet. 18, 354–363 (2010). · DOI
- Chang, Y. M., Perumal, R., Keat, P. Y. & Kuehn, D. L. Haplotype diversity of 16 Y-chromosomal STRs in three main ethnic populations (Malays, Chinese and Indians) in Malaysia. Forensic Sci. Int. 167, 70–76 (2007). · DOI
- Thangaraj, K. et al. The influence of natural barriers in shaping the genetic structure of Maharashtra populations. PloS one 5, e15283 (2010). · DOI
- Gupta, A. K. Origin of agriculture and domestication of plants and animals linked to early Holocene climate amelioration. Curr. Sci. 87, 54–59 (2004).
- Gangal, K., Sarson, G. R. & Shukurov, A. The Near-Eastern Roots of the Neolithic in South Asia. PloS one 9, e95714 (2014). · DOI
- Hiebert, F. T. & Dyson, R. H. Prehistoric Nishapur and frontier between Central Asia and Iran. Iranica Antiqua 37, 113–149 (2002). · DOI
- Kuzmina, E. E. & Mair, V. H. The Prehistory Of The Silk Road (Univ. Pennsylvania Press, Philadelphia, 2008). · DOI
- Harris, D. R. Origins Of Agriculture In Western Central Asia: An Environmental-Archaeological Study (Univ. Pennsylvania Press, Philadelphia, 2010). · DOI
- Balaresque, P. et al. A predominantly Neolithic origin for European paternal lineages. PLoS Boil. 8, e1000285 (2010). · DOI · Paper page
- Hammer, M. F. et al. Out of Africa and back again: nested cladistic analysis of human Y chromosome variation. Mol. Biol. Evol. 15, 427–441 (1998). · DOI
- Lacan, M. et al. Ancient DNA suggests the leading role played by men in the Neolithic dissemination. Proc. Natl. Acad. Sci. USA. 108, 18255–18259 (2011). · DOI
- Cinnioğlu, C. et al. Excavating Y-chromosome haplotype strata in Anatolia. Hum. Genet. 14, 127–148 (2004). · DOI · Paper page
- Balanovsky, O. et al. Parallel evolution of genes and languages in the Caucasus region. Mol. Biol. Evol. 28, 2905–2920 (2011). · DOI
- Luis, J. R. et al. The Levant versus the Horn of Africa: evidence for bidirectional corridors of human migrations. Am. J. Hum. Genet. 74, 532–544 (2004). · DOI
- Flores, C. et al. Isolates in a corridor of migrations: a high-resolution analysis of Y-chromosome variation in Jordan. J. Hum. Genet. 50, 435–41 (2005). · DOI
- Sanchez, J. J., Hallenberg, C., Børsting, C., Hernandez, A. & Morling, N. High frequencies of Y chromosome lineages characterized by E3b1, DYS19-11, DYS392-12 in Somali males. Eur. J. Hum. Genet. 13, 856–866 (2005). · DOI
- Regueiro, M., Cadenas, A. M., Gayden, T., Underhill, P. A. & Herrera, R. J. Iran: tricontinental nexus for Y-chromosome driven migration. Hum. Hered. 61, 132–43 (2006). · DOI
- Cadenas, A. M., Zhivotovsky, L. A., Cavalli-Sforza, L. L., Underhill, P. A. & Herrera, R. J. Y-chromosome diversity characterizes the Gulf of Oman. Eur. J. Hum. Genet. 16, 374–386 (2007). · DOI
- Battaglia, V. et al. Y-chromosomal evidence of the cultural diffusion of agriculture in Southeast Europe. Eur. J. Hum. Genet. 17, 820–830 (2008). · DOI
- Zalloua, P. A. et al. Y-chromosomal diversity in Lebanon is structured by recent historical events. Am. J. Hum. Genet. 82, 873–882 (2008). · DOI
- Abu-Amero, K. K. et al. Saudi Arabian Y-Chromosome diversity and its relationship with nearby regions. BMC Genet. 10, 59 (2009). · DOI · Paper page
- King, R. J. et al. The coming of the Greeks to Provence and Corsica: Y-chromosome models of archaic Greek colonization of the western Mediterranean. BMC Evol. Biol. 11, 69 (2011). · DOI
- Regueiro, M. et al. High levels of Paleolithic Y-chromosome lineages characterize Serbia. Gene 498, 59–67 (2012). · DOI
- Herrera, K. et al. Neolithic patrilineal signals indicate that the Armenian plateau was repopulated by agriculturalists. Eur. J. Hum. Genet. 20, 313–320 (2012). · DOI
- Haber, M. et al. Afghanistan’s ethnic groups share a Y-chromosomal heritage structured by historical events. PloS One 7, e34288 (2012). · DOI · Paper page
- Roewer, L. et al. Analysis of Y chromosome STR haplotypes in the European part of Russia reveals high diversities but non-significant genetic distances between populations. Int. J. Legal Med. 122, 219–223 (2008). · DOI · Paper page
- El-Sibai, M. et al. Geographical Structure of the Y-chromosomal Genetic Landscape of the Levant: A coastal-inland contrast. Ann. Hum. Genet. 73, 568–581 (2009). · DOI
- Mirabal, S. et al. Human Y‐chromosome short tandem repeats: A tale of acculturation and migrations as mechanisms for the diffusion of agriculture in the Balkan Peninsula. Am. J. Phys. Anthropol. 142, 380–390 (2010). · DOI
- Haber, M. et al. Influences of history, geography and religion on genetic structure: the Maronites in Lebanon. Eur. J. Hum. Genet. 19, 334–340 (2011). · DOI · Paper page
- Robino, C. et al. Analysis of Y-chromosomal SNP haplogroups and STR haplotypes in an Algerian population sample. Int. J. Legal Med. 122, 251–255 (2008). · DOI
- Zhivotovsky, L. A. et al. The effective mutation rate at Y chromosome short tandem repeats, with application to human population-divergence time. Am. J. Hum. Genet. 74, 50–61 (2004). · DOI
- Gusmao, L. et al. Mutation rates at Y chromosome specific microsatellites. Hum. Mutat. 26, 520–528 (2005). · DOI
- Sanchez-Diz, P. et al. Population and segregation data on 17 Y-STRs: results of a GEP-ISFG collaborative study. Int. J. Legal Med. 122, 529–533 (2008). · DOI
- Ge, J., Budowle, B. & Aranda, X. G. Mutation rates at Y chromosome short tandem repeats in Texas populations. Forensic Sci. Int. Genet. 3, 179–184 (2009). · DOI
- Excoffier, L., Laval, G. & Schneider, S. Arlequin (version 3.0): An integrated software package for population genetics data analysis. Evol. Bioinform. Online 1, 47–50 (2005). · DOI
- Wilson, I. J., Weale, M. E. & Balding, D. J. Inferences from DNA data: population histories, evolutionary processes and forensic match probabilities. J. R. Stat. Soc. Ser. A Stat. Soc. 166, 155–188 (2003). · DOI
- Wang, C. C. & Li, H. Comparison of Y-chromosomal lineage dating using either evolutionary or genealogical Y-STR mutation rates. bioRxiv, http://dx.doi.org/10.1101/004705 (2014). · DOI
- Burgarella, C. & Navascue´ s, M. Mutation rate estimates for 110 Y-chromosome STRs combining population and father-son pair data. Eur. J. Hum. Genet. 19, 70–75 (2011). · DOI
- Shi, W. et al. A worldwide survey of human male demographic history based on Y-SNP and Y-STR data from the HGDP-CEPH populations. Mol. Biol. Evol. 27, 385–393 (2010). · DOI
Cited by
Zhabagin, M., Wei, L.-H., Sabitov, Z., Ma, P.-C., Sun, J., Dyussenova, Z., Balanovska, E., Li, H., & Ramankulov, Y. (2022) · Genes · doi:10.3390/genes13101776 · Cited by 17
Metadata
- Authors
- Singh, S., Singh, A., Rajkumar, R., Sampath Kumar, K., Kadarkarai Samy, S., Nizamuddin, S., Singh, A., Ahmed Sheikh, S., Peddada, V., Khanna, V., Veeraiah, P., Pandit, A., Chaubey, G., Singh, L., & Thangaraj, K.
- Venue
- Scientific Reports
- Published
- 2016-01-12
- Volume
- 6
- Issue
- 1
- ISSN
- 2045-2322
- PMC
- PMC4709632
- Cited by
- 27
- References
- 4
- Language
- en
About these checks
Registry, retraction, Cites and statistics results are computed, not judged, with one exception: a printed reference that no index lists is read once by a model before it counts as a citation error. Claims are extracted by a model and kept only when their quote appears verbatim in the text; each cited source is then checked, with a model’s help, for whether it says what the claim relies on. Those verdicts can be wrong — read the claim’s quote and the cited source before relying on one.
Statistics and arithmetic are recomputed, not judged.
Confidence bands are shown only for fields calibrated on our annotated test set. None is calibrated yet, so no band is shown.
What counts as a claim ›How we measure confidence ›How we check this ›
Are you an author, or do you see a problem with this page? Request a review
