

The DOI matches its Crossref record; 82 of the 82 references it cites were found in a registry or an index.
Contrasting global genetic patterns in two biologically similar, widespread and invasive Ciona species (Tunicata, Ascidiacea)
Open accessAbstract
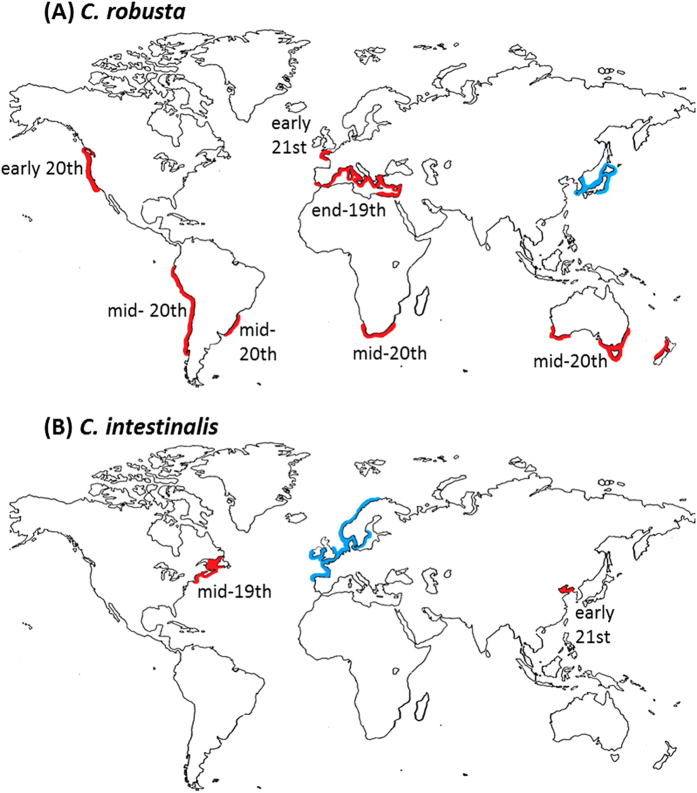
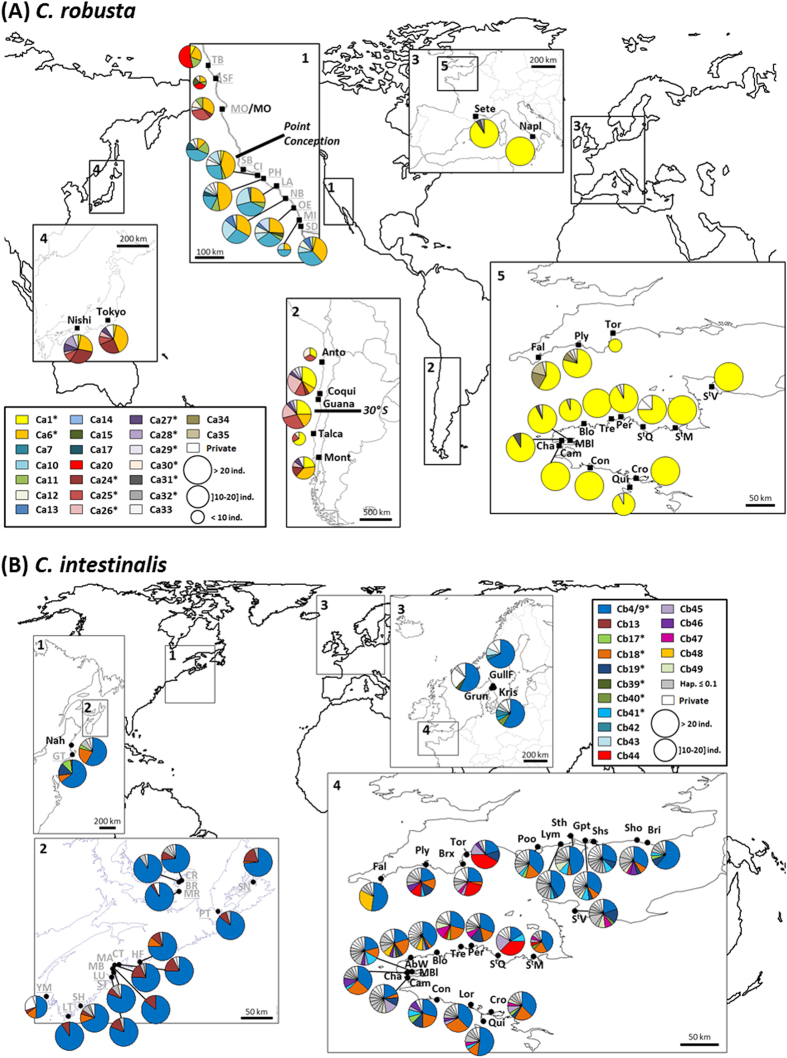
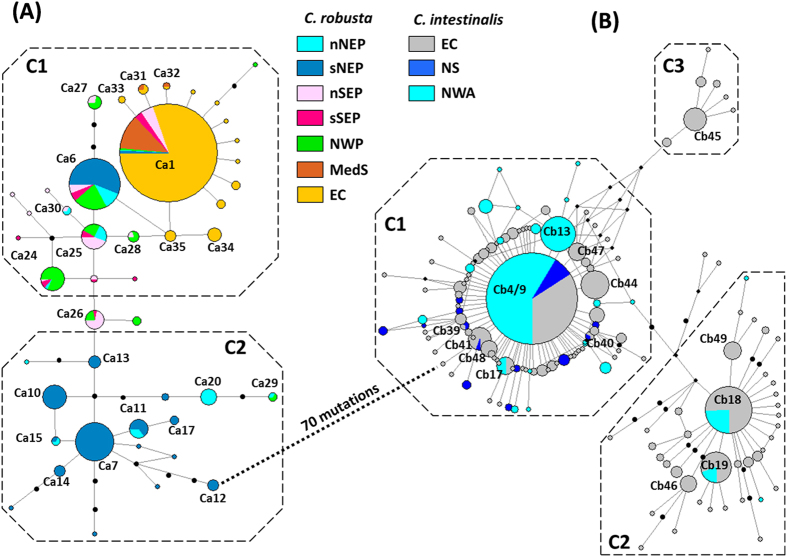
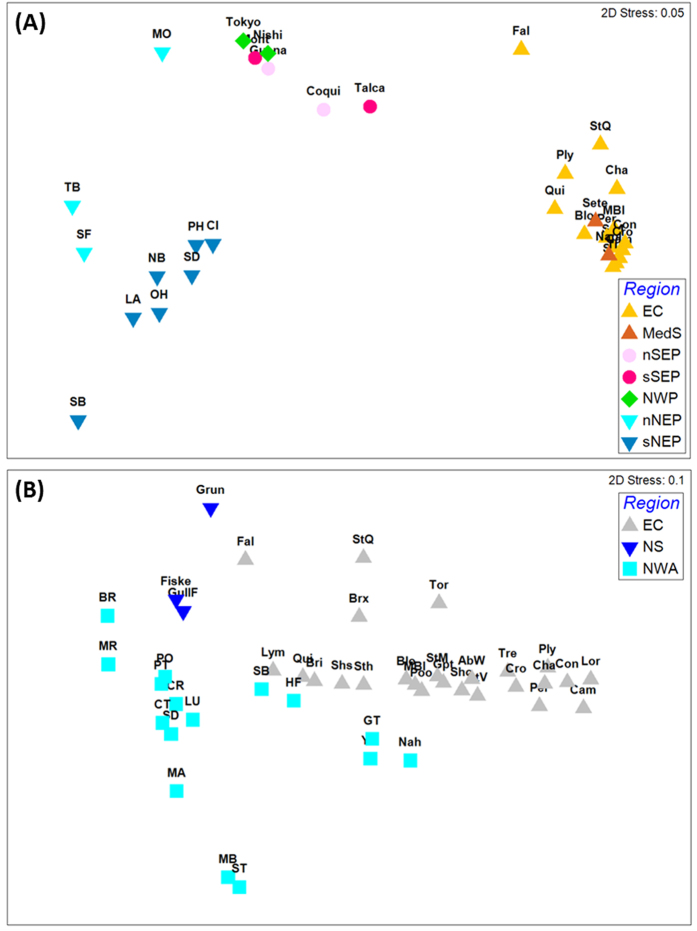
Human-mediated dispersal interplays with natural processes and complicates understanding of the biogeographical history of species. This is exemplified by two invasive tunicates, Ciona robusta (formerly Ciona intestinalis type A) and C. intestinalis (formerly Ciona intestinalis type B), globally distributed and sympatric in Europe. By gathering new mitochondrial sequences that were merged with published datasets, we analysed genetic patterns in different regions, with a focus on 1) their sympatric range and 2) allopatric populations in N and S America and southern Europe. In the sympatric range, the two species display contrasting genetic diversity patterns, with low polymorphism in C. robusta supporting the prevalent view of its recent introduction. In the E Pacific, several genetic traits support the non-native status of C. robusta. However, in the NE Pacific, this appraisal requires a complex scenario of introduction and should be further examined supported by extensive sampling efforts in the NW Pacific (putative native range). For C. intestinalis, Bayesian analysis suggested a natural amphi-North Atlantic distribution, casting doubt on its non-native status in the NW Atlantic. This study shows that both natural and human-mediated dispersal have influenced genetic patterns at broad scales; this interaction lessens our ability to confidently ascertain native vs. non-native status of populations, particularly of those species that are globally distributed.
Overview
The claims and statistics of this paper haven’t been checked yet.
Run the check — free, no account needed. It reads the open-access text and checks the sources it cites.
Integrity signals
Registry
Cites
Statistics
Figures
Verification
Claims the paper makes
The claims and statistics of this paper haven’t been checked yet.
Run the check — free, no account needed. It reads the open-access text and checks the sources it cites.
Claims other papers make about this one
Each is checked against this paper’s own text: does it say what the citing paper says it does?
The cited source says what the claim attributes to it.
In the citing paper
“Furthermore, cryptomonads are widespread in the marine environment and abundant along the coastline (Astudillo et al., 2014; Xing et al., 2008) where ascidians, such as C. intestinalis, are present (Bouchemousse et al., 2016; Locke & Carman, 2009).”
From Mixotrophic flagellate ingestion boosts microplastic accumulation in ascidians (2022) · cites this paper as Bouchemousse et al., 2016
Self-check
Percentages, sums and reported differences re-computed from the paper’s own numbers.
The self-check needs the paper’s full text.
Citations
Cites
Hall, T. A. (1999) · Nucleic Acids Symposium Series · doi:10.14601/phytopathol_mediterr-14998u1.29 · Cited by 38,297
Excoffier, L., & Lischer, H. E. L. (2010) · Molecular Ecology Resources · doi:10.1111/j.1755-0998.2010.02847.x · Cited by 16,679
Dating of the human–ape splitting by a molecular clock of mitochondrial DNA.
Hasegawa, M., Kishino, H., & Yano, T.-A. (1985) · Journal of Molecular Evolution · doi:10.1007/bf02101694 · Cited by 8,687
DnaSP, DNA polymorphism analyses by the coalescent and other methods
Rozas, J., Sánchez-DelBarrio, J. C., Messeguer, X., & Rozas, R. (2003) · Bioinformatics · doi:10.1093/bioinformatics/btg359 · Cited by 6,133
The Ecology of Invasions by Animals and Plants
Elton, C. (1958) · Springer eBooks · doi:10.1007/978-1-4899-7214-9 · Cited by 4,331
The Ecology of Invasions by Animals and Plants.
Richards, P. W., & Elton, C. (1959) · Journal of Ecology · doi:10.2307/2257385 · Cited by 3,907
hp‐rare 1.0: a computer program for performing rarefaction on measures of allelic richness
Kalinowski, S. T. (2004) · Molecular Ecology Notes · doi:10.1111/j.1471-8286.2004.00845.x · Cited by 2,227
Assessing the global threat of invasive species to marine biodiversity
Molnar, J. L., Gamboa, R. L., Revenga, C., & Spalding, M. D. (2008) · Frontiers in Ecology and the Environment · doi:10.1890/070064 · Cited by 1,538
Dispersal, Gene Flow, and Population Structure
Bohonak, A. J. (1999) · The Quarterly Review of Biology · doi:10.1086/392950 · Cited by 1,237
Mitochondrial DNA as a marker of molecular diversity: a reappraisal
Galtier, N., Nabholz, B., Glémin, S., & Hurst, G. D. D. (2009) · Molecular Ecology · doi:10.1111/j.1365-294x.2009.04380.x · Cited by 1,189
Research works printed but not linked: 5
- Millar, R. H. In L.M.B.C. Memoirs of typical British marine palnts and animals, XXXV (ed J. S. Colman ) 123 (Liverpool University Press, 1953).
- Carver, C. E., Mallet, A. L. & Vercaemer, B. Biological synopsis of the solitary tunicate Ciona intestinalis . Can. Man. Rep. Fish. Aquat. Sci. 2746, v+ 55p. (2006).
- Bouchemousse, S., Haag-Liautard, C., Bierne, N. & Viard, F. Past and contemporary introgression between two strongly differentiated Ciona species as revealed by a post-genomic SNPs panel. BioRxiv, doi: 10.1101/030346 (2015). · DOI
- Guillemin, M.-L. et al. In Seaweed Phylogeography (eds Zi-Min Hu & Ceridwen Fraser ) Ch. 10, 251–277 (Springer Netherlands, 2016).
- Brante, A., Fernandez, M. & Viard, F. Phylogeography and biogeography concordance in the marine gastropod Crepipatella dilatata (Calyptraidae) along the South Eastern Pacific coast J. Heredity 103, 630–637, doi: 10.11093/jhered/ess030 (2012). · DOI
Cited by
Mixotrophic flagellate ingestion boosts microplastic accumulation in ascidians
Pennati, R., Castelletti, C., Parolini, M., Scarì, G., & Mercurio, S. (2022) · Journal of Experimental Zoology Part A: Ecological and Integrative Physiology · doi:10.1002/jez.2596 · Cited by 19
Metadata
- Authors
- Bouchemousse, S., Bishop, J. D. D., & Viard, F.
- Affiliations
- Centre National de la Recherche Scientifique (FR)
- Marine Biological Association of the United Kingdom (GB)
- Corresponding author
- Bouchemousse, Sarah
- Viard, Frédérique
- Venue
- Scientific Reports
- Published
- 2016-05-03
- Volume
- 6
- Issue
- 1
- Pages
- 24875-24875
- ISSN
- 2045-2322 (ISSN-L)
- PMC
- PMC4853746
- OpenAlex
- W2346624115
- Cited by
- 85
- References
- 82
- Citations by year
- 2026: 4 · 2025: 6 · 2024: 5 · 2023: 3 · 2022: 10 · 2021: 6 · 2020: 12 · 2019: 11 · 2018: 12 · 2017: 12 · 2016: 4
- FWCI
- 10.50
- Type
- journal article
- Language
- en
- Open access
- gold
- doi.org
- Locations
- Scientific Reports (publishedVersion, cc-by)
- PubMed Central (publishedVersion, cc-by)
- PubMed (publishedVersion)
- Marine Biological Association (acceptedVersion)
- HAL (submittedVersion, cc-by)
- Funders
- Agence Nationale de la Recherche (ANR-12-BSV7-0011, ANR-12)
- Centre National de la Recherche Scientifique
- Institut National de la Recherche Agronomique
- Muséum National d'Histoire Naturelle
- Interreg
- Topics
- Life Sciences › Biochemistry, Genetics and Molecular Biology › Genetics › Genetic diversity and population structure
- Physical Sciences › Environmental Science › Global and Planetary Change › Marine Ecology and Invasive Species
- Physical Sciences › Earth and Planetary Sciences › Oceanography › Marine Biology and Ecology Research
- Keywords
- Ciona robusta, Ciona intestinalis, invasive species, biogeography, genetic diversity, mitochondrial DNA, sympatric populations, allopatric populations, human-mediated dispersal, North Atlantic distribution, Pacific Ocean distribution
- MeSH terms
- Animals, Ciona intestinalis, DNA, Mitochondrial, Europe, North America, South America, Genetic Variation, Sequence Analysis, DNA, Phylogeography
About these checks
Registry, retraction, Cites and statistics results are computed, not judged, with one exception: a printed reference that no index lists is read once by a model before it counts as a citation error. Claims are extracted by a model and kept only when their quote appears verbatim in the text; each cited source is then checked, with a model’s help, for whether it says what the claim relies on. Those verdicts can be wrong — read the claim’s quote and the cited source before relying on one.
Statistics and arithmetic are recomputed, not judged.
Confidence bands are shown only for fields calibrated on our annotated test set. None is calibrated yet, so no band is shown.
What counts as a claim ›How we measure confidence ›How we check this ›
Are you an author, or do you see a problem with this page? Request a review
How to cite
Cite CoChat for the checks on this page, and the paper for its own findings.
- This page
- CoChat. (2026). Citation check: Contrasting global genetic patterns in two biologically similar, widespread and invasive Ciona species (Tunicata, Ascidiacea). https://app.cochat.ai/papers/10.1038/srep24875
- The paper
- Bouchemousse, S., Bishop, J. D. D., & Viard, F. (2016). Contrasting global genetic patterns in two biologically similar, widespread and invasive Ciona species (Tunicata, Ascidiacea). Scientific Reports. https://doi.org/10.1038/srep24875
Data sources
Bibliographic data: Semantic Scholar, OpenAlex, Crossref.
Contains information from the Semantic Scholar Academic Graph Datasets, made available under the ODC Attribution License (ODC-BY 1.0).
Semantic Scholar’s data is described in: Kinney, R., et al. (2023). The Semantic Scholar Open Data Platform. arXiv:2301.10140.
