

The DOI matches its Crossref record; 38 of the 38 references it cites were found in a registry or an index.
FFPred 3: feature-based function prediction for all Gene Ontology domains
Open accessAbstract
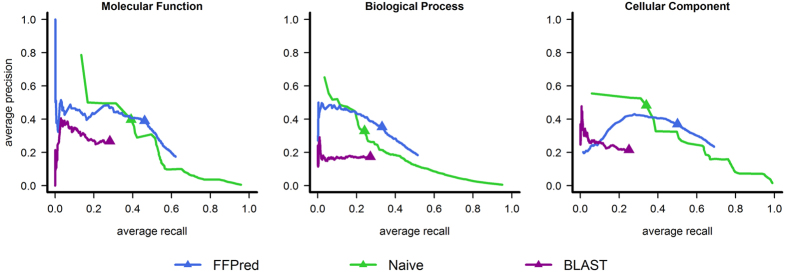
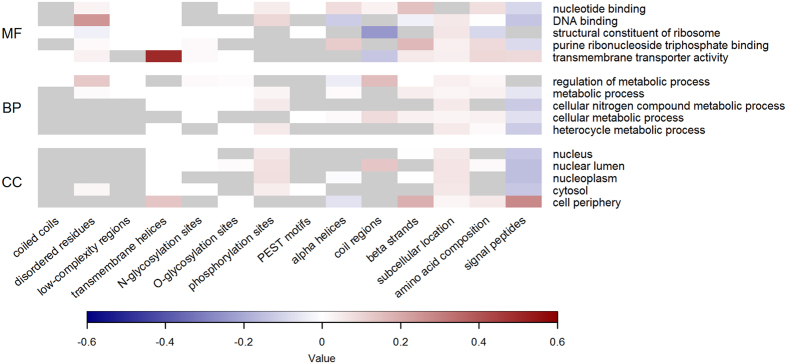
Predicting protein function has been a major goal of bioinformatics for several decades, and it has gained fresh momentum thanks to recent community-wide blind tests aimed at benchmarking available tools on a genomic scale. Sequence-based predictors, especially those performing homology-based transfers, remain the most popular but increasing understanding of their limitations has stimulated the development of complementary approaches, which mostly exploit machine learning. Here we present FFPred 3, which is intended for assigning Gene Ontology terms to human protein chains, when homology with characterized proteins can provide little aid. Predictions are made by scanning the input sequences against an array of Support Vector Machines (SVMs), each examining the relationship between protein function and biophysical attributes describing secondary structure, transmembrane helices, intrinsically disordered regions, signal peptides and other motifs. This update features a larger SVM library that extends its coverage to the cellular component sub-ontology for the first time, prompted by the establishment of a dedicated evaluation category within the Critical Assessment of Functional Annotation. The effectiveness of this approach is demonstrated through benchmarking experiments, and its usefulness is illustrated by analysing the potential functional consequences of alternative splicing in human and their relationship to patterns of biological features.
Overview
The claims and statistics of this paper haven’t been checked yet.
Free: it reads the open-access text and checks the first 5 claims that cite a source we can check. Create a free account to check every claim.
Integrity signals
Registry
Cites
Statistics
Figures




Verification
Claims the paper makes
The claims and statistics of this paper haven’t been checked yet.
Free: it reads the open-access text and checks the first 5 claims that cite a source we can check. Create a free account to check every claim.
Claims other papers make about this one
Each is checked against this paper’s own text: does it say what the citing paper says it does?
The cited source says what the claim attributes to it.
In the citing paper
“Thus, for many of the proteins where functions have been assigned, methods that are not dependent on homology were prevalent (e.g., FFPred316, Fig. 5 and S6).”
From Environmental conditions shape the nature of a minimal bacterial genome (2019) · cites this paper as [16]
Self-check
Percentages, sums and reported differences re-computed from the paper’s own numbers.
The self-check needs the paper’s full text.
Citations
Cites
Basic local alignment search tool
Altschul, S. F., Gish, W., Miller, W., Myers, E. W., & Lipman, D. J. (1990) · Journal of Molecular Biology · doi:10.1006/jmbi.1990.9999 · Cited by 98,669
Gene Ontology: tool for the unification of biology
Ashburner, M., Ball, C. A., Blake, J. A., Botstein, D., Butler, H., Cherry, J. M., Davis, A. P., Dolinski, K., Dwight, S. S., Eppig, J. T., et al. (2000) · Nature Genetics · doi:10.1038/75556 · Cited by 43,206
Probabilistic Outputs for Support vector Machines and Comparisons to Regularized Likelihood Methods
Platt, J. C. (1999) · Cited by 6,385
UniProt: a hub for protein information
The UniProt Consortium (2015) · Nucleic Acids Research · doi:10.1093/nar/gku989 · Cited by 5,106
Making Large-Scale SVM Learning Practical
Joachims, T. (1998) · RePEc: Research Papers in Economics · doi:10.17877/de290r-14262 · Cited by 4,411
Intrinsically unstructured proteins: re-assessing the protein structure-function paradigm
Wright, P. E., & Dyson, H. J. (1999) · Journal of Molecular Biology · doi:10.1006/jmbi.1999.3110 · Cited by 2,968
Intrinsically disordered proteins in cellular signalling and regulation
Wright, P. E., & Dyson, H. J. (2015) · Nature Reviews Molecular Cell Biology · doi:10.1038/nrm3920 · Cited by 2,401
Machine learning applications in genetics and genomics
Libbrecht, M. W., & Noble, W. S. (2015) · Nature Reviews Genetics · doi:10.1038/nrg3920 · Cited by 2,084
UniRef clusters: a comprehensive and scalable alternative for improving sequence similarity searches
Suzek, B. E., Wang, Y., Huang, H., McGarvey, P. B., Wu, C. H., & the UniProt Consortium (2015) · Bioinformatics · doi:10.1093/bioinformatics/btu739 · Cited by 1,928
Advances in Large-Margin Classifiers
(2000) · The MIT Press eBooks · doi:10.7551/mitpress/1113.001.0001 · Cited by 1,869
Cited by
A guide to machine learning for biologists
Greener, J. G., Kandathil, S. M., Moffat, L., & Jones, D. T. (2022) · Nature Reviews Molecular Cell Biology · doi:10.1038/s41580-021-00407-0 · Cited by 2,127
Self-citationThe PSIPRED Protein Analysis Workbench: 20 years on
Buchan, D. W. A., & Jones, D. T. (2019) · Nucleic Acids Research · doi:10.1093/nar/gkz297 · Cited by 1,351
Self-citationStructure-based protein function prediction using graph convolutional networks
Gligorijević, V., Renfrew, P. D., Kosciolek, T., Leman, J. K., Berenberg, D., Vatanen, T., Chandler, C., Taylor, B. C., Fisk, I. M., Vlamakis, H., et al. (2021) · Nature Communications · doi:10.1038/s41467-021-23303-9 · Cited by 906
Kulmanov, M., Khan, M. A., & Hoehndorf, R. (2018) · Bioinformatics · doi:10.1093/bioinformatics/btx624 · Cited by 558
The language of proteins: NLP, machine learning & protein sequences
Ofer, D., Brandes, N., & Linial, M. (2021) · Computational and Structural Biotechnology Journal · doi:10.1016/j.csbj.2021.03.022 · Cited by 339
Metadata
- Authors
- Cozzetto, D., Minneci, F., Currant, H., & Jones, D. T.
- Affiliations
- University College London (GB)
- Corresponding author
- Jones, David T.
- Venue
- Scientific Reports
- Published
- 2016-08-26
- Volume
- 6
- Issue
- 1
- Pages
- 31865-31865
- ISSN
- 2045-2322 (ISSN-L)
- PMC
- PMC4999993
- OpenAlex
- W2514044079
- Cited by
- 127
- References
- 38
- Citations by year
- 2026: 7 · 2025: 14 · 2024: 15 · 2023: 14 · 2022: 12 · 2021: 19 · 2020: 20 · 2019: 11 · 2018: 11 · 2017: 4
- FWCI
- 4.51
- Type
- journal article
- Language
- en
- Open access
- gold
- doi.org
- Licence
- cc-by
- creativecommons.org/licenses/by/4.0 (tdm)
- creativecommons.org/licenses/by/4.0 (vor)
- Locations
- Scientific Reports (publishedVersion, cc-by)
- PubMed Central (publishedVersion, cc-by)
- PubMed (publishedVersion)
- UCL Discovery (University College London) (submittedVersion)
- Funders
- University College London
- Directorate for Biological Sciences
- Biotechnology and Biological Sciences Research Council (BB/L002817/1, BB/L020505/1)
- Topics
- Life Sciences › Biochemistry, Genetics and Molecular Biology › Molecular Biology › Machine Learning in Bioinformatics
- Life Sciences › Biochemistry, Genetics and Molecular Biology › Molecular Biology › Bioinformatics and Genomic Networks
- Life Sciences › Biochemistry, Genetics and Molecular Biology › Molecular Biology › Protein Structure and Dynamics
- Keywords
- protein function prediction, Gene Ontology, support vector machine, feature-based prediction, secondary structure, transmembrane helices, intrinsically disordered regions, signal peptide, alternative splicing, human protein
- MeSH terms
- Humans, Computational Biology, Gene Ontology
About these checks
Registry, retraction, Cites and statistics results are computed, not judged, with one exception: a printed reference that no index lists is read once by a model before it counts as a citation error. Claims are extracted by a model and kept only when their quote appears verbatim in the text; each cited source is then checked, with a model’s help, for whether it says what the claim relies on. Those verdicts can be wrong — read the claim’s quote and the cited source before relying on one.
Statistics and arithmetic are recomputed, not judged.
Confidence bands are shown only for fields calibrated on our annotated test set. None is calibrated yet, so no band is shown.
What counts as a claim ›How we measure confidence ›How we check this ›
Are you an author, or do you see a problem with this page? Request a review
How to cite
Cite CoChat for the checks on this page, and the paper for its own findings.
- This page
- CoChat. (2026). Citation check: FFPred 3: feature-based function prediction for all Gene Ontology domains. https://app.cochat.ai/papers/10.1038/srep31865
- The paper
- Cozzetto, D., Minneci, F., Currant, H., & Jones, D. T. (2016). FFPred 3: feature-based function prediction for all Gene Ontology domains. Scientific Reports. https://doi.org/10.1038/srep31865
Data sources
Bibliographic data: Semantic Scholar, OpenAlex, Crossref.
Contains information from the Semantic Scholar Academic Graph Datasets, made available under the ODC Attribution License (ODC-BY 1.0).
Semantic Scholar’s data is described in: Kinney, R., et al. (2023). The Semantic Scholar Open Data Platform. arXiv:2301.10140.
