

The DOI matches its Crossref record; 41 of the 41 references it cites were found in a registry or an index.
Inhibition of NUCKS Facilitates Corneal Recovery Following Alkali Burn
Abstract
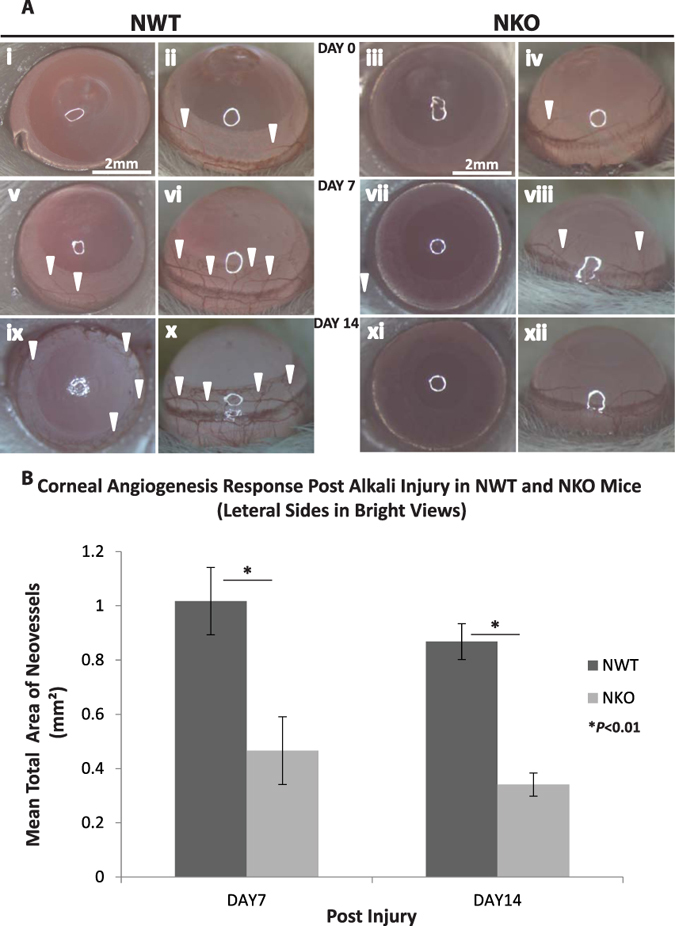
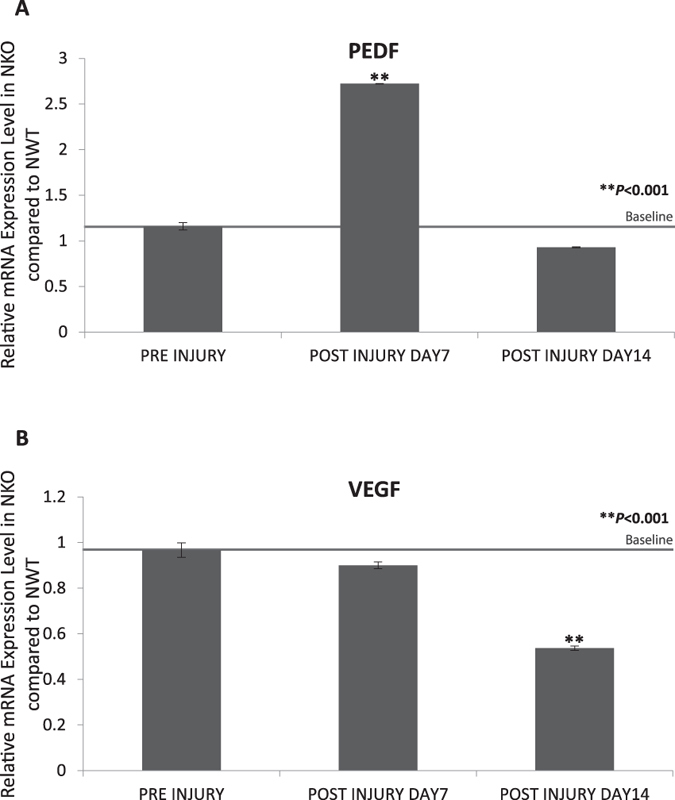
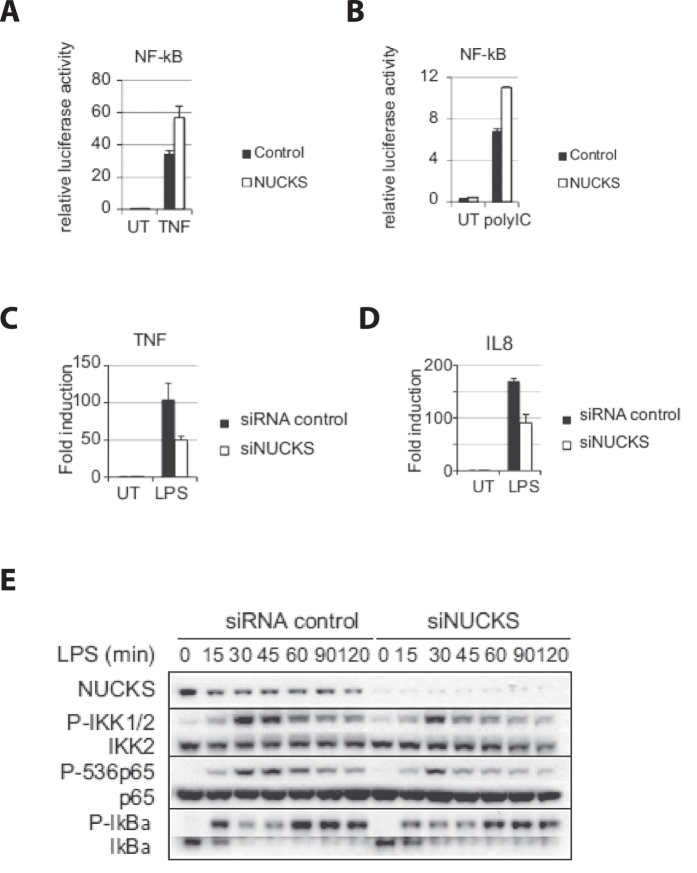
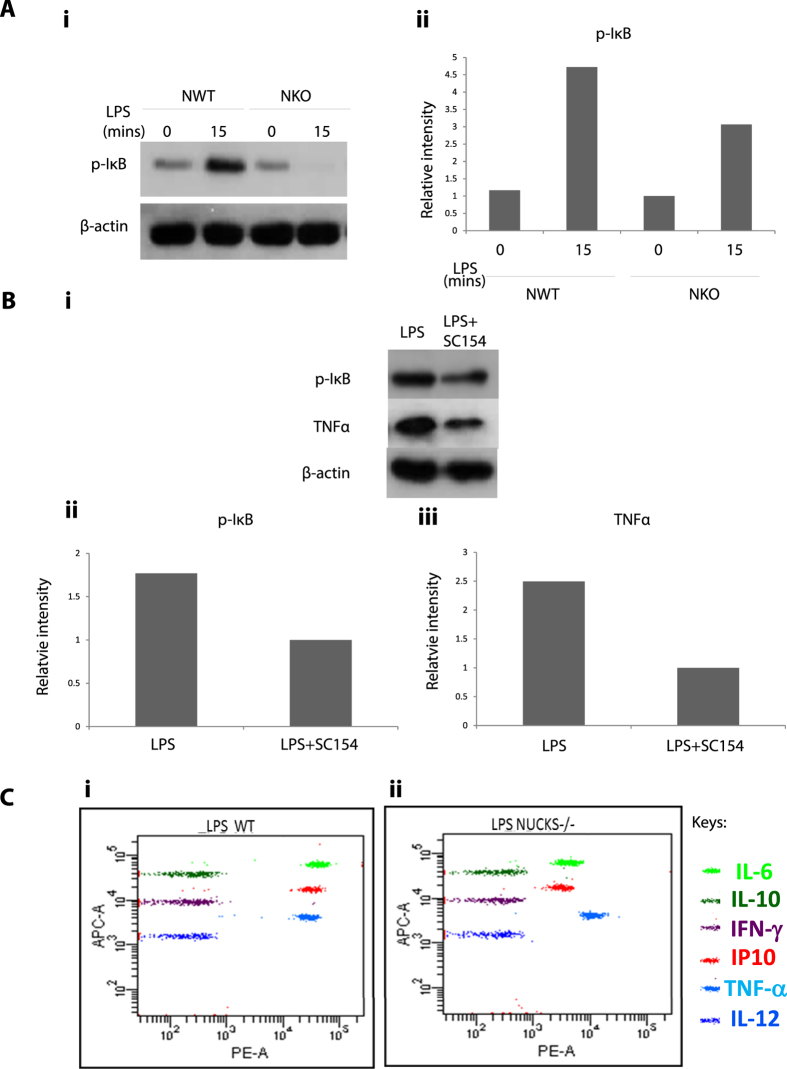
Corneal wound healing involves a complex cascade of cytokine-controlled cellular events, including inflammatory and angiogenesis responses that are regulated by transcriptional chromatin remodeling. Nuclear Ubiquitous Casein and cyclin-dependent Kinase Substrate (NUCKS) is a key chromatin modifier and transcriptional regulator of metabolic signaling. In this study, we investigated the role of NUCKS in corneal wound healing by comparing its effects on corneal alkali burn in NUCKS knockout (NKO) and NUCKS wild-type (NWT) mice. Our data showed that following alkali-injury, inhibition of NUCKS (NKO) accelerated ocular resurfacing and suppressed neovascularization; the cytokine profile of alkali burned corneas in NKO mice showed suppressed expression of inflammation cytokines (IL1A & IL1B); upregulated expression of antiangiogenic factor (Pigment Epithelium-derived Factor; PEDF); and downregulated expression of angiogenic factor (Vascular Endothelial Growth Factor, VEGF); in vitro, following LPS-induced NFκB activation, NKO corneal cells showed reduced expression of IL6, IP10 and TNFα. In vitro, corneal epithelial cells showed reduced NF-κb activation on silencing of NUCKS and corresponding NFκB-mediated cytokine expression was reduced. Here, we illustrate that inhibition of NUCKS played a role in cytokine modulation and facilitated corneal recovery. This reveals a potential new effective strategy for ocular burn treatment.
Overview
The claims and statistics of this paper haven’t been checked yet.
Run the check — free, no account needed. It reads the open-access text and checks the sources it cites.
Integrity signals
Registry
Cites
Statistics
Figures
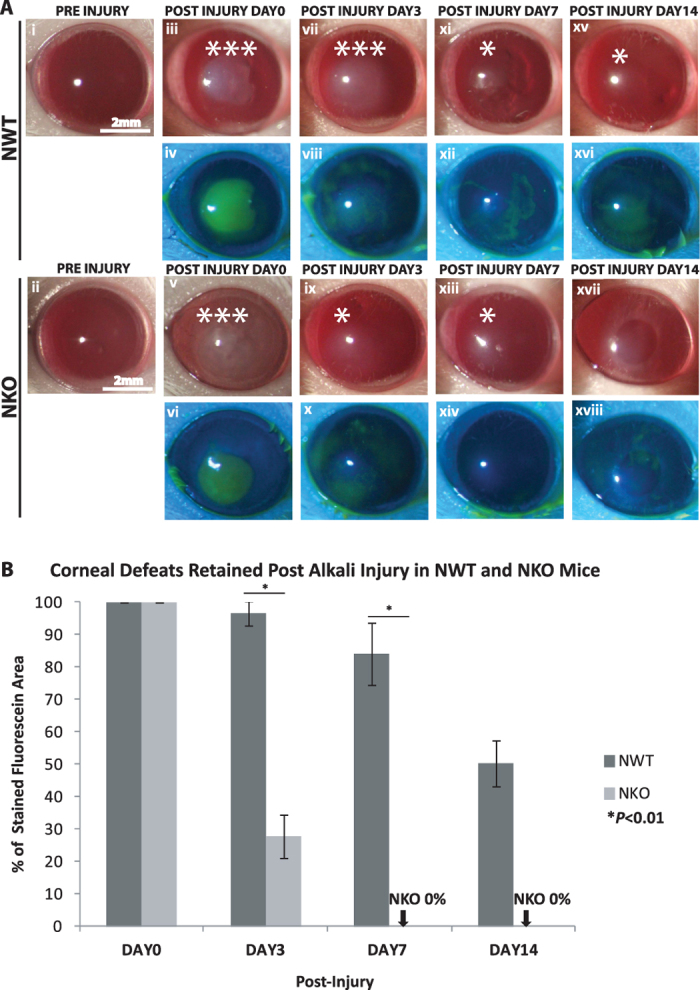
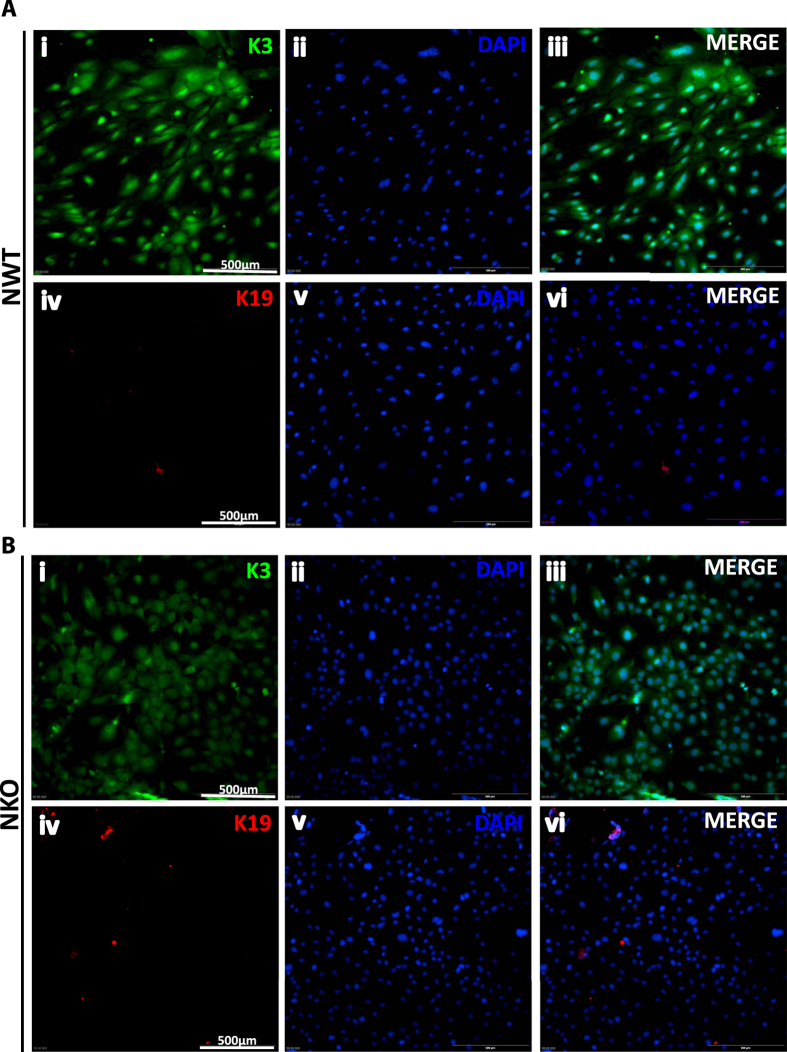
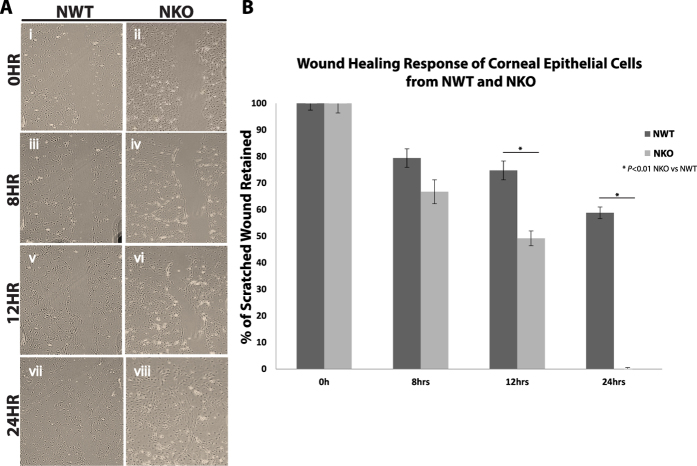
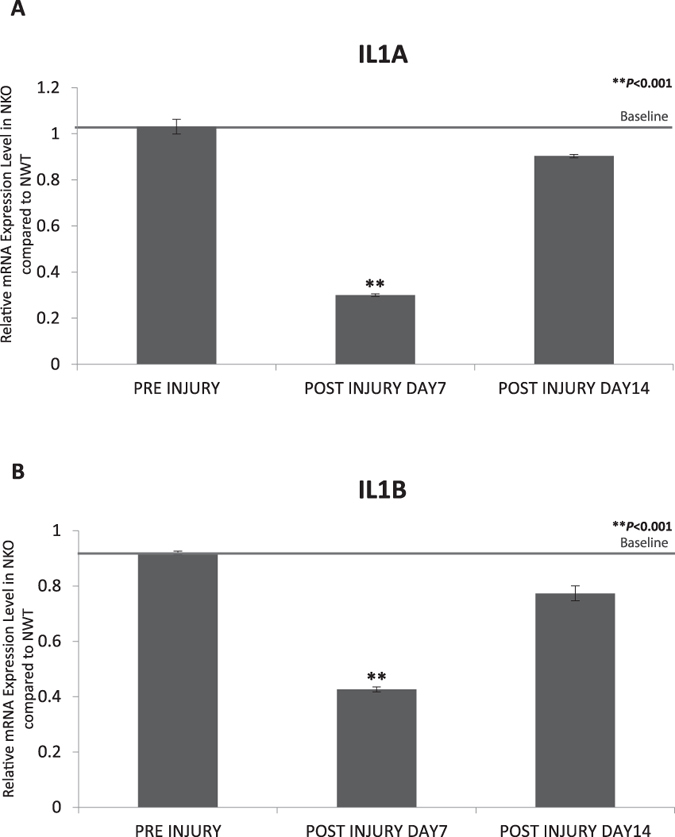
Verification
Claims the paper makes
The claims and statistics of this paper haven’t been checked yet.
Run the check — free, no account needed. It reads the open-access text and checks the sources it cites.
Claims other papers make about this one
Each is checked against this paper’s own text: does it say what the citing paper says it does?
The cited source says what the claim attributes to it.
In the citing paper
“In addition to these critical effectors, several members of the AD-specific miR-132 predicted targetome that we identified, e.g. TRIM44, NUCKS1, NFE2L2, LYN, ZEB2, SPRED1, ABHD5, RASA1, and NAP1L1 [143, 147–154], have known roles in inflammation and/or microglial cell states/function.”
From microRNA-132 attenuates inflammation in induced pluripotent stem cell-derived microglia from Alzheimer’s disease patients (2026) · cites this paper as [148]
Self-check
Percentages, sums and reported differences re-computed from the paper’s own numbers.
The self-check needs the paper’s full text.
Citations
Cites
PERSPECTIVE ARTICLE: Growth factors and cytokines in wound healing
Barrientos, S., Stojadinovic, O., Golinko, M. S., Brem, H., & Tomic‐Canic, M. (2008) · Wound Repair and Regeneration · doi:10.1111/j.1524-475x.2008.00410.x · Cited by 3,583
4 Histology and Histopathology
(2015) · Burghardt’s Colposcopy and Cervical Pathology · doi:10.1055/b-0035-108581 · Cited by 1,043
The Corneal Wound Healing Response:
Wilson, S. E., Mohan, R. R., Mohan, R. R., Ambrósio, R., Hong, J., & Lee, J. (2001) · Progress in Retinal and Eye Research · doi:10.1016/s1350-9462(01)00008-8 · Cited by 611
Tumor Invasion: Role of Growth Factor-Induced Cell Motility
(1999) · Advances in Cancer Research · doi:10.1016/s0065-230x(08)61023-4 · Cited by 330
Gene Expression Patterns in Ovarian Carcinomas
Schaner, M. E., Ross, D. T., Ciaravino, G., Sørlie, T., Troyanskaya, O., Diehn, M., Wang, Y. C., Duran, G. E., Sikic, T. L., Caldeira, S., et al. (2003) · Molecular Biology of the Cell · doi:10.1091/mbc.e03-05-0279 · Cited by 327
Noncanonical NF-κB Signaling in Health and Disease
Cildir, G., Low, K. C., & Tergaonkar, V. (2016) · Trends in Molecular Medicine · doi:10.1016/j.molmed.2016.03.002 · Cited by 301
Self-citationCyclooxygenase 2 is a key enzyme for inflammatory cytokine‐induced angiogenesis
Kuwano, T., Nakao, S., Yamamoto, H., Tsuneyoshi, M., Yamamoto, T., Kuwano, M., & Ono, M. (2004) · The FASEB Journal · doi:10.1096/fj.03-0473com · Cited by 279
Murakami, S., Lefebvre, V., & de Crombrugghe, B. (2000) · Journal of Biological Chemistry · doi:10.1074/jbc.275.5.3687 · Cited by 269
Telomere-independent Rap1 is an IKK adaptor and regulates NF-κB-dependent gene expression
Teo, H., Ghosh, S., Luesch, H., Ghosh, A., Wong, E. T., Malik, N. B. A., Orth, A. P., Jesus, P. D. D., Perry, A. S., Oliver, J. D., et al. (2010) · Nature Cell Biology · doi:10.1038/ncb2080 · Cited by 230
Self-citationArlt, A., Vorndamm, J., Breitenbroich, M., Fölsch, U. R., Kalthoff, H., Schmidt, W. E., & Schäfer, H. (2001) · Oncogene · doi:10.1038/sj.onc.1204168 · Cited by 227
Non-canonical NF-κB signalling and ETS1/2 cooperatively drive C250T mutant TERT promoter activation
Li, Y., Zhou, Q.-L., Sun, W., Chandrasekharan, P., Cheng, H. S., Ying, Z., Lakshmanan, M., Raju, A., Tenen, D. G., Cheng, S., et al. (2015) · Nature Cell Biology · doi:10.1038/ncb3240 · Cited by 198
Self-citationZhang, J., Xu, K., Ambati, B., & Yu, F.-S. X. (2003) · Investigative Opthalmology & Visual Science · doi:10.1167/iovs.03-0219 · Cited by 182
Noncanonical Functions of Telomerase: Implications in Telomerase-Targeted Cancer Therapies
Li, Y., & Tergaonkar, V. (2014) · Cancer Research · doi:10.1158/0008-5472.can-13-3568 · Cited by 180
Self-citationCytokine expression in the alkali-burned cornea
Sotozono, C., He, J., Matsumoto, Y., Kita, M., Imanishi, J., & Kinoshita, S. (1997) · Current Eye Research · doi:10.1076/ceyr.16.7.670.5057 · Cited by 171
Rho protein GTPases and their interactions with NFκB: crossroads of inflammation and matrix biology
Tong, L. H. T., & Tergaonkar, V. (2014) · Bioscience Reports · doi:10.1042/bsr20140021 · Cited by 167
Self-citationNuclear Factor-κB: Central Regulator in Ocular Surface Inflammation and Diseases
Lan, W., Petznick, A., Heryati, S., Rifada, R. M., & Tong, L. H. T. (2012) · The Ocular Surface · doi:10.1016/j.jtos.2012.04.001 · Cited by 164
Telomerase regulates MYC-driven oncogenesis independent of its reverse transcriptase activity
Koh, C. M., Khattar, E., Leow, S. C., Liu, C. Y., Müller, J., Ang, W. X., Li, Y., Franzoso, G., Li, S., Guccione, E., et al. (2015) · Journal of Clinical Investigation · doi:10.1172/jci79134 · Cited by 163
Self-citationEbihara, N., Matsuda, A., Nakamura, S., Matsuda, H., & Murakami, A. (2011) · Investigative Opthalmology & Visual Science · doi:10.1167/iovs.11-7956 · Cited by 147
DEAD-box helicase DP103 defines metastatic potential of human breast cancers
Shin, E. M., Hay, H. S., Lee, M. H., Goh, J. N., Tan, T. Z., Sen, Y. P., Lim, S. W., Yousef, E. M., Ong, H. T., Thike, A. A., et al. (2014) · Journal of Clinical Investigation · doi:10.1172/jci73451 · Cited by 134
Self-citationExpression of Smad7 in Mouse Eyes Accelerates Healing of Corneal Tissue after Exposure to Alkali
Saika, S., Ikeda, K., Yamanaka, O., Miyamoto, T. K., Ohnishi, Y., Sato, M., Muragaki, Y., Ooshima, A., Nakajima, Y., Kao, W. W. ‐., et al. (2005) · American Journal Of Pathology · doi:10.1016/s0002-9440(10)62358-9 · Cited by 132
Regulation of keratinocyte growth factor gene expression in human skin fibroblasts
Tang, A., & Gilchrest, B. A. (1996) · Journal of Dermatological Science · doi:10.1016/0923-1811(95)00418-1 · Cited by 107
Local suppression of IL-1 by receptor antagonist in the rat model of corneal alkali injury
Yamada, J., Dana, M. R., Sotozono, C., & Kinoshita, S. (2003) · Experimental Eye Research · doi:10.1016/s0014-4835(02)00293-2 · Cited by 103
Dong, J., Jimi, E., Zeiss, C. J., Hayden, M. S., & Ghosh, S. (2010) · Genes & Development · doi:10.1101/gad.1958410 · Cited by 100
Sun, Y., Zhang, Y., Li, X., Deng, M., Gao, W., Yao, Y., Chiu, S., Liang, X., Gao, F., Chan, C. W. Y., et al. (2015) · Stem Cells · doi:10.1002/stem.2094 · Cited by 85
Self-citationDey, A., Wong, E.-T., Kua, N., et al. (2008) · Cell Cycle · doi:10.4161/cc.7.23.7213 · Cited by 77
Role of ErbB2 in Corneal Epithelial Wound Healing
Xu, K.-P., Riggs, A., Ding, Y., & Yu, F. X. (2004) · Investigative Ophthalmology & Visual Science · doi:10.1167/iovs.04-0119 · Cited by 58
Effects of Exogenous Interleukin-6 during Pseudomonas aeruginosa Corneal Infection
Cole, N., Krockenberger, M. B., Bao, S., Beagley, K. W., Husband, A. J., & Willcox, M. D. P. (2001) · Infection and Immunity · doi:10.1128/iai.69.6.4116-4119.2001 · Cited by 46
Wiśniewski, J. R., Zougman, A., Krüger, S., Ziolkowski, P. P., Pudełko, M., Bębenek, M., & Mann, M. (2008) · Proteins Structure Function and Bioinformatics · doi:10.1002/prot.22104 · Cited by 46
NUCKS Is a Positive Transcriptional Regulator of Insulin Signaling
Qiu, B., Shi, X., Wong, E. T., Lim, J., Bezzi, M., Low, D., Zhou, Q., Akıncılar, S. C., Lakshmanan, M., Swa, H. L. F., et al. (2014) · Cell Reports · doi:10.1016/j.celrep.2014.05.030 · Cited by 45
Self-citationInhibition of inflammatory corneal angiogenesis by TNP-470.
Joussen, A. M., Beecken, W.-D., Moromizato, Y., Schwartz, A., Kirchhof, B., & Poulaki, V. (2001) · PubMed · Cited by 43
Early Cytokine Synthesis in the Excised Mouse Cornea
Lausch, R. N., Chen, S., Tumpey, T. M., SU, Y.-H., & Oakes, J. E. (1996) · Journal of Interferon & Cytokine Research · doi:10.1089/jir.1996.16.35 · Cited by 43
Inhibition of RAP1 Enhances Corneal Recovery Following Alkali Injury
Poon, M.-W., Yan, L., Jiang, D., Qin, P., Tse, H., Wong, I. Y., Wong, D., Tergaonkar, V., & Lian, Q. (2015) · Investigative Ophthalmology & Visual Science · doi:10.1167/iovs.14-15268 · Cited by 42
Self-citationZiolkowski, P. P., Gamian, E., Osiecka, B. J., Zougman, A., & Wiśniewski, J. R. (2009) · BioMed Research International · doi:10.1155/2009/919645 · Cited by 39
Grundt, K., Haga, I. V., Aleporou‐Marinou, V., Drosos, Y., Wanvik, B., & Østvold, A. C. (2004) · Biochemical and Biophysical Research Communications · doi:10.1016/j.bbrc.2004.08.153 · Cited by 38
Sargent, L. M., Ensell, M., Østvold, A.-C., Baldwin, K. T., Kashon, M. L., Lowry, D. T., Senft, J. R., Jefferson, A. M., Johnson, R. C., Li, Z., et al. (2008) · Toxicology and Applied Pharmacology · doi:10.1016/j.taap.2008.01.031 · Cited by 36
NUCKS: a potential biomarker in cancer and metabolic disease
Qiu, B., Han, W., & Tergaonkar, V. (2015) · Clinical Science · doi:10.1042/cs20140656 · Cited by 34
Self-citationGrundt, K., Haga, I. V., Huitfeldt, H. S., & Østvold, A. C. (2007) · Biochimica et Biophysica Acta (BBA) - Molecular Cell Research · doi:10.1016/j.bbamcr.2007.05.013 · Cited by 31
Molesworth-Kenyon, S. J., Popham, N., Milam, A. A. V., Oakes, J. E., & Lausch, R. N. (2012) · International Journal of Inflammation · doi:10.1155/2012/810359 · Cited by 17
Poon, M.-W., He, J., Fang, X., Zhang, Z., Wang, W., Wang, J., Qiu, F., Tse, H., Li, W. S., Liu, Z., et al. (2015) · PLoS ONE · doi:10.1371/journal.pone.0131288 · Cited by 14
Self-citationPoon, M.-W., Tsang, W.-H., Waye, M. M. Y., & Chan, S. O. (2011) · PubMed · doi:10.14670/hh-26.953 · Cited by 12
Self-citationNF-κB–induced chromatin remodeling regulates angiogenesis
Keskin, D., & Kalluri, R. (2010) · Blood · doi:10.1182/blood-2010-03-274316 · Cited by 5
Cited by
Tran, K. A., Gilbert, M., Vazquez, B. N., Ianni, A., Garcia, B. A., Vaquero, A., & Berger, S. L. (2025) · Molecular Cell · doi:10.1016/j.molcel.2025.05.025 · Cited by 15
Penning, A., Snoeck, S., Ormaechea, O. R., Ayyildiz, D., Polzer, O., Buitrago-Arango, M., Capobianco, R., de Winter, F., Balusu, S., Verhaagen, J., et al. (2026) · Acta Neuropathologica Communications · doi:10.1186/s40478-026-02228-8 · Cited by 6
Metadata
- Authors
- Poon, M.-W., Jiang, D., Qin, P., Zhang, Y., Qiu, B., Chanda, S., Tergaonkar, V., Li, Q., Wong, I. Y., Yu, Z., Tse, H.-F., Wong, D. S. H., & Lian, Q.
- Venue
- Scientific Reports
- Published
- 2017-01-20
- Volume
- 7
- Issue
- 1
- ISSN
- 2045-2322
- PMC
- PMC5247723
- Cited by
- 25
- References
- 41
- Language
- en
- Licence
- creativecommons.org/licenses/by/4.0 (tdm)
- creativecommons.org/licenses/by/4.0 (vor)
About these checks
Registry, retraction, Cites and statistics results are computed, not judged, with one exception: a printed reference that no index lists is read once by a model before it counts as a citation error. Claims are extracted by a model and kept only when their quote appears verbatim in the text; each cited source is then checked, with a model’s help, for whether it says what the claim relies on. Those verdicts can be wrong — read the claim’s quote and the cited source before relying on one.
Statistics and arithmetic are recomputed, not judged.
Confidence bands are shown only for fields calibrated on our annotated test set. None is calibrated yet, so no band is shown.
What counts as a claim ›How we measure confidence ›How we check this ›
Are you an author, or do you see a problem with this page? Request a review
Data sources
Bibliographic data: Semantic Scholar, OpenAlex, Crossref.
Contains information from the Semantic Scholar Academic Graph Datasets, made available under the ODC Attribution License (ODC-BY 1.0).
Semantic Scholar’s data is described in: Kinney, R., et al. (2023). The Semantic Scholar Open Data Platform. arXiv:2301.10140.
