

The DOI matches its Crossref record; 52 of the 52 references it cites were found in a registry or an index.
Gene networks activated by specific patterns of action potentials in dorsal root ganglia neurons
Abstract
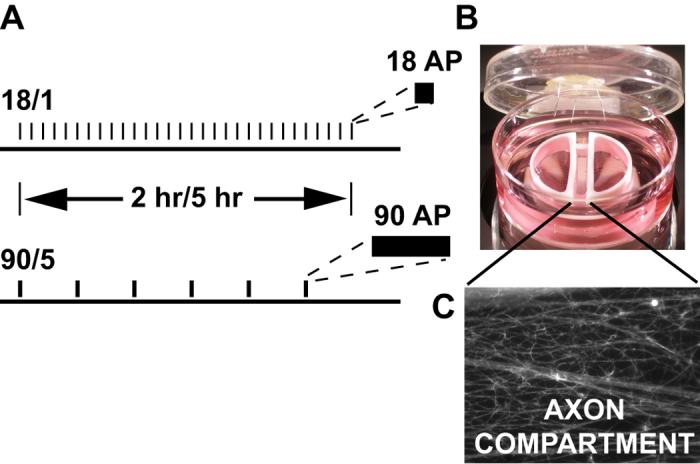
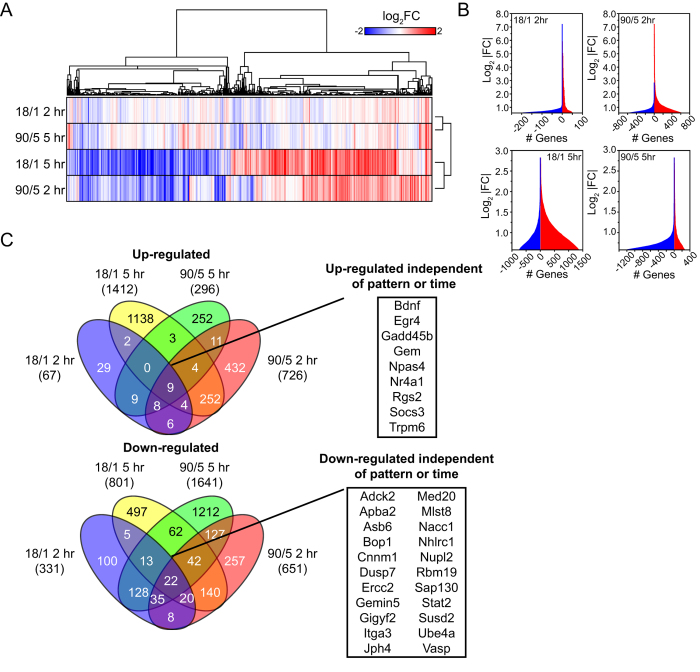
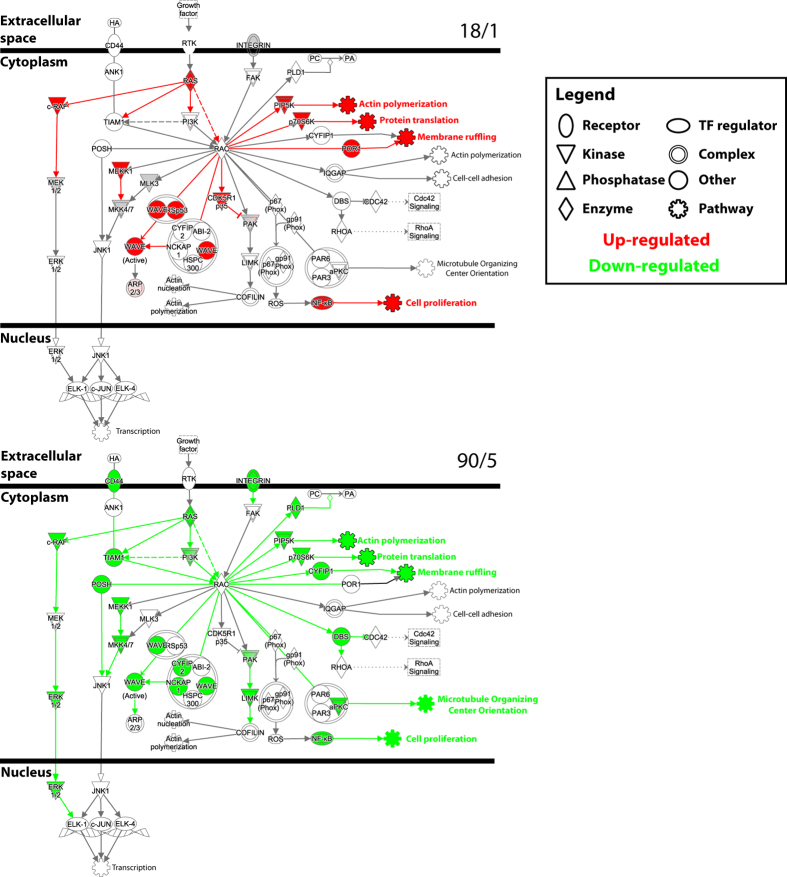
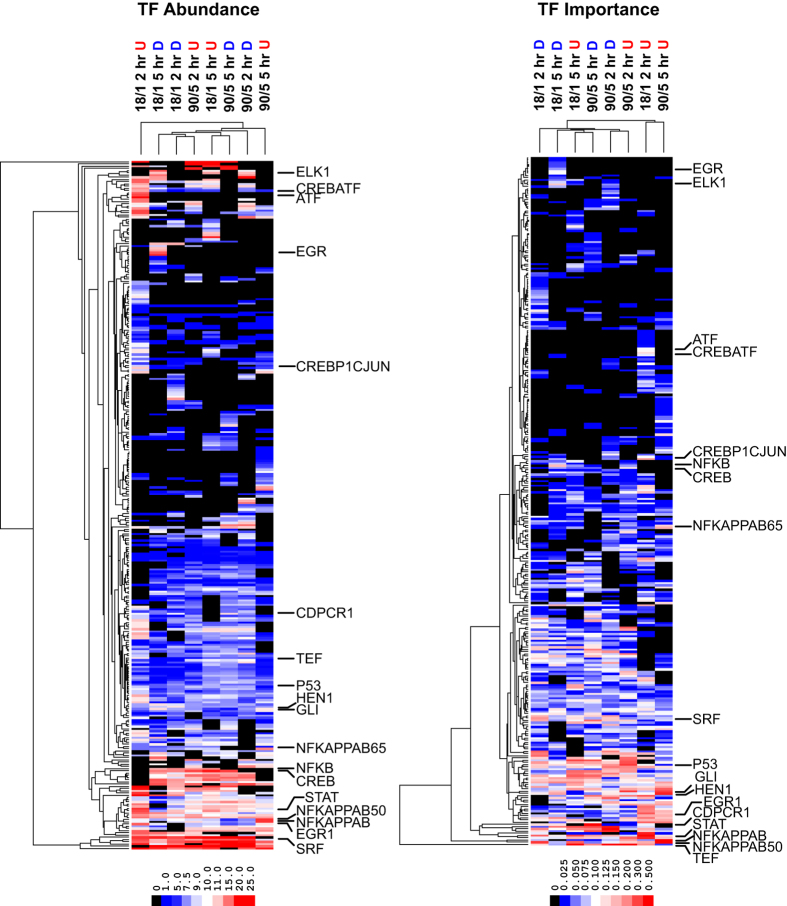
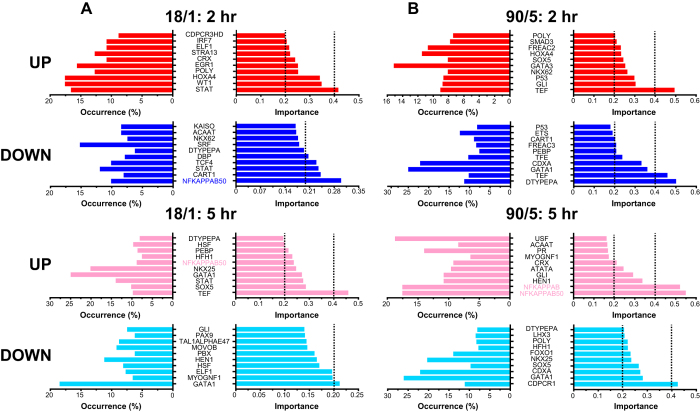
Gene regulatory networks underlie the long-term changes in cell specification, growth of synaptic connections, and adaptation that occur throughout neonatal and postnatal life. Here we show that the transcriptional response in neurons is exquisitely sensitive to the temporal nature of action potential firing patterns. Neurons were electrically stimulated with the same number of action potentials, but with different inter-burst intervals. We found that these subtle alterations in the timing of action potential firing differentially regulates hundreds of genes, across many functional categories, through the activation or repression of distinct transcriptional networks. Our results demonstrate that the transcriptional response in neurons to environmental stimuli, coded in the pattern of action potential firing, can be very sensitive to the temporal nature of action potential delivery rather than the intensity of stimulation or the total number of action potentials delivered. These data identify temporal kinetics of action potential firing as critical components regulating intracellular signalling pathways and gene expression in neurons to extracellular cues during early development and throughout life.
Overview
The claims and statistics of this paper haven’t been checked yet.
Run the check — free, no account needed. It reads the open-access text and checks the sources it cites.
Integrity signals
Registry
Cites
Statistics
Figures
Verification
Claims the paper makes
The claims and statistics of this paper haven’t been checked yet.
Run the check — free, no account needed. It reads the open-access text and checks the sources it cites.
Claims other papers make about this one
Each is checked against this paper’s own text: does it say what the citing paper says it does?
In the citing paper
“In one study, the temporal kinetics of neuronal firing was found to be intimately linked to GRN activity in dorsal root ganglia neurons, suggesting that the patterning of neuronal activity is interpreted by the GRN (47).”
From Behavior-related gene regulatory networks: A new level of organization in the brain (2020) · cites this paper as [47]
Self-check
Percentages, sums and reported differences re-computed from the paper’s own numbers.
The self-check needs the paper’s full text.
Citations
Cites
Subramanian, A., Tamayo, P., Mootha, V. K., Mukherjee, S., Ebert, B. L., Gillette, M. A., Paulovich, A., Pomeroy, S. L., Golub, T. R., Lander, E. S., et al. (2005) · Proceedings of the National Academy of Sciences · doi:10.1073/pnas.0506580102 · Cited by 53,625
Open source clustering software
de Hoon, M., Imoto, S., Nolan, J., & Miyano, S. (2004) · Bioinformatics · doi:10.1093/bioinformatics/bth078 · Cited by 3,056
Widespread transcription at neuronal activity-regulated enhancers
Kim, T.-K., Hemberg, M., Gray, J. M., Costa, A. M., Bear, D. M., Wu, J., Harmin, D. A., Laptewicz, M., Barbara-Haley, K., Kuersten, S., et al. (2010) · Nature · doi:10.1038/nature09033 · Cited by 2,450
Flavell, S. W., & Greenberg, M. E. (2008) · Annual Review of Neuroscience · doi:10.1146/annurev.neuro.31.060407.125631 · Cited by 832
Decreased expression of synapse-related genes and loss of synapses in major depressive disorder
Kang, H. J., Voleti, B., Hajszan, T., Rajkowska, G., Stockmeier, C. A., Licznerski, P., Lepack, A., Majik, M. S., Jeong, L. S., Banasr, M., et al. (2012) · Nature Medicine · doi:10.1038/nm.2886 · Cited by 808
Electrical activity in early neuronal development
Spitzer, N. C. (2006) · Nature · doi:10.1038/nature05300 · Cited by 807
Astrocytes promote myelination in response to electrical impulses
Ishibashi, T., Dakin, K. A., Stevens, B., Lee, P. R., Kozlov, S. V., Stewart, C. L., & Fields, R. D. (2006) · Neuron · doi:10.1016/j.neuron.2006.02.006 · Cited by 689
Self-citationGreer, P. L., & Greenberg, M. E. (2008) · Neuron · doi:10.1016/j.neuron.2008.09.002 · Cited by 661
Zhang, S., Zou, M., Lü, L., Lau, D., Ditzel, D. A. W., Delucinge-Vivier, C., Aso, Y., Descombes, P., & Bading, H. (2009) · PLoS Genetics · doi:10.1371/journal.pgen.1000604 · Cited by 326
Fields, R. D., Eshete, F., Stevens, B., & Itoh, K. (1997) · The Journal of Neuroscience · doi:10.1523/jneurosci.17-19-07252.1997 · Cited by 316
Self-citation
Cited by
Different Neuronal Activity Patterns Induce Different Gene Expression Programs
Tyssowski, K. M., DeStefino, N. R., Cho, J.-H., Dunn, C. J., Poston, R. G., Carty, C. E., Jones, R. D., Chang, S. M., Romeo, P., Wurzelmann, M. K., et al. (2018) · Neuron · doi:10.1016/j.neuron.2018.04.001 · Cited by 390
Behavior-related gene regulatory networks: A new level of organization in the brain
Sinha, S., Jones, B. M., Traniello, I. M., Bukhari, S. A., Halfon, M. S., Hofmann, H. A., Huang, S., Katz, P. S., Keagy, J., Lynch, V. J., et al. (2020) · Proceedings of the National Academy of Sciences · doi:10.1073/pnas.1921625117 · Cited by 85
Clayton, D. F., Anreiter, I., Aristizabal, M., Frankland, P. W., Binder, E. B., & Citri, A. (2020) · Proceedings of the National Academy of Sciences · doi:10.1073/pnas.1820837116 · Cited by 56
Metadata
- Authors
- Lee, P. R., Cohen, J. E., Iacobas, D. A., Iacobas, S., & Fields, R. D.
- Venue
- Scientific Reports
- Published
- 2017-03-03
- Volume
- 7
- Issue
- 1
- ISSN
- 2045-2322
- PMC
- PMC5335607
- Cited by
- 50
- References
- 52
- Language
- en
- Licence
- creativecommons.org/licenses/by/4.0 (tdm)
- creativecommons.org/licenses/by/4.0 (vor)
About these checks
Registry, retraction, Cites and statistics results are computed, not judged, with one exception: a printed reference that no index lists is read once by a model before it counts as a citation error. Claims are extracted by a model and kept only when their quote appears verbatim in the text; each cited source is then checked, with a model’s help, for whether it says what the claim relies on. Those verdicts can be wrong — read the claim’s quote and the cited source before relying on one.
Statistics and arithmetic are recomputed, not judged.
Confidence bands are shown only for fields calibrated on our annotated test set. None is calibrated yet, so no band is shown.
What counts as a claim ›How we measure confidence ›How we check this ›
Are you an author, or do you see a problem with this page? Request a review
Data sources
Bibliographic data: Semantic Scholar, OpenAlex, Crossref.
Contains information from the Semantic Scholar Academic Graph Datasets, made available under the ODC Attribution License (ODC-BY 1.0).
Semantic Scholar’s data is described in: Kinney, R., et al. (2023). The Semantic Scholar Open Data Platform. arXiv:2301.10140.
