

Retinal organoid chip: engineering a physiomimetic oxygen gradient for optimizing long term culture of human retinal organoids
Open accessThe DOI matches its Crossref record; 35 of the 35 references it cites were found in a registry or an index; 20 of the 32 sources its claims cite were checked for support.
Abstract
PDMS-free retinal organoid chip (ROC) holds 55 retinal organoids that can be manually seeded, cultured for extended periods at steep physiomimetic oxygen gradients, imaged, and retrieved.
Overview
CoChat Summary
TL;DR
The paper reports a PDMS-free retinal organoid chip (ROC) that maintains a vertical oxygen gradient from approximately 3% to 18% O2 and supports culture of 55 human iPSC-derived retinal organoids with in situ imaging and retrieval. ROCs with active perfusion and stable oxygen gradients showed higher retinal ganglion cell presence than static controls or ROCs without oxygen gradients.
Key findings
- The ROC holds 55 individual retinal organoids, supports extended culture (abstract: over 150 days; results: incubator set-up for 110 days), and enables in situ imaging and retrieval.
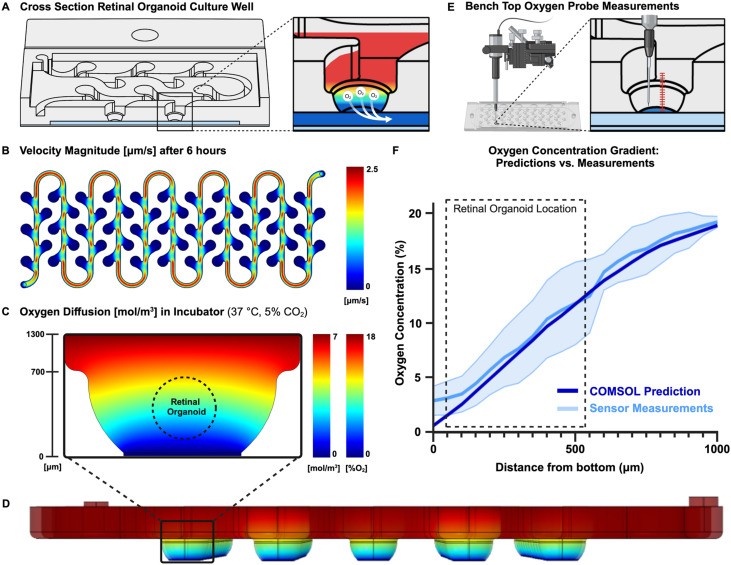
- The chip established an oxygen gradient of approximately 3% to 18% O2, closely mimicking in vivo retinal oxygen concentrations of 2% to 18% O2.
- At week 14 of differentiation, retinal organoids grown in the ROC with an oxygen gradient had a significantly higher amount of RGCs than the standard culture-dish control (p = 0.045; the text also reports “p value* = 0.454” for this comparison).
- Continuous microfluidic flow improved RGC quantity at week 10 compared with the standard retinal organoid differentiation protocol, and the oxygen gradient appeared to contribute positively to RGC survival at week 14.
Methods
- PDMS-free ROC fabricated from acrylic/PMMA, double-adhesive tape, a 0.25 μm PFA membrane, and a glass coverslip; designed with a single microfluidic channel connecting 55 round-bottom culture wells with organoid traps.
- Oxygen transport and fluid flow modeled with COMSOL Multiphysics using Fick’s law, laminar flow, and Navier–Stokes/continuity equations; oxygen gradient validated experimentally with PreSens oxygen microsensors across two chips and eight wells.
- Human DPSC-derived iPSCs differentiated into retinal organoids, transferred to ROC at week 6, cultured with or without an oxygen gradient versus dish controls; RGCs quantified by RBPMS/DAPI immunofluorescence, ImageJ binary image analysis, Shapiro–Wilk normality testing, and Welch’s t-test.
Limitations
- The paper states that removing organoids at different timepoints loses information about organoid orientation within the oxygen gradient, producing random slice orientations and cell phenotype ratios; it also notes that organoids should be stained for photoreceptors and other retinal phenotypes to verify effects on rods and cones.
- The paper states that ROCs are manually assembled with computer numerical controlled machining, which may create slight differences between chips and is time consuming; it suggests injection molding or heat bonding for future reproducibility.
- The paper states that the series configuration of culture wells leaves paracrine signaling and compound delivery effects uninvestigated, and that one syringe pump per channel limits incorporation of different biological groups requiring different media; the text also makes evident a small experimental replication (N = 2) and a p-value inconsistency for the week-14 comparison.
Model-written summary. Check it against the paper before relying on it.
Integrity signals
Registry
Cites
Statistics
Figures



Verification
Claims the paper makes
12 Valid · 3 Not valid · 6 Not checked · 50 Own results and interpretations
The cited sources that could be checked couldn’t confirm or dispute this claim.
In the paper
“The inner retina resides in a hypoxic environment (2% O2) adjacent to the vitreous cavity. Oxygenation levels rapidly increase towards the outer retina (18% O2) at the choroid.”
- Also stated in: § Introduction · plain
“The inner retina is kept in a hypoxic state, with partial pressures of oxygen maintained constantly below 15 mmHg (or 2% v/v).9 The oxygenation levels of the retina rapidly increase towards the outer retina and Bruch's membrane, reaching a maximum of approximately 140 mmHg (18% v/v) at the choroid (illustrated in Fig. S1†).9,10”
§ Retinal organoid chip: engineering a physiomimetic oxygen gradient for optimizing long term culture of human retinal organoids† > Abstract
What the sources say
- Not checked — no full text of the sourcecites [9] source
- Could not verifycites [10] sourceExperimental — accuracy not yet measured
The Retina and Endogenous Stem Cells section describes retinal anatomy and regeneration, but not an oxygen gradient. Searches for oxygen, hypoxia, 2% and 18% O2, and the stated oxygen pressures found no passage supporting the claimed levels. (LLM, conf=0.76)
plainstates a cause- Asserted: passes — The authors put it forward as true.
- Checkable: passes — It can be checked against evidence.
- Load-bearing: passes — The paper’s conclusions depend on it.
- Based: passes — The paper gives a reason why it holds.
- Also stated in: § Introduction · plain
The cited sources support only part of this claim — read each source’s verdict below.
In the paper
“Additionally, despite the existence of culture systems incorporating an oxygen gradient for other research purposes, none of the current systems are suitable for retinal organoid culture over extended periods of time because of the large size of organoids (up to 1000 μm), and extremely long culture times (several months).24”
§ Retinal organoid chip: engineering a physiomimetic oxygen gradient for optimizing long term culture of human retinal organoids† > Introduction
What the sources say
- Partly supportedcites [24] sourceExperimental — accuracy not yet measured
The Liver section (page unavailable) describes oxygen-gradient culture systems developed for liver research, supporting the statement that such systems exist for other purposes. It does not assess whether any existing system can accommodate retinal organoids up to 1000 μm or sustain their culture for several months, so the claimed unsuitability is unsupported. (LLM, conf=0.83)
plainstates a cause- Asserted: passes — The authors put it forward as true.
- Checkable: passes — It can be checked against evidence.
- Load-bearing: passes — The paper’s conclusions depend on it.
- Based: passes — The paper gives a reason why it holds.
- Partly supported
Every source the paper cites for this claim was checked and supports it.
In the paper
“This suggests that iPSC-derived organoids may benefit form spatial and temporal presentation of different oxygen tensions to mimic human embryogenesis.35”
§ Retinal organoid chip: engineering a physiomimetic oxygen gradient for optimizing long term culture of human retinal organoids† > Conclusion
What the sources say
- Supportedcites [35] source
The Future directions and concluding remarks section says different oxygen levels are needed at successive stages of embryonic development and that this knowledge can help organoids mimic native tissue microenvironments. The Oxygenating strategies in spheroids and organoids section discusses oxygen requirements within organoids, including human iPSC-derived organoids. Together, these passages support the citing sentence’s hedged suggestion; page numbers were not available in our copy. (LLM, conf=0.87)
hedgedstates a possible cause- Asserted: passes — The authors put it forward as true.
- Checkable: passes — It can be checked against evidence.
- Load-bearing: passes — The paper’s conclusions depend on it.
- Based: passes — The paper gives a reason why it holds.
- Supported
The cited sources support only part of this claim — read each source’s verdict below.
In the paper
“During embryogenesis, physiological oxygen concentration levels are significantly lower, primarily driving cellular proliferation.”
§ Retinal organoid chip: engineering a physiomimetic oxygen gradient for optimizing long term culture of human retinal organoids† > Conclusion
What the sources say
- Partly supportedcites [35] sourceExperimental — accuracy not yet measured
In “Roles of oxygen in early embryonic development,” the paper says the embryo experiences physiological hypoxia at very early stages and that low oxygen is required for embryonic stem cells to initiate proliferation. The claim extends this early-development finding to embryogenesis generally; the “Oxygen as a developmental morphogen” section also describes oxygen as guiding differentiation, not only proliferation. (LLM, conf=0.84)
plainstates a cause- Asserted: passes — The authors put it forward as true.
- Checkable: passes — It can be checked against evidence.
- Load-bearing: passes — The paper’s conclusions depend on it.
- Based: passes — The paper gives a reason why it holds.
- Partly supported
A result the paper reports from its own data — it cites no other source for it, so there is none to check. The quote shows it is in the paper.
In the paper
“ROCs that maintained active perfusion and stable oxygen gradients were successful in inducing higher viability of RGCs within retinal organoids than static controls, or ROC without oxygen gradients.”
- Also stated in: § Introduction · plain
“ROCs that maintained active perfusion and stable oxygen gradients were successful in inducing higher viability of RGCs within retinal organoids than static controls, or ROC without oxygen gradients.”
§ Retinal organoid chip: engineering a physiomimetic oxygen gradient for optimizing long term culture of human retinal organoids† > Abstract
plainstates a cause- Asserted: passes — The authors put it forward as true.
- Checkable: passes — It can be checked against evidence.
- Load-bearing: passes — The paper’s conclusions depend on it.
- Based: passes — The paper gives a reason why it holds.
- Rests on an assumption not shown here.
- Also stated in: § Introduction · plain
30 more claims
Create a free account to see all 71 claims and every source verdict.
- It may state two separate claims as one. 23
- Probably not a substantial claim. 20
Self-check
Percentages, sums and reported differences re-computed from the paper’s own numbers.
Each contradiction between two passages listed here was confirmed by an independent check.
Rated major: it would touch a result — a value a result rests on, reported and recomputed p-values on opposite sides of the significance level, two passages that conflict with no sign which is right, or a cited work retracted before this paper was published.
In the paper
§ Retinal organoid chip: engineering a physiomimetic oxygen gradient for optimizing long term culture of human retinal organoids† > Results and discussion > Retinal organoids in ROC
“At day 30 organoids were placed in the ROCs and cultured in an oxygen gradient or control setting.”
§ Retinal organoid chip: engineering a physiomimetic oxygen gradient for optimizing long term culture of human retinal organoids† > Materials and methods > iPSC culture and retinal organoid differentiation
“All cells were cultured in normoxia (18.6% O2) until week 6 of differentiation, then retinal organoids were added to the ROC, pre-treated with anti-adherence solution, or continued to grow in culture plates as control.”
Rated minor: it would not touch a result — a value no result rests on, a p-value that stays on the same side of the significance level, or a conflict that is clerical, resolved elsewhere in the paper, or outside its own findings.
In the paper
§ Retinal organoid chip: engineering a physiomimetic oxygen gradient for optimizing long term culture of human retinal organoids† > Results and discussion > ROC design and fabrication
“The ROCs are connected to the pumps with silicone tubing and 90 degree angled stainless steel injection needles.”
§ Retinal organoid chip: engineering a physiomimetic oxygen gradient for optimizing long term culture of human retinal organoids† > Materials and methods > Fluidic system set-up
“A microfluidic tubing network was established using two Legato® dual syringe pumps (KD Scientific, 788270) placed in the incubator, with syringes connected to 1/32′′ Tygon® PTFE tubing (Cole Parmer) with 1/32′′ barbed Luer connectors (Qosina).”
Rated minor: it would not touch a result — a value no result rests on, a p-value that stays on the same side of the significance level, or a conflict that is clerical, resolved elsewhere in the paper, or outside its own findings.
In the paper
§ Retinal organoid chip: engineering a physiomimetic oxygen gradient for optimizing long term culture of human retinal organoids† > Results and discussion > Retinal organoids in ROC
“Running a Welch's t-test between ‘in dish’ and ‘in ROC with oxygen gradient’ resulted in a significant difference at week 14 (p value* = 0.454).”
§ Retinal organoid chip: engineering a physiomimetic oxygen gradient for optimizing long term culture of human retinal organoids† > Results and discussion > Retinal organoids in ROC
“There is a significantly (p = 0.045) higher amount of RGCs present in retinal organoids grown in the ROC with the oxygen gradient compared to the control group grown with the standard organoid differentiation method in a culture dish.”
Rated minor: it would not touch a result — a value no result rests on, a p-value that stays on the same side of the significance level, or a conflict that is clerical, resolved elsewhere in the paper, or outside its own findings.
In the paper
§ Retinal organoid chip: engineering a physiomimetic oxygen gradient for optimizing long term culture of human retinal organoids† > Results and discussion > Oxygen gradient validation
“A two-dimensional model was created to define the oxygen concentration gradient within the culture well (Fig. 2C) and a three-dimensional model showed the oxygen concentrations throughout the ROC (Fig. 2D).”
§ Retinal organoid chip: engineering a physiomimetic oxygen gradient for optimizing long term culture of human retinal organoids† > Results and discussion > Computational prediction of system boundaries
“(B) This principle was modeled using a two-dimensional computational model made with COMSOL software, considering the diffusion of oxygen, convection by fluids and consumption of the cells. (C) A three-dimensional model was used to predict the oxygen concentration over the whole system over time at 37 °C and 5% CO2, and (D) model the fluid velocity to verify whether the culture wells experienced shear stress.”
Citations
Cites
Generation of three-dimensional retinal tissue with functional photoreceptors from human iPSCs
Zhong, X., Gutierrez, C., Xue, T., Hampton, C., Vergara, M. N., Cao, L.-H., Peters, A., Park, T. S., Zambidis, E. T., Meyer, J. S., et al. (2014) · Nature Communications · doi:10.1038/ncomms5047 · Cited by 970
Yu, D.-Y., & Cringle, S. J. (2001) · Progress in Retinal and Eye Research · doi:10.1016/s1350-9462(00)00027-6 · Cited by 653
Retinal Oxygen: Fundamental and Clinical Aspects
Wangsa-Wirawan, N. D. (2003) · Archives of Ophthalmology · doi:10.1001/archopht.121.4.547 · Cited by 546
Achberger, K., Probst, C., Haderspeck, J., Bolz, S., Rogal, J., Chuchuy, J., Nikolova, M., Cora, V., Antkowiak, L., Haq, W., et al. (2019) · eLife · doi:10.7554/elife.46188 · Cited by 380
Capowski, E. E., Samimi, K., Mayerl, S. J., Phillips, M. J., Pinilla, I., Howden, S. E., Saha, J., Jansen, A. D., Edwards, K. L., Jager, L. D., et al. (2018) · Development · doi:10.1242/dev.171686 · Cited by 311
How Variable Clones Build an Invariant Retina
He, J., Zhang, G., Almeida, A. D., Cayouette, M., Simons, B. D., & Harris, W. A. (2012) · Neuron · doi:10.1016/j.neuron.2012.06.033 · Cited by 235
RNA Binding Protein with Multiple Splicing: A New Marker for Retinal Ganglion Cells
Kwong, J. M. K., Caprioli, J., & Piri, N. (2010) · Investigative Opthalmology & Visual Science · doi:10.1167/iovs.09-4098 · Cited by 191
Gomes, F. L. A. F., Zhang, G., Carbonell, F., Correa, J. A., Harris, W. A., Simons, B. D., & Cayouette, M. (2011) · Development · doi:10.1242/dev.059683 · Cited by 168
Retinal organoids: a window into human retinal development
O'Hara-Wright, M., & Gonzalez-Cordero, A. (2020) · Development · doi:10.1242/dev.189746 · Cited by 163
Pluripotent stem cell-derived retinal organoids for disease modeling and development of therapies
Kruczek, K., & Swaroop, A. (2020) · Stem Cells · doi:10.1002/stem.3239 · Cited by 148
Research works printed but not linked: 2
- Cheng, 2017, Front. Cell. Neurosci., 11, 20
- Capowski, 2019, Development, 146, dev171686
Cited by
Papamichail, L., Koch, L. S., Veerman, D., Broersen, K., & van der Meer, A. D. (2025) · Frontiers in Bioengineering and Biotechnology · doi:10.3389/fbioe.2025.1515340 · Cited by 120
Organoids meet microfluidics: recent advancements, challenges, and future of organoids-on-chip
Chauhdari, T., Zaidi, S. A., Su, J., & Ding, Y. (2025) · In vitro models · doi:10.1007/s44164-025-00086-7 · Cited by 45
“This sys-tem improved retinal cell differentiation and maturation, offering a robust platform for disease modeling and drug testing, particularly for conditions like retinoblastoma [111].”
Alnasser, S. M. (2025) · Stem Cell Research & Therapy · doi:10.1186/s13287-025-04264-y · Cited by 33
“Another limitation in organoid culture systems is the discrepancy between physiological oxygen levels and those maintained in standard laboratory conditions [140, 141].”
Retinal Organoids: Innovative Tools for Understanding Retinal Degeneration
Galindo‐Cabello, N., Caballano‐Infantes, E., Benites, G., Pastor‐Idoate, S., Diaz-Corrales, F. J. J., & Usategui‐Martín, R. (2025) · International Journal of Molecular Sciences · doi:10.3390/ijms26073263 · Cited by 19
“…in organoid-based models can provide valuable insights into potential biomarkers and facilitate drug screening (Figure 3), as these models closely mimic the physiological conditions of the human retina (42,43). can activate HIFs, which may in fl uence gene expression and cellular metabolism.”
Nasiri, R., Madadelahi, M., Nikmaneshi, M. R., Gökçe, B., Bijarchi, M. A., Shah, S., Tirpáková, Z., Gastel, D. V., Taebnia, N., de Barros, N. R., et al. (2025) · Biomaterials · doi:10.1016/j.biomaterials.2025.123739 · Cited by 19
Metadata
- Authors
- Drabbe, E., Pelaez, D., & Agarwal, A.
- Affiliations
- University of Miami (US)
- Corresponding author
- Pelaez, Daniel
- Agarwal, Ashutosh
- Venue
- Lab on a Chip
- Publisher
- Royal Society of Chemistry (RSC)
- Published
- 2025
- Volume
- 25
- Issue
- 7
- Pages
- 1626-1636
- ISSN
- 1473-0189 (ISSN-L)
- 1473-0197
- PMC
- PMC11632457
- OpenAlex
- W4404908612
- Cited by
- 26
- References
- 33
- Citations by year
- 2026: 15 · 2025: 11
- FWCI
- 2.49
- Type
- journal article
- Language
- en
- Open access
- hybrid
- doi.org
- Licence
- Locations
- Lab on a Chip (publishedVersion, cc-by-nc)
- PubMed Central (publishedVersion, cc-by-nc)
- PubMed (publishedVersion)
- Funders
- Research to Prevent Blindness (GR004596-1)
- Division of Cancer Prevention, National Cancer Institute (R01CA248890)
- National Eye Institute (P30EY014801)
- Topics
- Physical Sciences › Engineering › Biomedical Engineering › 3D Printing in Biomedical Research
- Health Sciences › Medicine › Ophthalmology › Retinal Development and Disorders
- Life Sciences › Neuroscience › Cellular and Molecular Neuroscience › Neuroscience and Neural Engineering
- Keywords
- retinal organoids, oxygen gradients, induced pluripotent stem cells, retinal development, perfusion, retinoblastoma, microfluidic fabrication
- MeSH terms
- Humans, Organoids, Oxygen, Retina, Cell Culture Techniques, Tissue Engineering, Lab-On-A-Chip Devices
About these checks
Registry, retraction, Cites and statistics results are computed, not judged, with one exception: a printed reference that no index lists is read once by a model before it counts as a citation error. Claims are extracted by a model and kept only when their quote appears verbatim in the text; each cited source is then checked, with a model’s help, for whether it says what the claim relies on. Those verdicts can be wrong — read the claim’s quote and the cited source before relying on one.
The claim verdicts this report counts are experimental: their accuracy is not yet measured.
A language model drew the claims from the paper on 2026-10-07, under version 3 of the claim definition (model deepseek-v4.1-flash, prompt extract-v3).
A second model labelled each claim on 2026-10-07 (model jev-1.13-20260917, definition revision gold-guideline-v0.2).
Cited sources are checked with a language model’s help (gpt-6-sol).
Statistics and arithmetic are recomputed, not judged.
Confidence bands are shown only for fields calibrated on our annotated test set. None is calibrated yet, so no band is shown.
What counts as a claim ›How we measure confidence ›How we check this ›
Are you an author, or do you see a problem with this page? Request a review
How to cite
Cite CoChat for the checks on this page, and the paper for its own findings.
- This page
- CoChat. (2026). Citation check: Retinal organoid chip: engineering a physiomimetic oxygen gradient for optimizing long term culture of human retinal organoids. https://app.cochat.ai/papers/10.1039/d4lc00771a
- The paper
- Drabbe, E., Pelaez, D., & Agarwal, A. (2025). Retinal organoid chip: engineering a physiomimetic oxygen gradient for optimizing long term culture of human retinal organoids. Lab on a Chip. https://doi.org/10.1039/d4lc00771a
Data sources
Bibliographic data: Semantic Scholar, OpenAlex, Crossref.
Contains information from the Semantic Scholar Academic Graph Datasets, made available under the ODC Attribution License (ODC-BY 1.0).
Semantic Scholar’s data is described in: Kinney, R., et al. (2023). The Semantic Scholar Open Data Platform. arXiv:2301.10140.
