

Random regression models for multi-environment, multi-time data from crop breeding selection trials
Open accessThe DOI matches its Crossref record; 38 of the 38 references it cites were found in a registry or an index.
Abstract
Context: In order to identify best crop genotypes for recommendation to breeders, and ultimately for use in breeding, evaluation is usually conducted in field trials across a range of environments, known as multi-environment trials. Increasingly, many breeding traits are measured over time, for example with high-throughput phenotyping at different growth stages in annual crops or repeated harvests in perennial crops. Aims: This study aims to provide an efficient, accurate approach for modelling genotype response over time and across environments, accounting for non-genetic sources of variation such as spatial and temporal correlation. Methods: Because the aim is genotype selection, genetic effects are fitted as random effects, and so the approach is based on random regression, in which linear or non-linear models are used to model genotype responses. A method for fitting random regression is outlined in a multi-environment situation, using underlying cubic smoothing splines to model the mean trend over time. This approach is illustrated on six wheat experiments, using data on grain-filling over thermal time. Key results: The method correlates genetic effects over time and environments, providing predicted genotype responses while incorporating spatial and temporal correlation between observations. Conclusions: The approach provides robust genotype predictions by accounting for temporal and spatial effects simultaneously under various situations including those in which trials have different measurement times or where genotypes within trials are not measured at the same times. The approach facilitates investigation into genotype by environment interaction (G × E) both within and across environments. Implications: The models presented have potential to increase accuracy of predictions over measurement times and trials, provide predictions at times other than those observed, and give a greater understanding of G × E interaction, hence improving genotype selection across environments for repeated-measures traits.
Overview
The claims and statistics of this paper haven’t been checked yet.
Free: it reads the open-access text and checks the first 5 claims that cite a source we can check. Create a free account to check every claim.
Integrity signals
Registry
Cites
Statistics
Figures
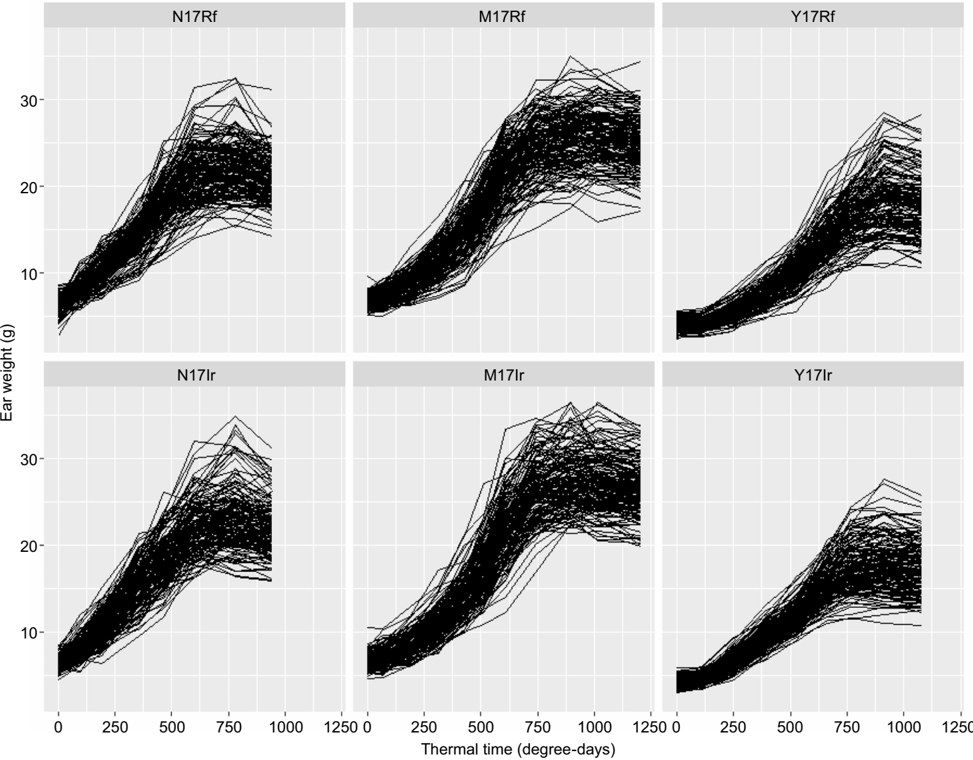
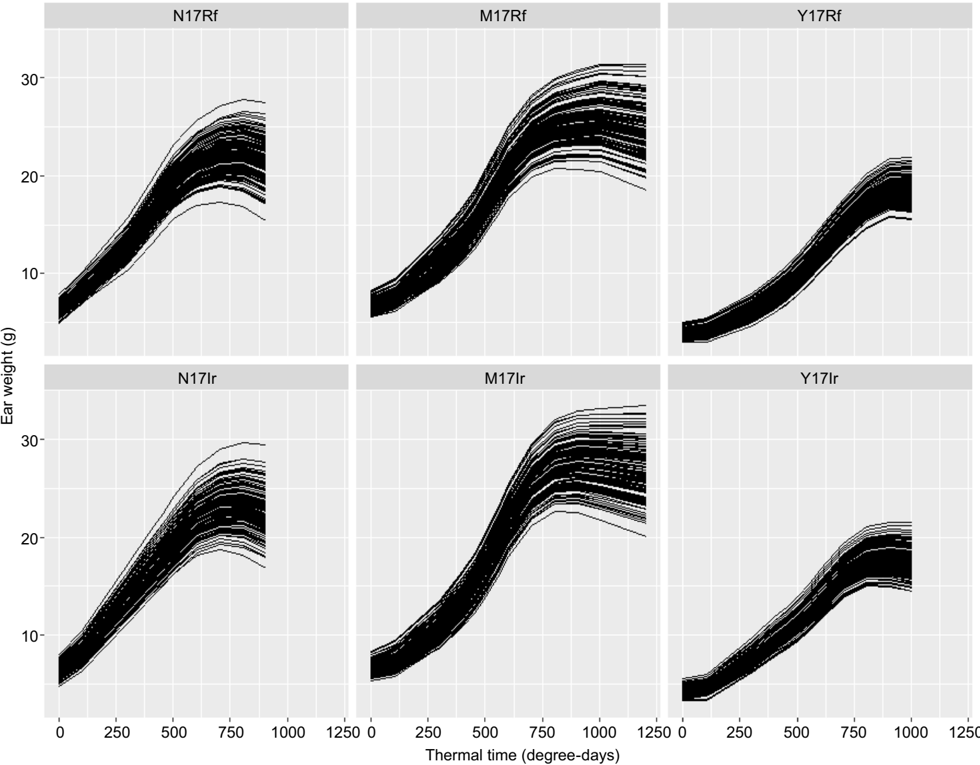
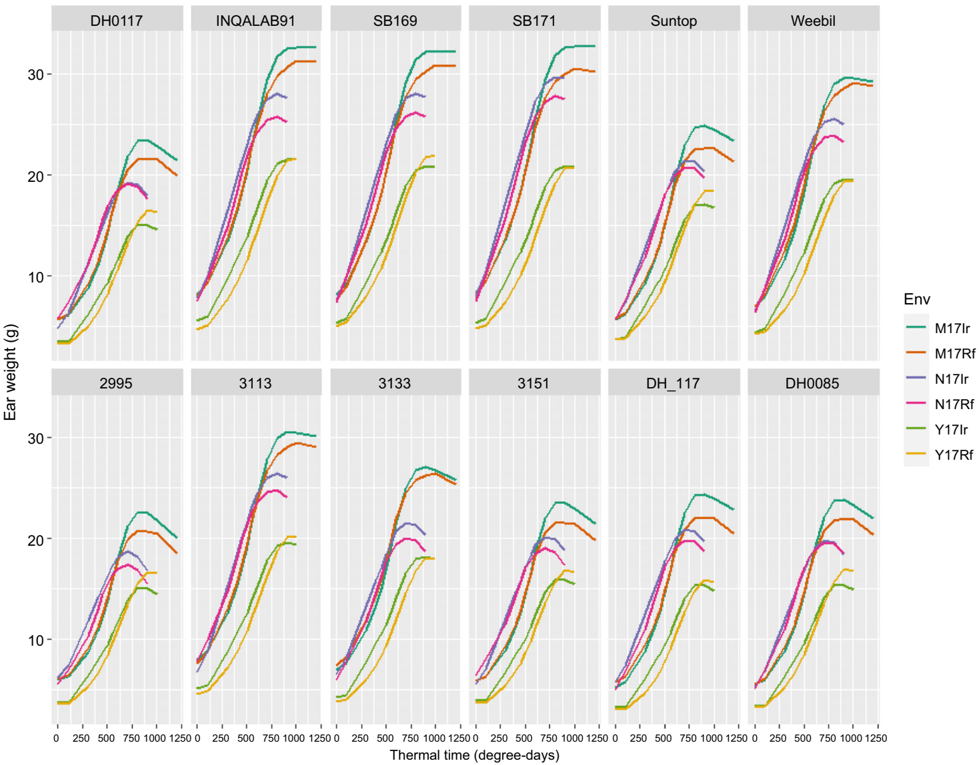
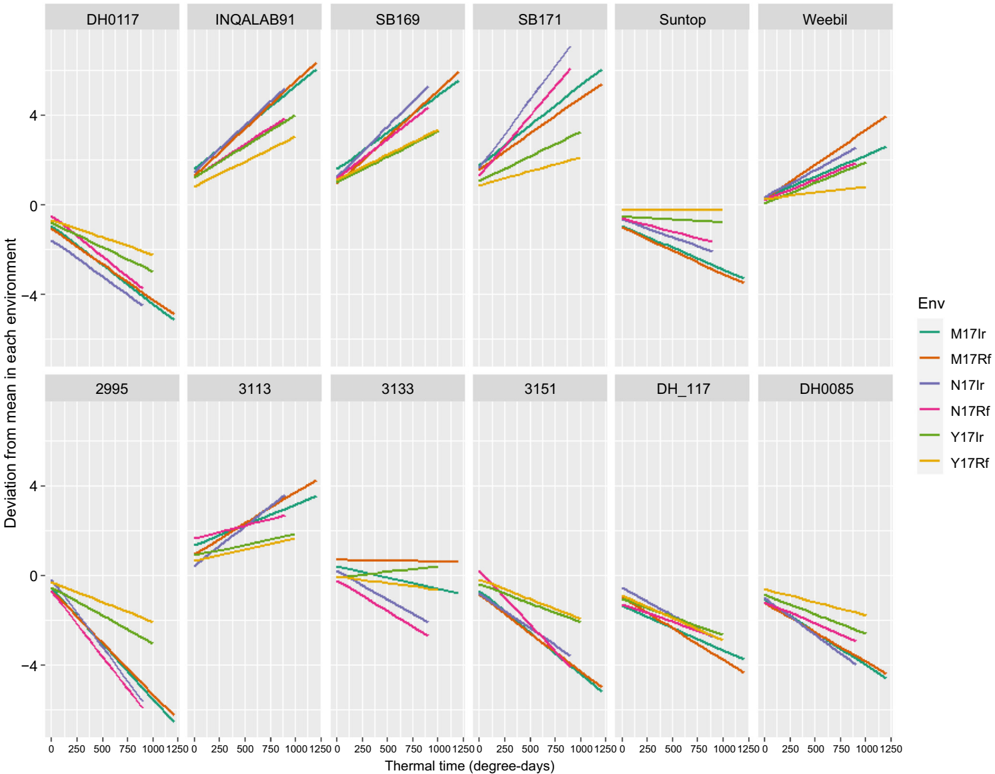
Verification
Claims the paper makes
The claims and statistics of this paper haven’t been checked yet.
Free: it reads the open-access text and checks the first 5 claims that cite a source we can check. Create a free account to check every claim.
Claims other papers make about this one
Each is checked against this paper’s own text: does it say what the citing paper says it does?
The source backs part of the claim, not all of it — or backs it for a different population, condition or comparison.
In the citing paper
“The incorporation of smoothing splines (Verbyla et al., 1999) also enables the EC model terms to be partitioned into linear and non-linear components (De Faveri et al., 2022), allowing for significance testing of these components to be performed independently (Tables 5 and 4 respectively).”
From Incorporating environmental covariates to explore genotype × environment × management (G × E × M) interactions: A one-stage predictive model (2023) · cites this paper as De Faveri et al., 2022
Experimental — accuracy not yet measuredThe source backs part of the claim, not all of it — or backs it for a different population, condition or comparison.
In the citing paper
“Thus, the proposed methodology provides accuracy improvements in the predictions obtained from G × E × M MET data compared to methodologies that incorporate ECs but do not account for complex variance structures (De Faveri et al., 2022).”
From Incorporating environmental covariates to explore genotype × environment × management (G × E × M) interactions: A one-stage predictive model (2023) · cites this paper as De Faveri et al., 2022
Experimental — accuracy not yet measured
Self-check
Percentages, sums and reported differences re-computed from the paper’s own numbers.
The self-check needs the paper’s full text.
Citations
Cites
Random-Effects Models for Longitudinal Data
Laird, N. M., & Ware, J. H. (1982) · Biometrics · doi:10.2307/2529876 · Cited by 8,923
Small sample inference for fixed effects from restricted maximum likelihood
Kenward, M. G., & Roger, J. H. (1997) · Biometrics · doi:10.2307/2533558 · Cited by 4,552
Recovery of inter-block information when block sizes are unequal
PATTERSON, H. D., & THOMPSON, R. (1971) · Biometrika · doi:10.1093/biomet/58.3.545 · Cited by 4,058
Nonparametric Regression and Generalized Linear Models
Green, P. J., & Silverman, B. W. (1994) · Springer eBooks · doi:10.1007/978-1-4899-4473-3 · Cited by 1,925
On the design of early generation variety trials with correlated data
Cullis, B. R., Smith, A. B., & Coombes, N. E. (2006) · Journal of Agricultural, Biological, and Environmental Statistics · doi:10.1198/108571106x154443 · Cited by 926
Accounting for natural and extraneous variation in the analysis of field experiments
Gilmour, A. R., Cullis, B. R., Verbyla, A. P., & Verbyla, A. P. (1997) · Journal of Agricultural, Biological, and Environmental Statistics · doi:10.2307/1400446 · Cited by 752
Self-citationSMITH, A. B., CULLIS, B. R., & THOMPSON, R. (2005) · The Journal of Agricultural Science · doi:10.1017/s0021859605005587 · Cited by 623
The analysis of designed experiments and longitudinal data by using smoothing splines
Verbyla, A. P., Cullis, B. R., Kenward, M. G., & Welham, S. J. (1999) · Journal of the Royal Statistical Society Series C: Applied Statistics · doi:10.1111/1467-9876.00154 · Cited by 570 · cited 6×
“The curvature or nonlinearity for each environment is included as an additional random effect with a variance parameter that relates to the underlying smoothing parameter of the NCSS.”
BackgroundMethodInfluentialSelf-citationSmith, A., Cullis, B., & Thompson, R. (2001) · Biometrics · doi:10.1111/j.0006-341x.2001.01138.x · Cited by 566
Application of random regression models in animal breeding
Schaeffer, L. R. (2004) · Livestock Production Science · doi:10.1016/s0301-6226(03)00151-9 · Cited by 533
An Approach to the Analysis of Repeated Measurements
Diggle, P. J. (1988) · Biometrics · doi:10.2307/2531727 · Cited by 490
Estimating covariance functions for longitudinal data using a random regression model
Meyer, K. (1998) · Genetics Selection Evolution · doi:10.1186/1297-9686-30-3-221 · Cited by 244
Joint modeling of additive and non-additive genetic line effects in single field trials
Oakey, H., Verbyla, A., Pitchford, W., Cullis, B., & Kuchel, H. (2006) · Theoretical and Applied Genetics · doi:10.1007/s00122-006-0333-z · Cited by 217
Self-citationRandom regression analyses using B-splines to model growth of Australian Angus cattle
Meyer, K. (2005) · Genetics Selection Evolution · doi:10.1051/gse:2005012 · Cited by 204
Kelly, A. M., Smith, A. B., Eccleston, J. A., & Cullis, B. R. (2007) · Crop Science · doi:10.2135/cropsci2006.08.0540 · Cited by 185 · cited 1×
“Kelly et al. (2007) demonstrated the superiority of using linear mixed models with factor analytic (Smith et al. 2001) modelling of variety by trial effects, together with the spatial modelling approach of Gilmour et al. (1997), for selection of superior varieties in the MET situation.”
MethodSmith, A. B., Ganesalingam, A., Kuchel, H., & Cullis, B. R. (2015) · Theoretical and Applied Genetics · doi:10.1007/s00122-014-2412-x · Cited by 172
Genetic and Environmental Smoothing of Lactation Curves with Cubic Splines
White, I. M. S., Thompson, R., & Brotherstone, S. (1999) · Journal of Dairy Science · doi:10.3168/jds.s0022-0302(99)75277-x · Cited by 170
Methodology for High-Throughput Field Phenotyping of Canopy Temperature Using Airborne Thermography
Deery, D. M., Rebetzke, G. J., Jiménez-Berni, J. A., James, R. A., Condon, A. G., Bovill, W. D., Hutchinson, P., Scarrow, J., Davy, R. J., & Furbank, R. T. (2016) · Frontiers in Plant Science · doi:10.3389/fpls.2016.01808 · Cited by 164
Self-citationAnte-dependence Analysis of an Ordered Set of Variables
Gabriel, K. R. (1962) · The Annals of Mathematical Statistics · doi:10.1214/aoms/1177704724 · Cited by 141
A multisite managed environment facility for targeted trait and germplasm phenotyping
Rebetzke, G. J., Chenu, K., Biddulph, B., Moeller, C., Deery, D. M., Rattey, A. R., Bennett, D., Barrett-Lennard, E. G., & Mayer, J. E. (2012) · Functional Plant Biology · doi:10.1071/fp12180 · Cited by 123
Self-citationGenetic parameters for various random regression models to describe the weight data of pigs
Huisman, A., Veerkamp, R. F., & van Arendonk, J. A. M. (2002) · Journal of Animal Science · doi:10.2527/2002.803575x · Cited by 110
High-throughput phenotyping technologies allow accurate selection of stay-green
Rebetzke, G. J., Jiménez-Berni, J. A., Bovill, W. D., Deery, D. M., & James, R. A. (2016) · Journal of Experimental Botany · doi:10.1093/jxb/erw301 · Cited by 94
Self-citationEnhanced diagnostics for the spatial analysis of field trials
Stefanova, K. T., Smith, A. B., & Cullis, B. R. (2009) · Journal of Agricultural, Biological, and Environmental Statistics · doi:10.1198/jabes.2009.07098 · Cited by 88
Smith, A. B., Stringer, J. K., Wei, X., & Cullis, B. R. (2007) · Euphytica · doi:10.1007/s10681-007-9418-2 · Cited by 87
A note on model selection using information criteria for general linear models estimated using REML
Verbyla, A. P. (2019) · Australian & New Zealand Journal of Statistics · doi:10.1111/anzs.12254 · Cited by 76
Self-citationCampbell, M. T., Walia, H., & Morota, G. (2018) · Plant Direct · doi:10.1002/pld3.80 · Cited by 62
Faveri, J. D., Verbyla, A. P., Pitchford, W. S., Venkatanagappa, S., & Cullis, B. R. (2015) · Australian Journal of Agricultural Research · doi:10.1071/cp14312 · Cited by 56
Self-citationAnalysis of Longitudinal Data from Progeny Tests: Some Multivariate Approaches
Apiolaza, L. A., & Garrick, D. J. (2001) · Forest Science · doi:10.1093/forestscience/47.2.129 · Cited by 42
Variance modelling of longitudinal height data from a Pinus radiata progeny test
Apiolaza, L. A., Gilmour, A. R., & Garrick, D. J. (2000) · Canadian Journal of Forest Research · doi:10.1139/cjfr-30-4-645 · Cited by 40
Advances in methodology for random regression analyses
Meyer, K. (2005) · Australian Journal of Experimental Agriculture · doi:10.1071/ea05040 · Cited by 38
Faveri, J. D., Verbyla, A. P., Cullis, B. R., Pitchford, W. S., & Thompson, R. (2016) · Journal of Agricultural Biological and Environmental Statistics · doi:10.1007/s13253-016-0267-0 · Cited by 34
Self-citationForknall, C. R., Simpfendorfer, S., & Kelly, A. M. (2018) · Phytopathology · doi:10.1094/phyto-09-18-0354-r · Cited by 30
Evans, J. C., & Roberts, E. A. (1979) · Biometrics · doi:10.2307/2530262 · Cited by 29
Verbyla, A. P., Faveri, J. D., Deery, D. M., & Rebetzke, G. J. (2021) · Australian & New Zealand Journal of Statistics · doi:10.1111/anzs.12336 · Cited by 18
Self-citationPopulation extremes for assessing trait value and correlated response of genetically complex traits
Rebetzke, G. J., Richards, R. A., & Holland, J. B. (2016) · Field Crops Research · doi:10.1016/j.fcr.2016.10.019 · Cited by 17
Self-citationSmoothing spline models for longitudinal data
Welham, S. J. (2008) · Chapman & Hall/CRC interdisciplinary statistics series/Interdisciplinary statistics · doi:10.1201/9781420011579.ch11 · Cited by 16
Genetic analysis of longitudinal height data using random regression
Wang, C., Andersson, B., & Waldmann, P. (2009) · Canadian Journal of Forest Research · doi:10.1139/x09-111 · Cited by 9
DeGroot, B. J., Keown, J. F., Kachman, S. D., & Vleck, D. V. (2003) · Conference on Applied Statistics in Agriculture · doi:10.4148/2475-7772.1181 · Cited by 6
Research works printed but not linked: 2
- De Faveri J (2013) Spatial and temporal modelling of perennial crop variety selection trials. PhD Thesis, The University of Adelaide, SA, Australia. Available at http://digital.library.adelaide.edu.au/dspace/handle/2440/83114
- Robinson, 1991, That BLUP is a good thing: the estimation of random e?ects., Statistical Science, 6, 15
Cited by
Genomic selection strategies to increase genetic gain in tea breeding programs
Lubanga, N., Gorjanc, G., Massawe, F. J., Mayes, S., & Bančič, J. (2022) · The Plant Genome · doi:10.1002/tpg2.20282 · Cited by 31
Mumford, M. H., Forknall, C. R., Rodriguez, D., Eyre, J. X., & Kelly, A. M. (2023) · Field Crops Research · doi:10.1016/j.fcr.2023.109133 · Cited by 22
Roth, L., Marzougui, A., & Walter, A. (2025) · Journal of Plant Physiology · doi:10.1016/j.jplph.2025.154542 · Cited by 23
Chaves, S. F. D. S., Alves, R. S., Dias, L. A. D. S., Alves, R. M., Dias, K. O. D. G., & Evangelista, J. S. P. C. (2023) · Crop Science · doi:10.1002/csc2.20995 · Cited by 14
Papin, V., Bosc, A., Sánchez, L., & Bouffier, L. (2024) · Heredity · doi:10.1038/s41437-024-00702-4 · Cited by 8
Metadata
- Authors
- De Faveri, J., Verbyla, A. P., & Rebetzke, G.
- Affiliations
- ACSIRO Data61, Atherton, Qld 4883, Australia.
- Commonwealth Scientific and Industrial Research Organisation (AU)
- Venue
- Crop & Pasture Science
- Publisher
- CSIRO Publishing
- Published
- 2022-08-31
- Volume
- 74
- Issue
- 4
- Pages
- 271-283
- ISSN
- 0004-9409 (ISSN-L)
- 1836-0947
- 1836-5795
- OpenAlex
- W4293766342
- Cited by
- 12
- References
- 38
- Citations by year
- 2026: 2 · 2025: 3 · 2024: 1 · 2023: 5 · 2022: 1
- FWCI
- 1.38
- Type
- journal article
- Language
- en
- Open access
- hybrid
- doi.org
- Licence
- Locations
- Australian Journal of Agricultural Research (publishedVersion, cc-by-nc-nd)
- Topics
- Life Sciences › Agricultural and Biological Sciences › Plant Science › Genetics and Plant Breeding
- Life Sciences › Biochemistry, Genetics and Molecular Biology › Genetics › Genetic and phenotypic traits in livestock
- Life Sciences › Agricultural and Biological Sciences › Agronomy and Crop Science › Agriculture, Soil, Plant Science
- Keywords
- random regression models, multi-environment trials, crop breeding, gene-environment interaction, spatio-temporal correlation, cubic spline smoothing, wheat, grain filling, thermal time, genotype selection, high-throughput phenotyping
About these checks
Registry, retraction, Cites and statistics results are computed, not judged, with one exception: a printed reference that no index lists is read once by a model before it counts as a citation error. Claims are extracted by a model and kept only when their quote appears verbatim in the text; each cited source is then checked, with a model’s help, for whether it says what the claim relies on. Those verdicts can be wrong — read the claim’s quote and the cited source before relying on one.
Statistics and arithmetic are recomputed, not judged.
Confidence bands are shown only for fields calibrated on our annotated test set. None is calibrated yet, so no band is shown.
What counts as a claim ›How we measure confidence ›How we check this ›
Are you an author, or do you see a problem with this page? Request a review
Data sources
Bibliographic data: Semantic Scholar, OpenAlex, Crossref.
Contains information from the Semantic Scholar Academic Graph Datasets, made available under the ODC Attribution License (ODC-BY 1.0).
Semantic Scholar’s data is described in: Kinney, R., et al. (2023). The Semantic Scholar Open Data Platform. arXiv:2301.10140.
