

The DOI matches its Crossref record; 71 of the 71 references it cites were found in a registry or an index.
LncRNA IDH1-AS1 links the functions of c-Myc and HIF1α via IDH1 to regulate the Warburg effect
Open accessAbstract
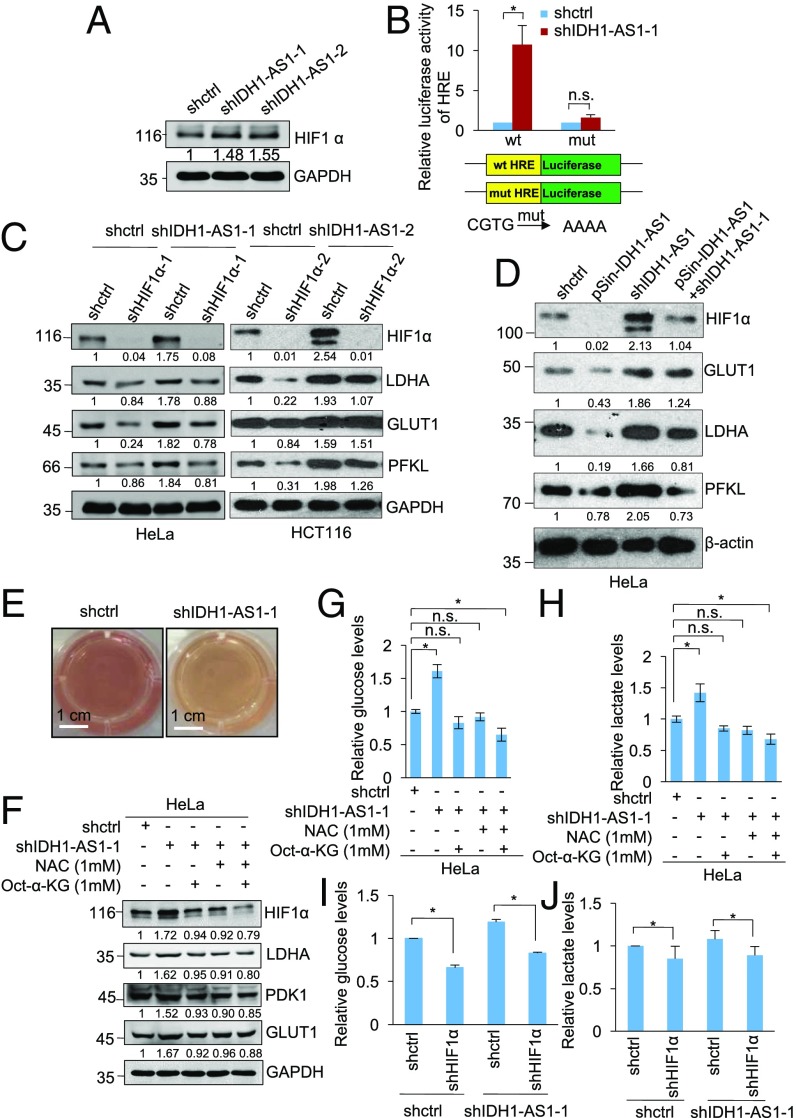
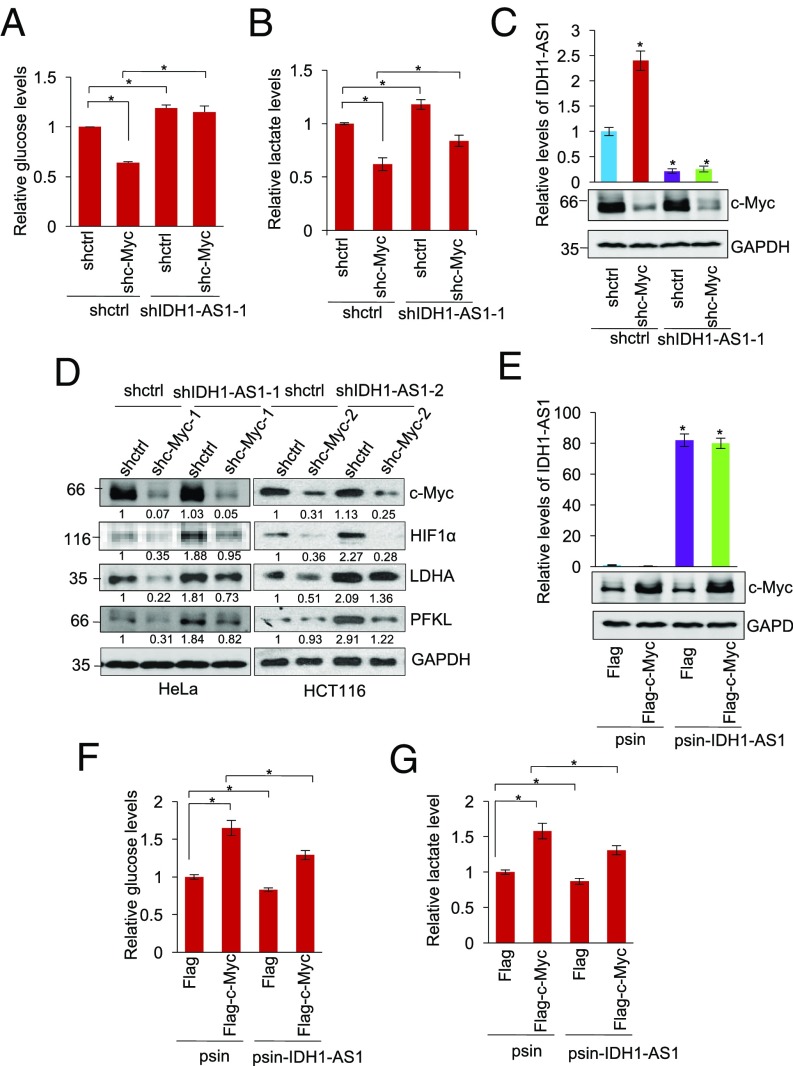
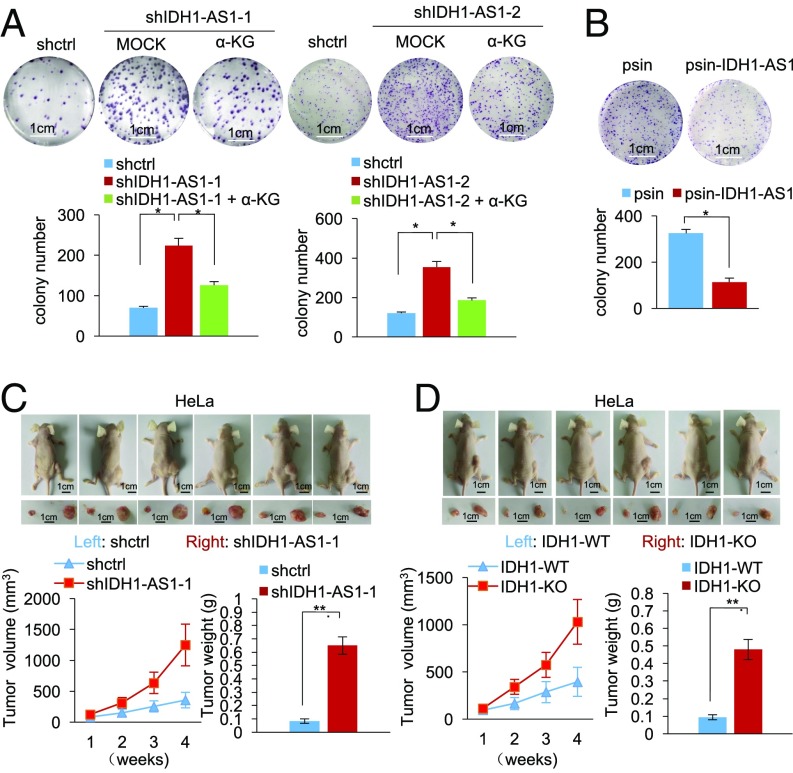
The oncoprotein c-Myc plays an important role in regulating glycolysis under normoxia; yet, in cancer cells, HIF1α, which is essential for driving glycolysis under hypoxia, is often up-regulated even in the presence of oxygen. The relationship between these two major regulators of the Warburg effect remains to be fully defined. Here we demonstrate that regulation of a long noncoding RNA (lncRNA), named IDH1-AS1, enables c-Myc to collaborate with HIF1α in activating the Warburg effect under normoxia. c-Myc transcriptionally repressed IDH1-AS1, which, upon expression, promoted homodimerization of IDH1 and thus enhanced its enzymatic activity. This resulted in increased α-KG and decreased ROS production and subsequent HIF1α down-regulation, leading to attenuation of glycolysis. Hence, c-Myc repression of IDH1-AS1 promotes activation of the Warburg effect by HIF1α. As such, IDH1-AS1 overexpression inhibited cell proliferation, whereas silencing of IDH1-AS1 promoted cell proliferation and cancer xenograft growth. Restoring IDH1-AS1 expression may therefore represent a potential metabolic approach for cancer treatment.
Overview
The claims and statistics of this paper haven’t been checked yet.
Run the check — free, no account needed. It reads the open-access text and checks the sources it cites.
Integrity signals
Registry
Cites
Statistics
Figures
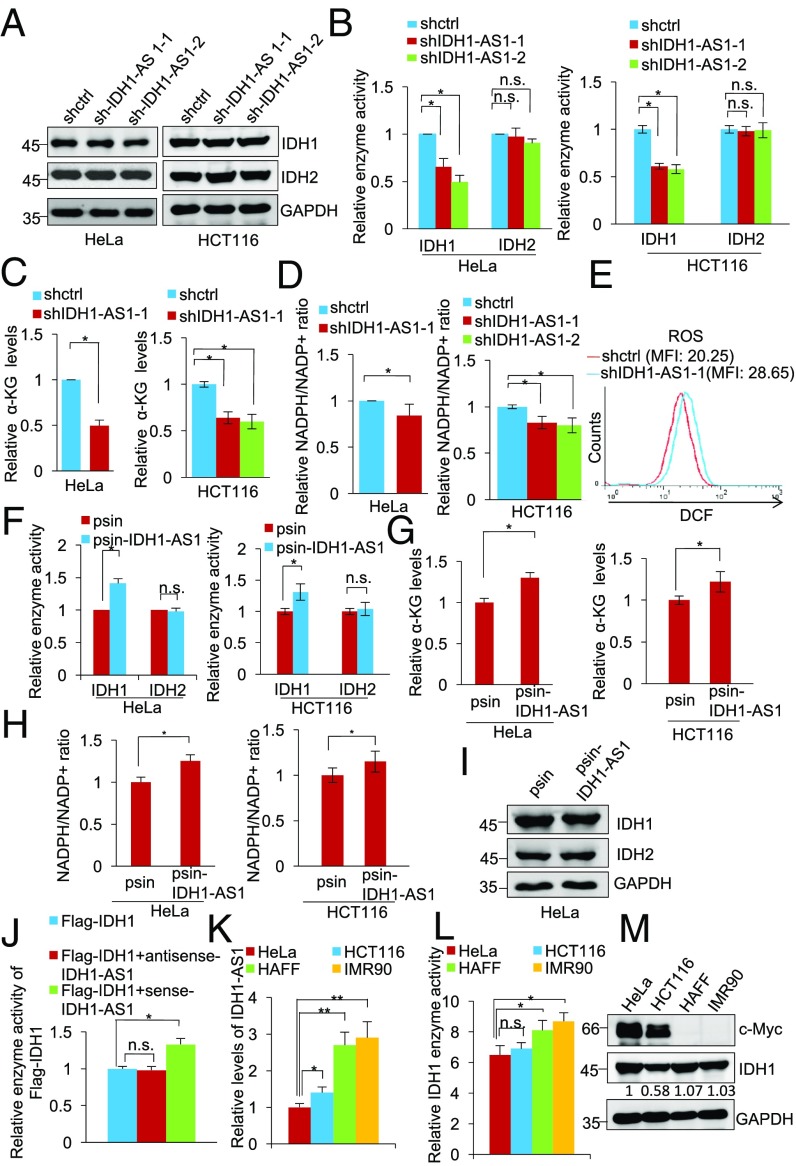
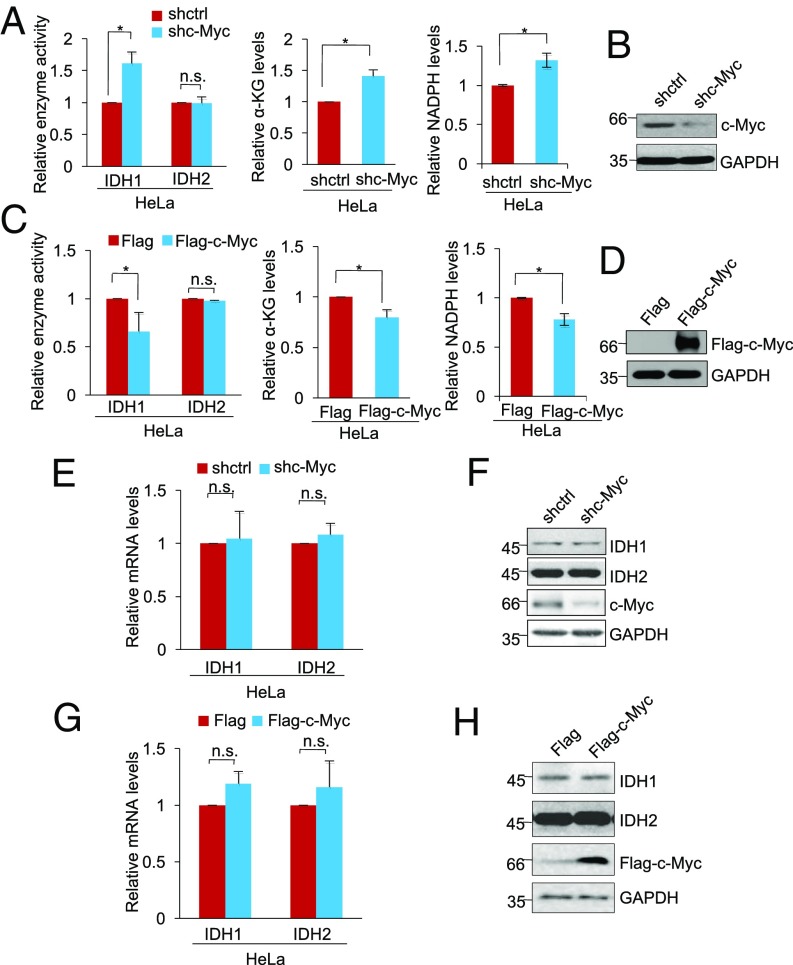
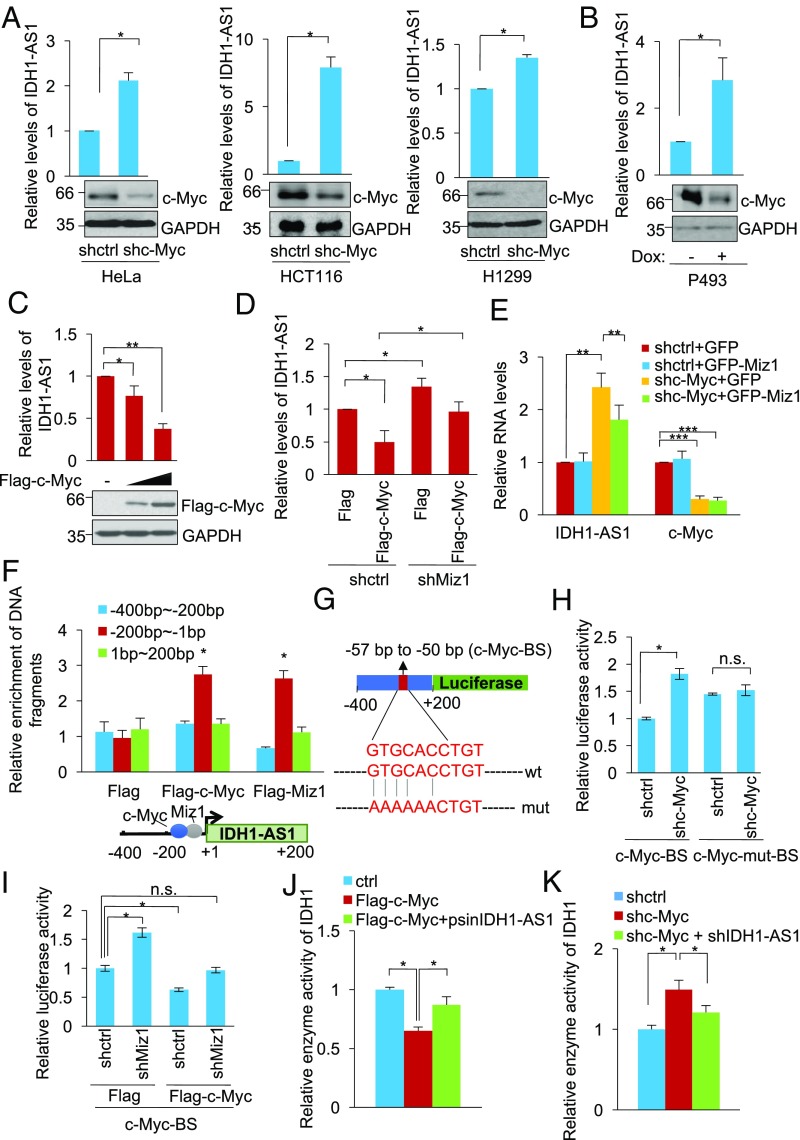
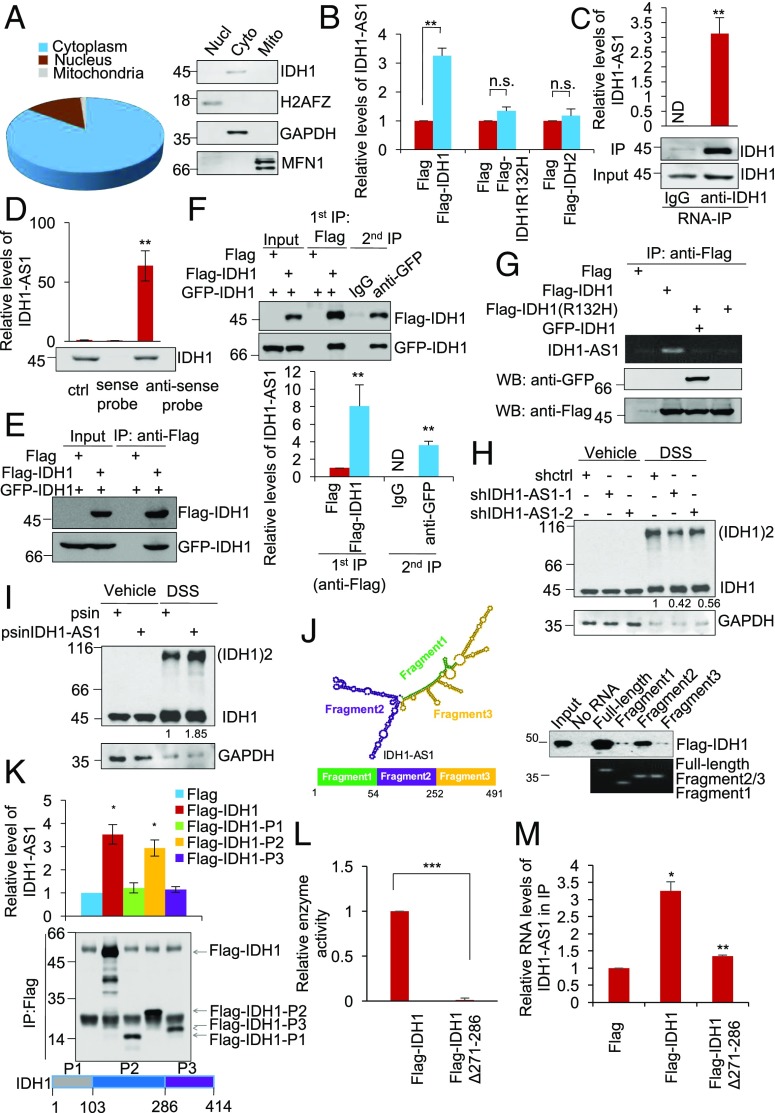
Verification
Claims the paper makes
The claims and statistics of this paper haven’t been checked yet.
Run the check — free, no account needed. It reads the open-access text and checks the sources it cites.
Claims other papers make about this one
Each is checked against this paper’s own text: does it say what the citing paper says it does?
The source backs part of the claim, not all of it — or backs it for a different population, condition or comparison.
In the citing paper
“The above studies suggest the involvement of Myc in the production of 2-HG.”
From HIF-1-Independent Mechanisms Regulating Metabolic Adaptation in Hypoxic Cancer Cells (2021) · cites this paper as [175]
Experimental — accuracy not yet measured
Self-check
Percentages, sums and reported differences re-computed from the paper’s own numbers.
The self-check needs the paper’s full text.
Citations
Cites
Hallmarks of Cancer: The Next Generation
Hanahan, D., & Weinberg, R. A. (2011) · Cell · doi:10.1016/j.cell.2011.02.013 · Cited by 66,590
Warburg, O. (1956) · Science · doi:10.1126/science.123.3191.309 · Cited by 13,425
Wang, G. L., Jiang, B. H., Rue, E. A., & Semenza, G. L. (1995) · Proceedings of the National Academy of Sciences · doi:10.1073/pnas.92.12.5510 · Cited by 6,212
IDH1 and IDH2 Mutations in Gliomas
Yan, H., Parsons, D. W., Jin, G., McLendon, R., Rasheed, B. A., Yuan, W., Kos, I., Batinic-Haberle, I., Jones, S., Riggins, G. J., et al. (2009) · New England Journal of Medicine · doi:10.1056/nejmoa0808710 · Cited by 5,847
Long non-coding RNAs: insights into functions
Mercer, T. R., Dinger, M. E., & Mattick, J. S. (2009) · Nature Reviews Genetics · doi:10.1038/nrg2521 · Cited by 5,654
Jaakkola, P., Mole, D. R., Tian, Y.-M., Wilson, M. I., Gielbert, J., Gaskell, S. J., Kriegsheim, A. V., Hebestreit, H. F., Mukherji, M., Schofield, C. J., et al. (2001) · Science · doi:10.1126/science.1059796 · Cited by 5,535
Targeting cancer cells by ROS-mediated mechanisms: a radical therapeutic approach?
Trachootham, D., Alexandre, J., & Huang, P. (2009) · Nature Reviews Drug Discovery · doi:10.1038/nrd2803 · Cited by 5,452
Hypoxia — a key regulatory factor in tumour growth
Harris, A. L. (2002) · Nature Reviews Cancer · doi:10.1038/nrc704 · Cited by 5,177
Regulation of cancer cell metabolism
Cairns, R. A., Harris, I. S., & Mak, T. W. (2011) · Nature Reviews Cancer · doi:10.1038/nrc2981 · Cited by 4,744
Cancer-associated IDH1 mutations produce 2-hydroxyglutarate
Dang, L., White, D. W., Gross, S., Bennett, B. D., Bittinger, M. A., Driggers, E. M., Fantin, V. R., Jang, H. G., Jin, S., Keenan, M. C., et al. (2009) · Nature · doi:10.1038/nature08617 · Cited by 4,154
Cited by
Sorted by citations
NADPH homeostasis in cancer: functions, mechanisms and therapeutic implications
Ju, H., Lin, J., Tian, T., Xie, D., & Xu, R. (2020) · Signal Transduction and Targeted Therapy · doi:10.1038/s41392-020-00326-0 · Cited by 607
Liao, M., Yao, D., Wu, L., Luo, C., Wang, Z., Zhang, J., & Liu, B. (2023) · Acta Pharmaceutica Sinica B · doi:10.1016/j.apsb.2023.12.003 · Cited by 299
Tricarboxylic Acid (TCA) Cycle Intermediates: Regulators of Immune Responses
Choi, I., Son, H., & Baek, J.-H. (2021) · Life · doi:10.3390/life11010069 · Cited by 262
CircECE1 activates energy metabolism in osteosarcoma by stabilizing c-Myc
Shen, S., Teng, Y., Xu, Y., Zhang, D., Fan, S., & Ma, J. (2020) · Molecular Cancer · doi:10.1186/s12943-020-01269-4 · Cited by 207
LncRNAs regulate metabolism in cancer
Lin, W., Zhou, Q., Wang, C., Zhu, L., Bi, C., Zhang, S., Wang, X., & Jin, H. (2020) · International Journal of Biological Sciences · doi:10.7150/ijbs.40769 · Cited by 208
HIF-1-Independent Mechanisms Regulating Metabolic Adaptation in Hypoxic Cancer Cells
Lee, S.-H., Golinska, M., & Griffiths, J. R. (2021) · Cells · doi:10.3390/cells10092371 · Cited by 169
Li, J., Cheng, D., Zhu, M., Yu, H., Pan, Z., Liu, L., Qin, G., Pan, H., Yan, M., & Yao, M. (2018) · Theranostics · doi:10.7150/thno.29545 · Cited by 151
STAT3 as a mediator of oncogenic cellular metabolism: Pathogenic and therapeutic implications
Tošić, I., & Frank, D. A. (2021) · Neoplasia · doi:10.1016/j.neo.2021.10.003 · Cited by 131
c-Myc inactivation of p53 through the pan-cancer lncRNA MILIP drives cancer pathogenesis
Feng, Y., Liu, X., Liu, T., Ji, Q., Wu, Y., Li, J., Gao, W., Zhang, Y. Y., La, T., Tabatabaee, H., et al. (2020) · Nature Communications · doi:10.1038/s41467-020-18735-8 · Cited by 119
Self-citationTarget c-Myc to treat pancreatic cancer
Ala, M. (2022) · Cancer Biology & Therapy · doi:10.1080/15384047.2021.2017223 · Cited by 119
Regulation of Gene Expression under Hypoxic Conditions
Nakayama, K., & Kataoka, N. (2019) · International Journal of Molecular Sciences · doi:10.3390/ijms20133278 · Cited by 116
Long non-coding RNA in cervical cancer: From biology to therapeutic opportunity
He, J., Huang, B., Zhang, K., Liu, M., & Xu, T. (2020) · Biomedicine & Pharmacotherapy · doi:10.1016/j.biopha.2020.110209 · Cited by 106
Sun, X., He, L., Liu, H., Thorne, R. F., Zeng, T., Liu, L., Zhang, B., He, M., Huang, Y., Li, M., et al. (2023) · Cell Metabolism · doi:10.1016/j.cmet.2023.07.005 · Cited by 105
Self-citationThe long noncoding RNA glycoLINC assembles a lower glycolytic metabolon to promote glycolysis
Zhu, Y., Jin, L., Shi, R., Li, J., Wang, Y., Zhang, L., chao-zhao, L., Narayana, V. K., Souza, D. P. D., Thorne, R. F., et al. (2022) · Molecular Cell · doi:10.1016/j.molcel.2021.11.017 · Cited by 101
Self-citationWang, R., Cao, L., Thorne, R. F., Zhang, X. D., Li, J., Shao, F., Zhang, L., & Wu, M. (2021) · Science Advances · doi:10.1126/sciadv.abe5708 · Cited by 95
Self-citationLi, M., Thorne, R. F., Shi, R., Zhang, X. D., Li, J., Li, J., Zhang, Q., Wu, M., & Liu, L. (2021) · Advanced Science · doi:10.1002/advs.202003732 · Cited by 81
Self-citationSang, B., Zhang, Y. Y., Guo, S., Kong, L. F., Cheng, Q., Liu, G., Thorne, R. F., Zhang, X. D., Jin, L., & Wu, M. (2018) · Proceedings of the National Academy of Sciences · doi:10.1073/pnas.1805950115 · Cited by 79
Self-citationZuo, S., Wu, L., Wang, Y., & Yuan, X. (2020) · Frontiers in Oncology · doi:10.3389/fonc.2020.00274 · Cited by 76
Li, Z., Ge, Y., Dong, J., Wang, H., Zhao, T., Wang, X., Liu, J., Gao, S., Shi, L., Yang, S., et al. (2021) · Gastroenterology · doi:10.1053/j.gastro.2021.12.249 · Cited by 74
Long Non-coding RNAs: Major Regulators of Cell Stress in Cancer
Connerty, P., Lock, R. B., & de Bock, C. E. (2020) · Frontiers in Oncology · doi:10.3389/fonc.2020.00285 · Cited by 66
The crosstalk between reactive oxygen species and noncoding RNAs: from cancer code to drug role
Zuo, J., Zhang, Z., Li, M., Yang, Y., Zheng, B., Wang, P., Huang, C., & Zhou, S. (2022) · Molecular Cancer · doi:10.1186/s12943-021-01488-3 · Cited by 69
Rethinking RNA-binding proteins: Riboregulation challenges prevailing views
Hentze, M. W., Sommerkamp, P., Ravi, V., & Gebauer, F. (2025) · Cell · doi:10.1016/j.cell.2025.06.021 · Cited by 61
Zhu, Y., Liu, Q., Liao, M., Diao, L., Wu, T., Liao, W., Wang, Z., Li, B., Zhang, S., Wang, S., et al. (2019) · Molecular Therapy — Nucleic Acids · doi:10.1016/j.omtn.2019.09.017 · Cited by 60
Zhao, S., Zhang, X., Chen, S., & Zhang, S. (2020) · Journal of Experimental & Clinical Cancer Research · doi:10.1186/s13046-020-01700-0 · Cited by 59
Self-citationhENT1 reverses chemoresistance by regulating glycolysis in pancreatic cancer
Xi, Y., Yuan, P., Li, T., Zhang, M., Liu, M., & Li, B. (2020) · Cancer Letters · doi:10.1016/j.canlet.2020.03.015 · Cited by 53
Signaling in and out: long-noncoding RNAs in tumor hypoxia
Kuo, T.-C., Kung, H.-J., & Shih, J.-W. (2020) · Journal of Biomedical Science · doi:10.1186/s12929-020-00654-x · Cited by 54
Regulation of Cancer Metabolism by Deubiquitinating Enzymes: The Warburg Effect
Kim, S., & Baek, K. (2021) · International Journal of Molecular Sciences · doi:10.3390/ijms22126173 · Cited by 59
Oxidative Stress and Cancer Development: Are Noncoding RNAs the Missing Links?
D’Souza, L. C., Mishra, S., Chakraborty, A., Shekher, A., Sharma, A., & Gupta, S. C. (2019) · Antioxidants and Redox Signaling · doi:10.1089/ars.2019.7987 · Cited by 51
Liu, J., Huang, X., Liu, D., Ji, K., Tao, C., Zhang, R., & Chen, J. (2021) · Phytomedicine · doi:10.1016/j.phymed.2021.153678 · Cited by 49
Decoding the regulatory roles of non-coding RNAs in cellular metabolism and disease
Zong, Y., Wang, X., Cui, B., Xiong, X., Wu, A., Lin, C., & Zhang, Y. (2023) · Molecular Therapy · doi:10.1016/j.ymthe.2023.04.012 · Cited by 50
Xu, L., Yang, T., Zhou, Y., Wu, M., Shen, J., Cheng, J., Liu, Q.-X., Cao, S., Wang, J., & Zhang, L. (2021) · Acta Pharmacologica Sinica · doi:10.1038/s41401-021-00658-9 · Cited by 47
Self-citationIntricate crosstalk between MYC and non‐coding RNA s regulates hallmarks of cancer
Swier, L. J. Y. M., Dzikiewicz‐Krawczyk, A., Winkle, M., van den Berg, A., & Kluiver, J. L. (2018) · Molecular Oncology · doi:10.1002/1878-0261.12409 · Cited by 51
Long-Noncoding RNA (lncRNA) in the Regulation of Hypoxia-Inducible Factor (HIF) in Cancer
Barth, D. A., Prinz, F., Teppan, J., Jonas, K., Klec, C., & Pichler, M. (2020) · Non-Coding RNA · doi:10.3390/ncrna6030027 · Cited by 53
Liu, Y., He, D., Xiao, M., Zhu, Y., Zhou, J., & Cao, K. (2021) · Cell Death and Disease · doi:10.1038/s41419-021-03523-z · Cited by 48
Yao, Z., Zhang, Q., Guo, F., Guo, S., Yang, B., Liu, B., Li, P., Li, J., Guan, S., & Liu, X. (2020) · Cell Transplantation · doi:10.1177/0963689720906777 · Cited by 44
Glutamine Metabolism: Molecular Regulation, Biological Functions, and Diseases
Kumar, M. A., Baba, S. K., Khan, I. R., Khan, M. S., Husain, F. M., Ahmad, S., Haris, M., Singh, M., Akil, A. A., Macha, M. A., et al. (2025) · MedComm · doi:10.1002/mco2.70120 · Cited by 52
Long noncoding RNAs in the metabolic control of inflammation and immune disorders
Xu, J., & Cao, X. (2018) · Cellular and Molecular Immunology · doi:10.1038/s41423-018-0042-y · Cited by 43
Zhang, N., Li, Z., Bai, F., & Zhang, S. (2019) · Cell Death and Disease · doi:10.1038/s41419-019-1932-3 · Cited by 43
N6-methyladenosine modification and metabolic reprogramming of digestive system malignancies
Cai, X., Liang, C., Zhang, M., Xu, Y., Weng, Y., Li, X., & Yu, W. (2022) · Cancer Letters · doi:10.1016/j.canlet.2022.215815 · Cited by 43
Regulatory Mechanisms of LncRNAs in Cancer Glycolysis: Facts and Perspectives
Huang, P., Zhu, S., Liang, X., Zhang, Q., Luo, X., Liu, C., & Song, L. (2021) · Cancer Management and Research · doi:10.2147/cmar.s314502 · Cited by 43
La, T., Chen, S., Guo, T., Zhao, X. H., Liu, T., Li, D., Carnell, M. J., Zhang, Y. Y., Feng, Y., Cole, N., et al. (2021) · Theranostics · doi:10.7150/thno.63763 · Cited by 42
Self-citationContribution of the Wnt Pathway to Defining Biology of Glioblastoma
Tompa, M., Kálovits, F., Nagy, Á., & Kálmán, B. (2018) · NeuroMolecular Medicine · doi:10.1007/s12017-018-8514-x · Cited by 40
Mitochondrial metabolism is inhibited by the HIF 1α‐ MYC ‐ PGC ‐1β axis in BRAF V600E thyroid cancer
Gao, Y., Yang, F., Yang, X., Zhang, L., Yu, H., Cheng, X. F., Xu, S., Pan, J., Wang, K., & Li, P. (2019) · FEBS Journal · doi:10.1111/febs.14786 · Cited by 39
Non-coding RNAs rewire cancer metabolism networks
Lin, X., Wu, Z., Hu, H., Luo, M., & Song, E. (2021) · Seminars in Cancer Biology · doi:10.1016/j.semcancer.2020.12.019 · Cited by 37
Huang, S., Zhan, Z., Li, L., Guo, H., Yao, Y., Miao, F., Deng, J., & Xiong, J. (2019) · OncoTargets and Therapy · doi:10.2147/ott.s208318 · Cited by 36
Tauber, A. L., Schweiker, S. S., & Levonis, S. M. (2019) · Nutrition Research · doi:10.1016/j.nutres.2019.12.004 · Cited by 36
Glucometabolic Reprogramming in the Hepatocellular Carcinoma Microenvironment: Cause and Effect
Tian, H., Zhu, X., Lv, Y., Jiao, Y., & Wang, G. (2020) · Cancer Management and Research · doi:10.2147/cmar.s258196 · Cited by 39
Li, L., Feng, C., Qin, J., Li, D., Liu, M., Han, S., & Zheng, B. Q. (2021) · Cellular Immunology · doi:10.1016/j.cellimm.2021.104409 · Cited by 37
Wu, Y., Wang, Y., Yao, H., Li, H., Meng, F., Li, Q., Lin, X., & Liu, L. (2022) · Journal of Experimental & Clinical Cancer Research · doi:10.1186/s13046-022-02547-3 · Cited by 32
Transcriptional Profiling of Hypoxia-Regulated Non-coding RNAs in Human Primary Endothelial Cells
Moreau, P. R., Örd, T., Downes, N. L., Niskanen, H., Bouvy‐Liivrand, M., Aavik, E., Ylä‐Herttuala, S., & Kaikkonen, M. U. (2018) · Frontiers in Cardiovascular Medicine · doi:10.3389/fcvm.2018.00159 · Cited by 32
Shen, T., Wang, H., Tang, B., Zhu, G., & Wang, X. (2023) · RNA Biology · doi:10.1080/15476286.2023.2216562 · Cited by 29
Li, B., Zhang, G. C., Wang, Z., Yang, Y., Wang, C., Fang, D., Liu, K., Wang, F., & Mei, Y. (2021) · Cell Death and Disease · doi:10.1038/s41419-021-04330-2 · Cited by 29
Liu, R., Wang, X., Shen, Y., & He, A. (2021) · Molecular Biology Reports · doi:10.1007/s11033-021-06247-7 · Cited by 28
Crosstalk Between MYC and lncRNAs in Hematological Malignancies
Arman, K., & Möröy, T. (2020) · Frontiers in Oncology · doi:10.3389/fonc.2020.579940 · Cited by 27
Zhou, L., Zhang, Z., Huang, Z., Nice, E. C., Zou, B., & Huang, C. (2020) · Molecular Biomedicine · doi:10.1186/s43556-020-00004-1 · Cited by 27
Scutellarin activates IDH1 to exert antitumor effects in hepatocellular carcinoma progression
Cui, Z., Li, C., Liu, W., Sun, M., Deng, S., Cao, J., Yang, H., & Chen, P. (2024) · Cell Death and Disease · doi:10.1038/s41419-024-06625-6 · Cited by 29
Oxidative and Glycolytic Metabolism: Their Reciprocal Regulation and Dysregulation in Cancer
Cordani, M., Rumio, C., Bontempi, G., Strippoli, R., & Marcucci, F. (2025) · Cells · doi:10.3390/cells14151177 · Cited by 28
Crosstalk between oncogenic MYC and noncoding RNAs in cancer
Tu, R., Chen, Z., Bao, Q., Liu, H., & Qing, G. (2020) · Seminars in Cancer Biology · doi:10.1016/j.semcancer.2020.10.014 · Cited by 25
Awasthee, N., Shekher, A., Rai, V., Verma, S. S., Mishra, S., Dhasmana, A., & Gupta, S. C. (2022) · APOPTOSIS · doi:10.1007/s10495-022-01711-6 · Cited by 25
Du, J., Zhang, G., Qiu, H., Yu, H., & Yuan, W. (2020) · Cancer Cell International · doi:10.1186/s12935-020-1154-x · Cited by 25
RetractedPu, F., Shi, D., Chen, T., Liu, Y., Zhong, B., Zhang, Z., Liu, W.-J., Wu, Q., Wang, B.-C., Shao, Z., et al. (2021) · Cell Death and Disease · doi:10.1038/s41419-020-03352-6 · Cited by 23
The Roles of IDH1 in Tumor Metabolism and Immunity
Ni, Y., Shen, P., Wang, X. T., Liu, H., Luo, H., & Han, X. (2022) · Future Oncology · doi:10.2217/fon-2022-0583 · Cited by 23
Yang, K., Zhong, Z., Zou, J., Liao, J., Chen, S., Zhou, S., Zhao, Y., Li, J., Yin, D., Huang, K., et al. (2024) · Cancer Letters · doi:10.1016/j.canlet.2024.216840 · Cited by 21
Cui, Z., Li, J., Li, C., Deng, S., Liu, W., Lei, T., Cao, J., Wang, Z., Wang, X., Ma, S., et al. (2025) · Cell Reports · doi:10.1016/j.celrep.2025.115917 · Cited by 22
Oncogenic lncRNA LINC00973 promotes Warburg effect by enhancing LDHA enzyme activity
Wang, H., Lin, K., Zhu, L., Zhang, S., Li, L., Liao, Y., Zhang, B., Yang, M., Liu, X., Li, L., et al. (2021) · 中国科学通报:英文版 · doi:10.1016/j.scib.2021.01.001 · Cited by 20
Self-citationQi, X., Yan, Q., Shang, Y., Zhao, R., Ding, X., Gao, S., Wan, L., & Lu, C. (2022) · Cell Death and Differentiation · doi:10.1038/s41418-022-01011-1 · Cited by 19
Non-coding RNAs in gynecologic cancer
Solati, A., Taghvimi, S., Khatami, S. H., Shabaninejad, Z., Malekzadegan, Y., Alizadeh, M., Mousavi, P., Taheri‐Anganeh, M., Razmjoue, D., Bahmyari, S., et al. (2023) · Clinica Chimica Acta · doi:10.1016/j.cca.2023.117618 · Cited by 18
Jiang, B., Yuan, Y., Yi, T., & Dang, W. (2023) · Biomolecules · doi:10.3390/biom13040684 · Cited by 17
Zhang, H., Yao, B., Tang, S., & Chen, Y. (2019) · Medical Science Monitor · doi:10.12659/msm.913609 · Cited by 16
Non-coding RNAs, metabolic stress and adaptive mechanisms in cancer
Liu, X., Feng, S., Zhang, X. D., Li, J., Zhang, K., Wu, M., & Thorne, R. F. (2020) · Cancer Letters · doi:10.1016/j.canlet.2020.06.024 · Cited by 15
Self-citationIDH1 fine-tunes cap-dependent translation initiation
Liu, L., Lu, J. Y., Li, F., Xing, X., Li, T., Yang, X., & Shen, X. (2019) · Journal of Molecular Cell Biology · doi:10.1093/jmcb/mjz082 · Cited by 14
Zhu, Q., Lei, Z., Xu, C., Zhang, Z., Yu, Z., Cheng, Z., Xiao, P., Li, S., Yu, W., & Zhou, J. (2023) · Cancer Medicine · doi:10.1002/cam4.6117 · Cited by 14
Su, M., Liang, Z., Shan, S., Gao, Y., Li, H., Liu, X., Wang, A., Wang, H., & Cai, H. (2024) · Cancer Medicine · doi:10.1002/cam4.7221 · Cited by 13
Shi, C., Wang, Y., Guo, J., Zhang, D., Zhang, Y., Zhang, X., & Gong, Z. (2025) · Biochemical and Biophysical Research Communications · doi:10.1016/j.bbrc.2025.151535 · Cited by 13
Self-citationThe VAX2-LINC01189-hnRNPF signaling axis regulates cell invasion and migration in gastric cancer
Hong, L., Yang, P., Zhang, L., Liu, X., Wei, X., Xiao, W., Yu, Z., Zhang, J., Peng, Y., Wu, X., et al. (2023) · Cell Death Discovery · doi:10.1038/s41420-023-01688-4 · Cited by 12
Long non‑coding RNAs and microRNAs as regulators of stress in cancer (Review)
Pierouli, K., Papakonstantinou, E., Papageorgiou, L., Diakou, I., Mitsis, Τ., Dragoumani, K., Spandidos, D. A., Bacopoulou, F., Chrousos, G. P., Goulielmos, G. N., et al. (2022) · Molecular Medicine Reports · doi:10.3892/mmr.2022.12878 · Cited by 12
Shen, S., Xu, Y., Gong, Z., Teng, Y., Qiao, D., Huang, Y., Zhang, Z., Gao, J., Ni, H., Jin, Z., et al. (2022) · Aging and Disease · doi:10.14336/ad.2022.0826 · Cited by 11
Reciprocal interactions between lncRNAs and MYC in colorectal cancer: partners in crime
Lei, Z., Zhu, Z., Yao, Z., Dai, X., Dong, Y., Chen, B., Wang, S., Wang, S., Bentum‐Ennin, L., Jin, L., et al. (2024) · Cell Death and Disease · doi:10.1038/s41419-024-06918-w · Cited by 11
Self-citationNon-coding RNAs: emerging regulators of glucose metabolism in hepatocellular carcinoma.
Lai, Y., Huang, H., Abudoureyimu, M., Lin, X., Tian, C., Wang, T., Chu, X., & Wang, R. (2020) · PubMed Central · Cited by 11
Zhang, B., Thorne, R. F., Zhang, P., Wu, M., & Liu, L. (2022) · Advanced Science · doi:10.1002/advs.202201210 · Cited by 11
Self-citationTranscriptional regulation of autophagy‐lysosomal pathway in cancer
Chang, X., & Dong, R. (2020) · Thoracic Cancer · doi:10.1111/1759-7714.13287 · Cited by 11
DeepIMAGER: Deeply Analyzing Gene Regulatory Networks from scRNA-seq Data
Zhou, X., Pan, J., Chen, L., Zhang, S., & Chen, Y. (2024) · Biomolecules · doi:10.3390/biom14070766 · Cited by 11
LncRNA IDH1-AS1 suppresses cell proliferation and tumor growth in glioma
Wang, J., Quan, Y. H., Lv, J., Dong, Q. S., & Gong, S. (2020) · Biochemistry and Cell Biology · doi:10.1139/bcb-2019-0465 · Cited by 10
FIT links c-Myc and P53 acetylation by recruiting RBBP7 during colorectal carcinogenesis
Guo, L., Xia, Y., Li, H., Wang, Z., Xu, H., Dai, X., Zhang, Y., Zhang, H., Fan, W., Wei, F., et al. (2023) · Cancer Gene Therapy · doi:10.1038/s41417-023-00624-z · Cited by 10
Self-citationLINK‑A lncRNA activates HIF1α signaling and inhibits podocyte cell apoptosis in diabetic nephropathy
Yang, J., Li, L., Hong, S., Zhou, Z., & Fan, W. (2019) · Experimental and Therapeutic Medicine · doi:10.3892/etm.2019.7542 · Cited by 11
Zhou, J., Xu, Y., Wang, L., Cong, Y., Huang, K., Pan, X., Liu, G., Li, W., Dai, C., Xu, P., et al. (2023) · Journal of Biomedical Research · doi:10.7555/jbr.37.20230097 · Cited by 9
Nesterov, S. V., Ilyinsky, N. S., Plokhikh, K. S., Manuylov, V. D., Chesnokov, Y. M., Vasilov, R. G., Kuznetsova, I. М., Константинович, Т. К., Gordeliy, V., Fonin, A. V., et al. (2024) · International Journal of Biological Macromolecules · doi:10.1016/j.ijbiomac.2024.131455 · Cited by 9
The crosstalk between non-coding RNAs and oxidative stress in cancer progression
Sun, Q., Lei, X., & Yang, X. (2024) · Genes & Diseases · doi:10.1016/j.gendis.2024.101286 · Cited by 10
Long noncoding RNAs regulating enzymatic reactions in cancer
Shin, C. H., Kim, K., Ho, C. W., Lee, J. W., Jo, M. J., Min, K., & Yoon, J. (2025) · Experimental & Molecular Medicine · doi:10.1038/s12276-025-01464-7 · Cited by 12
Molecular profile of non-coding RNA-mediated glycolysis control in human cancers
Mirzaei, S., Ranjbar, B., & Tackallou, S. H. (2023) · Pathology - Research and Practice · doi:10.1016/j.prp.2023.154708 · Cited by 8
Cao, L., Abudureheman, W., Shen, G., Ouyang, Y., Yang, W., Zhao, Q., Lu, T., & Lin, C. W. (2025) · Scientific Reports · doi:10.1038/s41598-025-01698-5 · Cited by 8
Li, B., Yao, B., Guo, X., Wang, Z., Xie, W., Wu, X., Wang, F., & Mei, Y. (2023) · Cancer Gene Therapy · doi:10.1038/s41417-023-00631-0 · Cited by 8
Ranjan, P., & Dubey, V. K. (2022) · Life Sciences · doi:10.1016/j.lfs.2022.121314 · Cited by 8
Research progress of the Otubains subfamily in hepatocellular carcinoma
Wu, Y., Sani, S. B. M., Peng, K., Lin, T., Tan, C., Huang, X., & Li, Z. (2024) · Biomedicine & Pharmacotherapy · doi:10.1016/j.biopha.2024.117348 · Cited by 7
Progress in non-coding RNA research
Chen, L., Feng, S., Fan, Z., Chang, G. O. N. G., Liu, B., Liu, Z., ChuanWei, L. I., Song, E., Sun, S., Wu, G., et al. (2019) · Scientia Sinica Vitae · doi:10.1360/ssv-2019-0179 · Cited by 7
Self-citationHu, X.-L., Huang, X.-T., Zhang, J.-N., Liu, J., Wen, L.-J., Xu, X. Y., & Zhou, J. (2022) · Research Square · doi:10.21203/rs.3.rs-1207674/v1 · Cited by 7
The Role of Non-Coding RNAs in MYC-Mediated Metabolic Regulation: Feedback Loops and Interactions
Alamoudi, A. A. (2025) · Non-Coding RNA · doi:10.3390/ncrna11020027 · Cited by 6
Wu, F., Liu, Q., Zhang, J., Xu, D., Jiang, X., Zhang, K., Chen, Y., Xia, X., Jiang, Z., Shi, Y., et al. (2025) · Cell Death and Disease · doi:10.1038/s41419-025-07702-0 · Cited by 7
SIRT1/P53 pathway is involved in the Arsenic induced aerobic glycolysis in hepatocytes L-02 cells
Zhang, M., Zhang, Z., Lou, Q., Zhang, X., Yin, F., Yin, Y., Xu, H., Zhang, Y., Fan, C., Gao, Y., et al. (2023) · Environmental Science and Pollution Research · doi:10.1007/s11356-023-27570-5 · Cited by 6
Self-citationReciprocal regulation of lncRNA MEF and c-Myc drives colorectal cancer tumorigenesis
Wu, S., Dai, X., Zhu, Z., Fan, D., Jiang, S., Dong, Y., Chen, B., Xie, Q., Yao, Z., Li, Q., et al. (2024) · Neoplasia · doi:10.1016/j.neo.2024.100971 · Cited by 6
Self-citation
Metadata
- Authors
- Xiang, S., Gu, H., Jin, L., Thorne, R. F., Zhang, X. D., & Wu, M.
- Affiliations
- University of Science and Technology of China (CN)
- Henan University (CN)
- Corresponding author
- Zhang, Xu Dong
- Wu, Mian
- Venue
- Proceedings of the National Academy of Sciences
- Publisher
- National Academy of Sciences
- Published
- 2018-01-29
- Volume
- 115
- Issue
- 7
- Pages
- E1465-E1474
- ISSN
- 0027-8424 (ISSN-L)
- 1091-6490
- PMC
- PMC5816142
- OpenAlex
- W2793701251
- Cited by
- 129
- References
- 71
- Citations by year
- 2026: 6 · 2025: 16 · 2024: 15 · 2023: 16 · 2022: 15 · 2021: 19 · 2020: 25 · 2019: 11 · 2018: 6
- FWCI
- 4.61
- Type
- journal article
- Language
- en
- Open access
- hybrid
- doi.org
- Licence
- Locations
- Proceedings of the National Academy of Sciences (publishedVersion, cc-by-nc-nd)
- PubMed Central (publishedVersion, cc-by-nc-nd)
- PubMed (publishedVersion)
- Funders
- National Natural Science Foundation of China (81430065, 31371388)
- Topics
- Life Sciences › Biochemistry, Genetics and Molecular Biology › Cancer Research › Cancer, Hypoxia, and Metabolism
- Life Sciences › Biochemistry, Genetics and Molecular Biology › Cancer Research › Cancer-related molecular mechanisms research
- Life Sciences › Biochemistry, Genetics and Molecular Biology › Molecular Biology › Metabolism, Diabetes, and Cancer
- Keywords
- long non-coding RNA, c-Myc, HIF-1α, IDH1, Warburg effect, glycolysis, reactive oxygen species, hypoxia, cancer metabolism, cell proliferation
- MeSH terms
- Animals, Uterine Cervical Neoplasms, Female, Glycolysis, Humans, Isocitrate Dehydrogenase, Ketoglutaric Acids, Mice, Nude, Tumor Cells, Cultured, Transcriptional Activation, Proto-Oncogene Proteins c-myc, RNA, Antisense, Xenograft Model Antitumor Assays, Cell Proliferation, Mice, Hypoxia-Inducible Factor 1, alpha Subunit, RNA, Long Noncoding
About these checks
Registry, retraction, Cites and statistics results are computed, not judged, with one exception: a printed reference that no index lists is read once by a model before it counts as a citation error. Claims are extracted by a model and kept only when their quote appears verbatim in the text; each cited source is then checked, with a model’s help, for whether it says what the claim relies on. Those verdicts can be wrong — read the claim’s quote and the cited source before relying on one.
Statistics and arithmetic are recomputed, not judged.
Confidence bands are shown only for fields calibrated on our annotated test set. None is calibrated yet, so no band is shown.
What counts as a claim ›How we measure confidence ›How we check this ›
Are you an author, or do you see a problem with this page? Request a review
