

The DOI matches its Crossref record; 44 of the 45 references it cites were found in a registry or an index.
Thymic involution and rising disease incidence with age
Open accessAbstract
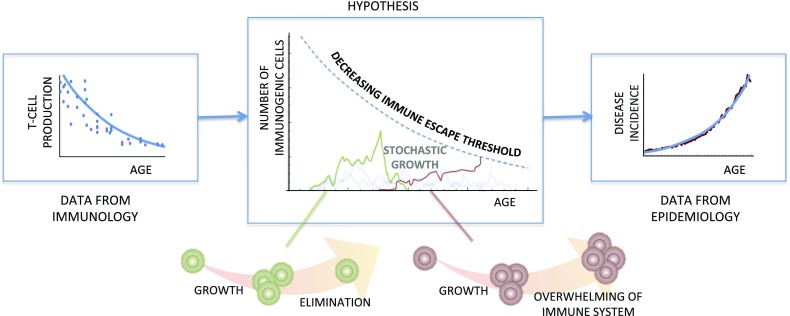
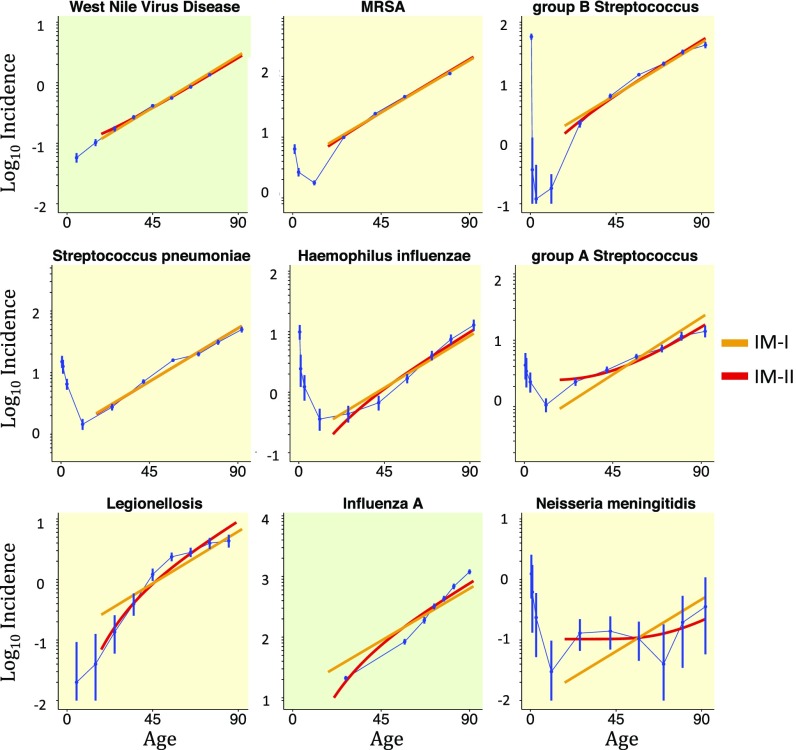
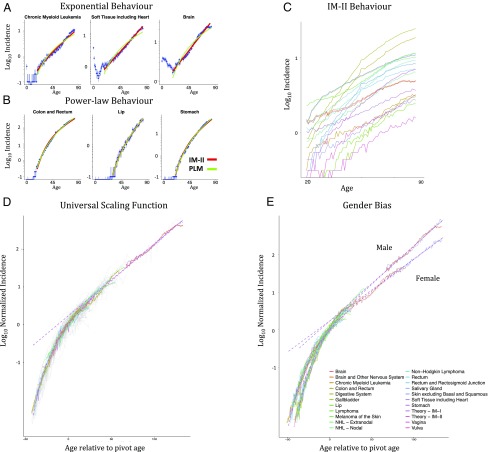
Significance: Understanding the risk factors of carcinogenesis is a major goal of biomedical research. Historically, the focus has been on the role of somatic mutations, and the reason for cancer typically occurring late in life is predominantly attributed to a gradual accumulation of such mutations. We challenge that view and propose that the decline of the immune system is the primary reason why cancer is an age-related disease. The immunological model featured here captures risk profiles for many cancer types and infectious diseases, suggesting that therapies reversing T cell exhaustion or restoring T cell production will be promising avenues of treatment.
Overview
The claims and statistics of this paper haven’t been checked yet.
Run the check — free, no account needed. It reads the open-access text and checks the sources it cites.
Integrity signals
Registry
Cites
Statistics
Figures
Verification
Claims the paper makes
The claims and statistics of this paper haven’t been checked yet.
Run the check — free, no account needed. It reads the open-access text and checks the sources it cites.
Claims other papers make about this one
Each is checked against this paper’s own text: does it say what the citing paper says it does?
In the citing paper
“T cell–output decline is an important feature of immunosenescence as well as the production of senescence-associated secretory phenotype, increased glycolysis, and reactive oxygen species.”
From Immunosenescence: a key player in cancer development (2020) · cites this paper as [24]
In the citing paper
“By analyzing the age distributions of 100 different tumors, Palmer et al. [24] concluded that the immune system may play an important role in tumor development.”
From Immunosenescence: a key player in cancer development (2020) · cites this paper as [24]
Self-check
Percentages, sums and reported differences re-computed from the paper’s own numbers.
The self-check needs the paper’s full text.
Citations
Cites
A new look at the statistical model identification
Akaike, H. (1974) · IEEE Transactions on Automatic Control · doi:10.1109/tac.1974.1100705 · Cited by 51,879
The serial cultivation of human diploid cell strains
Hayflick, L., & Moorhead, P. S. (1961) · Experimental Cell Research · doi:10.1016/0014-4827(61)90192-6 · Cited by 8,508
Vogelstein, B., Papadopoulos, N., Velculescu, V. E., Zhou, S., Diaz, L. A., & Kinzler, K. W. (2013) · Science · doi:10.1126/science.1235122 · Cited by 7,863
Druker, B. J., Talpaz, M., Resta, D. J., Peng, B., Buchdunger, E., Ford, J., Lydon, N., Kantarjian, H. M., Capdeville, R., Ohno-Jones, S., et al. (2001) · New England Journal of Medicine · doi:10.1056/nejm200104053441401 · Cited by 5,237
Variation in cancer risk among tissues can be explained by the number of stem cell divisions
Tomasetti, C., & Vogelstein, B. (2015) · Science · doi:10.1126/science.1260825 · Cited by 1,927
Changes in thymic function with age and during the treatment of HIV infection
Douek, D. C., McFarland, R. D., Keiser, P. H., Gage, E. A., Massey, J. M., Haynes, B. F., Polis, M. A., Haase, A. T., Feinberg, M. B., Sullivan#, J. L., et al. (1998) · Nature · doi:10.1038/25374 · Cited by 1,893
The Age Distribution of Cancer and a Multi-stage Theory of Carcinogenesis
Armitage, P., & Doll, R. (1954) · British Journal of Cancer · doi:10.1038/bjc.1954.1 · Cited by 1,549
The age distribution of cancer and a multi-stage theory of carcinogenesis
Armitage, P., & Doll, R. (2004) · British Journal of Cancer · doi:10.1038/sj.bjc.6602297 · Cited by 1,292
Moskophidis, D., Lechner, F., Pircher, H., & Zinkernagel, R. M. (1993) · Nature · doi:10.1038/362758a0 · Cited by 1,240
T-cell exhaustion in the tumor microenvironment
Jiang, Y., Li, Y., & Zhu, B. (2015) · Cell Death and Disease · doi:10.1038/cddis.2015.162 · Cited by 1,197
Cited by
Sorted by citations
Items 301–362 of 362
Niu, Y., Kang, H., Wang, P., Guo, C., Nie, F., Ji, H., Wu, J., & Chen, L. (2023) · SIAM Journal on Applied Mathematics · doi:10.1137/22m1497729
Caruso, B. P., & Moran, A. E. (2023) · Trends in cancer · doi:10.1016/j.trecan.2023.04.007
Rehman, B., Murad, B., Mushtaq, S., Khan, M., Rehman, A. U., Ali, F., Ahmad, T., Shafi, H., & Ansari, S. R. (2021) · Journal of Khyber College of Dentistry · doi:10.33279/jkcd.v11i01.170
Vaccinating Against Cancer - How to Force the Quadrature of the Circle
Giese, M. (2023) · International Internal Medicine Journal · doi:10.33140/iimj.01.05.06
Strategies to induce tolerance
McCallion, O., Hester, J., & Issa, F. (2024) · Elsevier eBooks · doi:10.1016/b978-0-443-23571-9.00046-3
Age-Related Features of the Response of Cancer Stem Cells and T Cells in Experimental Lung Cancer
Pershina, О. V., Ermakova, N. N., Pakhomova, A. V., Pan, E. S., Sandrikina, L. A., Zhukova, М. А., Kogai, L. V., Дыгай, А. М., & Skurikhin, Е. G. (2024) · Bulletin of Experimental Biology and Medicine · doi:10.1007/s10517-024-06052-9
Arvey, A. J., Rowe, M., Legutki, J. B., An, G., Gollapudi, A., Lei, A., Colston, B. W., Putterman, C., Smith, D. S., Stiles, J., et al. (2020) · Figshare · doi:10.6084/m9.figshare.13059533
Arvey, A. J., Rowe, M., Legutki, J. B., An, G., Gollapudi, A., Lei, A., Colston, B. W., Putterman, C., Smith, D. S., Stiles, J., et al. (2020) · Figshare · doi:10.6084/m9.figshare.13059530
Arvey, A. J., Rowe, M., Legutki, J. B., An, G., Gollapudi, A., Lei, A., Colston, B. W., Putterman, C., Smith, D. S., Stiles, J., et al. (2020) · Figshare · doi:10.6084/m9.figshare.13059572
Arvey, A. J., Rowe, M., Legutki, J. B., An, G., Gollapudi, A., Lei, A., Colston, B. W., Putterman, C., Smith, D. S., Stiles, J., et al. (2020) · Figshare · doi:10.6084/m9.figshare.13059536
Arvey, A. J., Rowe, M., Legutki, J. B., An, G., Gollapudi, A., Lei, A., Colston, B. W., Putterman, C., Smith, D. S., Stiles, J., et al. (2020) · Figshare · doi:10.6084/m9.figshare.13059539
Kumari, P., Soni, J., & Pandey, R. (2024) · Springer eBooks · doi:10.1007/978-3-031-70088-0_9
Cao, N., Cheng, F., Zhou, J., & Liu, N. (2024) · Discover Oncology · doi:10.1007/s12672-024-01655-0
Li, L., & Jin, J. (2025) · STAR Protocols · doi:10.1016/j.xpro.2025.103612
The Role of NAD+-Dependent Signal Mechanisms in Cancer Development and Treatment
Lu, T., Qin, Z., & Wu, J. (2025) · Springer eBooks · doi:10.1007/978-981-97-9877-3_33
Yang, B., Teng, M., Chen, Y., & Zhang, T. (2025) · Research Square · doi:10.21203/rs.3.rs-6607233/v1
Balasubramanian, S., Muttath, G., & Karan, R. (2025) · Springer eBooks · doi:10.1007/978-981-99-7842-7_117
Translating Preclinical Studies into the Clinic: Assays and Endpoints Selected to Determine Efficacy
Horsman, M. R., & Siemann, D. W. (2025) · Molecular Cancer Therapeutics · doi:10.1158/1535-7163.mct-25-0739
Ahmed, T., Verma, A., & Takayama, S. (2025) · Biomacromolecules · doi:10.1021/acs.biomac.5c00926
Song, Y., Ji, Z., Zhang, X., Liang, Q., Li, Z., Huang, X., Chen, J.-N., Zhou, Y., Wang, X., Zhao, L., et al. (2025) · Med Research · doi:10.1002/mdr2.70045
Wang, D., Fang, X., Deng, Y., Wen, X., Liu, O., Xu, J., Fan, F.-D., Wang, D., Han, Y., Zanvit, P., et al. (2025) · Nature Communications · doi:10.1038/s41467-025-64973-z · Cited by 1
Arvey, A. J., Rowe, M., Legutki, J. B., An, G., Gollapudi, A., Lei, A., Colston, B. W., Putterman, C., Smith, D., Stiles, J., et al. (2020) · Figshare · doi:10.6084/m9.figshare.13059563
Arvey, A. J., Rowe, M., Legutki, J. B., An, G., Gollapudi, A., Lei, A., Colston, B. W., Putterman, C., Smith, D., Stiles, J., et al. (2020) · Figshare · doi:10.6084/m9.figshare.13059560
Arvey, A. J., Rowe, M., Legutki, J. B., An, G., Gollapudi, A., Lei, A., Colston, B. W., Putterman, C., Smith, D., Stiles, J., et al. (2020) · Figshare · doi:10.6084/m9.figshare.13059545
Arvey, A. J., Rowe, M., Legutki, J. B., An, G., Gollapudi, A., Lei, A., Colston, B. W., Putterman, C., Smith, D., Stiles, J., et al. (2020) · Figshare · doi:10.6084/m9.figshare.13059551
Arvey, A. J., Rowe, M., Legutki, J. B., An, G., Gollapudi, A., Lei, A., Colston, B. W., Putterman, C., Smith, D., Stiles, J., et al. (2020) · Figshare · doi:10.6084/m9.figshare.13059557
Arvey, A. J., Rowe, M., Legutki, J. B., An, G., Gollapudi, A., Lei, A., Colston, B. W., Putterman, C., Smith, D., Stiles, J., et al. (2020) · Figshare · doi:10.6084/m9.figshare.13059554
Arvey, A. J., Rowe, M., Legutki, J. B., An, G., Gollapudi, A., Lei, A., Colston, B. W., Putterman, C., Smith, D., Stiles, J., et al. (2020) · Figshare · doi:10.6084/m9.figshare.13059569
Arvey, A. J., Rowe, M., Legutki, J. B., An, G., Gollapudi, A., Lei, A., Colston, B. W., Putterman, C., Smith, D., Stiles, J., et al. (2020) · Figshare · doi:10.6084/m9.figshare.13059566
Arvey, A. J., Rowe, M., Legutki, J. B., An, G., Gollapudi, A., Lei, A., Colston, B. W., Putterman, C., Smith, D., Stiles, J., et al. (2020) · Figshare · doi:10.6084/m9.figshare.13059548
Arvey, A. J., Rowe, M., Legutki, J. B., An, G., Gollapudi, A., Lei, A., Colston, B. W., Putterman, C., Smith, D., Stiles, J., et al. (2020) · Figshare · doi:10.6084/m9.figshare.13059542
Disruption of Thymic Microenvironment with Age: Remodeling of Blood Vessels and Extracellular Matrix
Hasegawa, H., Kondo, M., Hikida, T., & Nakayama, K. (2025) · BPB Reports · doi:10.1248/bpbreports.8.6_208
Decoding thymic development: a single-cell atlas of tree shrew immunity
Tang, H., He, Y., Zhang, L., Cao, Y., Li, B., Liang, L., Yun, C., Tao, J., Zhai, S., Li, Z., et al. (2026) · Frontiers in Immunology · doi:10.3389/fimmu.2025.1689906
Is Thymic Involution Truly a Deterioration or an Adaptation?
Iwasa, Y., Hayashi, R., Hara, A., & Matsuo, K. (2026) · Bulletin of Mathematical Biology · doi:10.1007/s11538-025-01569-0
Chen, J., Zhou, X., Wei, L., Tian, Z., Zeng, H., Yan, F., Zhou, J., Zeng, X., Meng, F., Cao, X., et al. (2026) · International Journal of Molecular Sciences · doi:10.3390/ijms27021022
Aubert, O., Kergaravat, C., Katerinis, I., Boudhabhay, I., Léon, J., Troger, A., Chavarot, N., Roger, C., Burger, C., Stang, M.-B. L., et al. (2026) · American Journal of Transplantation · doi:10.1016/j.ajt.2026.02.009
Rethinking immune studies: population-level immune variations and the path forward
Hysong, M. R., Memili, A., Delaney, J. A., Ekunwe, L., Huber, S. A., Reiner, A. P., Patsy, B. M., Sitlani, C. M., Tracy, R. P., Taylor, K. D., et al. (2026) · The Journals of Gerontology Series A · doi:10.1093/gerona/glag055
Study on Peto's Paradox with Predator-Prey Dynamics and Spatial Evolutionary Games
Kan, H. (2025) · Institutional Repositories DataBase (IRDB)
Lagoda, V. N. (2026) · Terapevt (General Physician) · doi:10.33920/med-12-2603-05
Walther, I. L., Mostafa, K., Horr, A., Freitag‐Wolf, S., Seoudy, H., Müller, O. J., Krutmann, S., Jansen, O., & Langguth, P. (2026) · Biomedicines · doi:10.3390/biomedicines14040883
Zhong, A., Zhang, H., Yan, X., Pan, Y., & Zhou, N. (2026) · Aquaculture Reports · doi:10.1016/j.aqrep.2026.103608
Immunotherapy for senescent cell clearance: Hallmarks, strategies and translational challenges
Zhang, W., Chen, S., & Zhuang, X. (2026) · Ageing Research Reviews · doi:10.1016/j.arr.2026.103174
TCR Repertoire: Metrics, Structure and Clinical Implementation
Zornikova, K. (2026) · IntechOpen eBooks · doi:10.5772/intechopen.1015233
Wei, L., Sun, F., Pan, H., Yao, J., Wang, M., Kang, Y., & Yang, J. (2026) · Frontiers in Cell and Developmental Biology · doi:10.3389/fcell.2026.1816627
Costaguta, G., Dinatale, B., Araujo, I. L., Savino, W., Álvarez, F., Bottasso, O., Pérez, A. R., González, F. B., & Costaguta, A. C. (2026) · Frontiers in Immunology · doi:10.3389/fimmu.2026.1864634
miRNA delivery via nanowires restores functional responses in aged T cells
Dai, Z., Grier, S., Zhong, Z., Dravid, A., Mejías, J. C., Koff, J. L., Garcı́a, A. J., & Singh, A. K. (2026) · Cell Biomaterials · doi:10.1016/j.celbio.2026.100514
Clinical rationale for thymic restoration in adult immunosenescence
Sewell, P. E., & Jensen, C. (2026) · Immunity & Ageing · doi:10.1186/s12979-026-00584-6
Niu, X., Nur, Z., Xie, W., Sun, Y., Wang, L. F., & Zheng, Y. (2026) · Frontiers in Immunology · doi:10.3389/fimmu.2026.1781004 · Cited by 1
Long‐Term Cancer and Mortality After Thymectomy
Shelly, S., Ani, M., Klein, C. J., Li, Y., Kaminski, H. J., Wolfe, G. I., Miron, K., & Ramon‐Gonen, R. (2026) · European Journal of Neurology · doi:10.1111/ene.70721
Lei, Q., & Guo, X. (2026) · Frontiers in Oncology · doi:10.3389/fonc.2026.1912627
Kergaravat, C., Doisne, J., Godard, C., Cieślak, A., Amrane, M., Vermijlen, D., Asnafi, V., Benlagha, K., Santo, J. P. D., Clave, E., et al. (2026) · European Journal of Immunology · doi:10.1002/eji.70257
Proliferation as a natural strategy to suppress neoplasia
Sarma, A. A., Goentoro, L. A., & Doyle, J. C. (2026) · Proceedings of the National Academy of Sciences · doi:10.1073/pnas.2605763123
Thymic regeneration and tumor immunotherapy
Chen, Z., Wang, Q., Lu, Q., Liu, W., & Wu, X. (2026) · Frontiers in Immunology · doi:10.3389/fimmu.2026.1891681 · Cited by 1
Ferroptosis of hematopoietic stem cells in the pathogenesis of age-associated solid tumors
Шевченко, В. Е., Kushnir, T., Gudkova, M. V., & Arnotskaya, N. E. (2026) · Advances in molecular oncology · doi:10.17650/2313-805x-2026-13-2-8-18
The adult thymus reawakened: From healthy aging marker to immunotherapy biomarker
Peng, Y.-L., Lu, C., Lin, Y., & Zhou, Q. (2026) · The Innovation Medicine · doi:10.59717/j.xinn-med.2027.100275
Vitamin D signaling in thymic development and longevity
Artusa, P., & White, J. H. (2026) · Frontiers in Nutrition · doi:10.3389/fnut.2026.1961627
Amishi, & Bohidar, H. B. (2026) · Biosystems · doi:10.1016/j.biosystems.2026.105959
Thymic function as a central determinant of immune competence and clinical outcomes
Taviani, A., Genah, S., Mancusi, A., Luca, C. D. D., Rosichini, M., Locatelli, F., & Velardi, E. (2026) · Seminars in Immunopathology · doi:10.1007/s00281-026-01088-7
Immune system ontogeny—a subtle evolution to perfection
Munteanu, A. N., Surcel, M., Dobre, E. G., Constantin, C., & Neagu, M. (2026) · Frontiers in Aging · doi:10.3389/fragi.2026.1872955
Tumor-associated immunosenescence: Mechanisms, biomarkers and age-adaptive immunotherapy
Wu, H., Yang, Z., Zhang, H., Jin, Y., Ji, S., Zhang, Z., Sun, G., & Zhang, X. (2026) · Critical Reviews in Oncology/Hematology · doi:10.1016/j.critrevonc.2026.105647
Immunosenescence in radio-immunotherapy: From biological mechanisms to therapeutic opportunities?
Liu, S., Li, L., 张德意, Yin, Z., Guan, Y., & Yuan, Z. (2026) · Ageing Research Reviews · doi:10.1016/j.arr.2026.103434
Zhao, P., Li, X., Wang, X., Xu, T., & Lu, H. (2026) · Frontiers in Immunology · doi:10.3389/fimmu.2026.1903197
Metadata
- Authors
- Palmer, S., Albergante, L., Blackburn, C. C., & Newman, T. J.
- Affiliations
- University of Dundee (GB)
- Inserm (FR)
- MRC Centre for Regenerative Medicine (GB)
- Corresponding author
- Palmer, Sam
- Newman, T. J.
- Venue
- Proceedings of the National Academy of Sciences
- Publisher
- National Academy of Sciences
- Published
- 2018-02-05
- Volume
- 115
- Issue
- 8
- Pages
- 1883-1888
- ISSN
- 0027-8424 (ISSN-L)
- 1091-6490
- PMC
- PMC5828591
- OpenAlex
- W2788857602
- Cited by
- 364
- References
- 45
- Citations by year
- 2026: 51 · 2025: 53 · 2024: 45 · 2023: 43 · 2022: 37 · 2021: 36 · 2020: 56 · 2019: 26 · 2018: 17
- FWCI
- 15.04
- Type
- journal article
- Language
- en
- Open access
- hybrid
- doi.org
- Licence
- Locations
- Proceedings of the National Academy of Sciences (publishedVersion, cc-by-nc-nd)
- PubMed Central (publishedVersion, cc-by-nc-nd)
- PubMed (publishedVersion)
- Discovery Research Portal (University of Dundee) (submittedVersion, cc-by-nc-nd)
- Edinburgh Research Explorer (University of Edinburgh) (submittedVersion, cc-by-nc-nd)
- Funders
- SULSA (U54 CA143682)
- EC | Seventh Framework Programme (602587)
- Topics
- Life Sciences › Immunology and Microbiology › Immunology › T-cell and B-cell Immunology
- Life Sciences › Biochemistry, Genetics and Molecular Biology › Aging › Genetics, Aging, and Longevity in Model Organisms
- Physical Sciences › Computer Science › Artificial Intelligence › Artificial Immune Systems Applications
- Keywords
- thymic involution, immunosenescence, cancer incidence, infectious disease incidence, power law model, mutation accumulation, aging
- MeSH terms
- Aging, Female, Humans, Male, Models, Biological, Mutation, Neoplasms, Thymus Gland, Genetic Predisposition to Disease
About these checks
Registry, retraction, Cites and statistics results are computed, not judged, with one exception: a printed reference that no index lists is read once by a model before it counts as a citation error. Claims are extracted by a model and kept only when their quote appears verbatim in the text; each cited source is then checked, with a model’s help, for whether it says what the claim relies on. Those verdicts can be wrong — read the claim’s quote and the cited source before relying on one.
Statistics and arithmetic are recomputed, not judged.
Confidence bands are shown only for fields calibrated on our annotated test set. None is calibrated yet, so no band is shown.
What counts as a claim ›How we measure confidence ›How we check this ›
Are you an author, or do you see a problem with this page? Request a review
