Student or educator? Sign up with your school email and get 6 months of Pro free.
Cited by 61

The DOI matches its Crossref record; 34 of the 34 references it cites were found in a registry or an index.

Regulation of inflammatory responses by dynamic subcellular localization of RNA-binding protein Arid5a

Higa, Mitsuru, Oka, Masahiro, Fujihara, Yoshitaka, Masuda, Kazuya, Yoneda, Yoshihiro, Kishimoto, Tadamitsu·2018·Proceedings of the National Academy of Sciences

Abstract

Significance: Immune cell activation is accompanied by dynamic changes in expression of genes related to inflammation. Concomitantly, immune reactions are tightly controlled to prevent harmful pathologies due to sustained inflammation. Gene expression is controlled at multiple checkpoints. Among these, the post-transcriptional regulation of the balance between Arid5a and Regnase-1 is important for the induction of inflammation. Our findings provide important insight into the role of the regulation of nucleocytoplasmic localization of Arid5a in the development of inflammation through the induction of a change in the ratio of Arid5a to Regnase-1.

Overview

The claims and statistics of this paper haven’t been checked yet.

Run the check — free, no account needed. It reads the open-access text and checks the sources it cites.

A few free checks a day · papers already verified open instantly · results are public

Integrity signals

Registry

Crossref · 10.1073/pnas.1719921115

Cites

34 of 34 references verified0 citation errors · 0 not checkable

Statistics

Figures

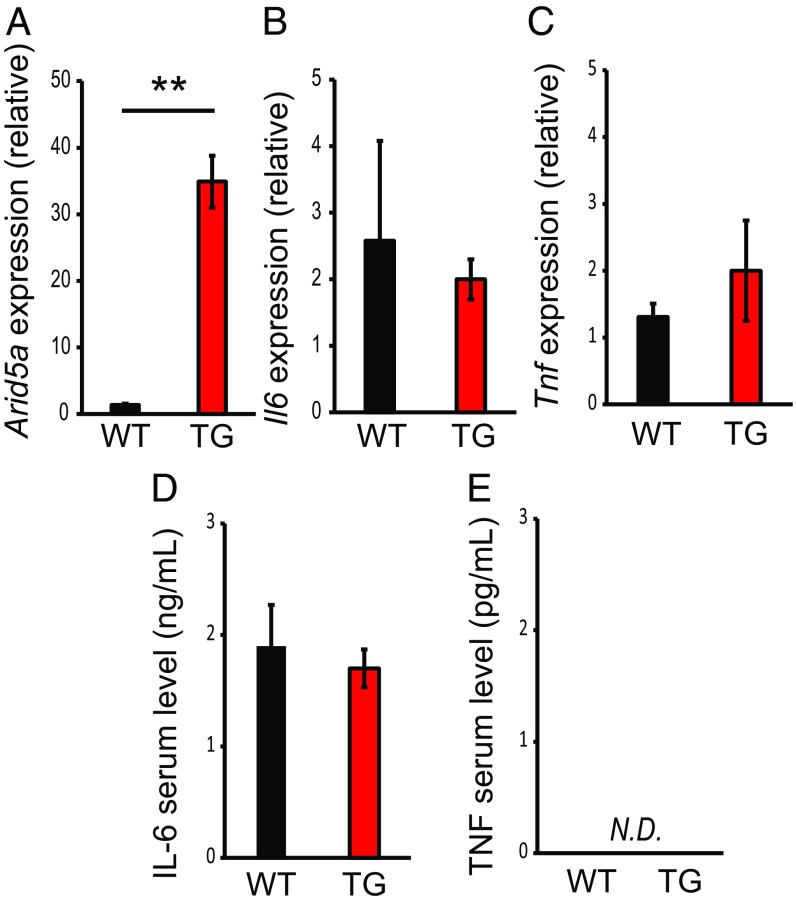
Fig. 1. Arid5a did not affect inflammatory cytokine production under unstimulated conditions. (A–C) qRT-PCR analysis of Arid5a (A), Il6 (B), and Tnf (C) mRNAs in peritoneal macrophages, normalized to the expression of GAPDH. (D and E) Serum levels of IL-6 (D) and TNF (E) in WT and Arid5a TG mice were measured by ELISA. Data show the mean ± SEM of three independent experiments. Asterisks indicate statistically significant differences between WT and TG values. **P < 0.01, Student’s t test. N.D., not detected.
Fig. 1. Arid5a did not affect inflammatory cytokine production under unstimulated conditions. (A–C) qRT-PCR analysis of Arid5a (A), Il6 (B), and Tnf (C) mRNAs in peritoneal macrophages, normalized to the expression of GAPDH. (D and E) Serum levels of IL-6 (D) and TNF (E) in WT and Arid5a TG mice were measured by ELISA. Data show the mean ± SEM of three independent experiments. Asterisks indicate statistically significant differences between WT and TG values. **P < 0.01, Student’s t test. N.D., not detected.CC BY-NC-ND · PubMed Central
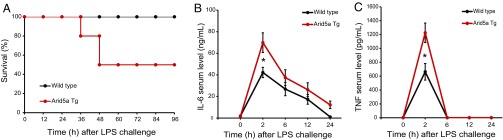
Fig. 2. Arid5a TG mice were more sensitive to endotoxic shock than WT mice. (A) The 6- to 8-wk-old WT (n = 10) and Arid5a TG mice (n = 10) were injected with E. coli LPS (12.5 mg/kg), and survival was monitored for 96 h. (B and C) WT and Arid5a TG mice (6–8 wk old) were injected with LPS (5 mg/kg). Serum levels of IL-6 (B) or TNF (C) measured by ELISA at the indicated time points after LPS challenge. Data are the mean ± SEM of three independent experiments. Asterisks indicate statistically significant differences between WT and TG values (*P < 0.05, Student’s t test).
Fig. 2. Arid5a TG mice were more sensitive to endotoxic shock than WT mice. (A) The 6- to 8-wk-old WT (n = 10) and Arid5a TG mice (n = 10) were injected with E. coli LPS (12.5 mg/kg), and survival was monitored for 96 h. (B and C) WT and Arid5a TG mice (6–8 wk old) were injected with LPS (5 mg/kg). Serum levels of IL-6 (B) or TNF (C) measured by ELISA at the indicated time points after LPS challenge. Data are the mean ± SEM of three independent experiments. Asterisks indicate statistically significant differences between WT and TG values (*P < 0.05, Student’s t test).CC BY-NC-ND · PubMed Central
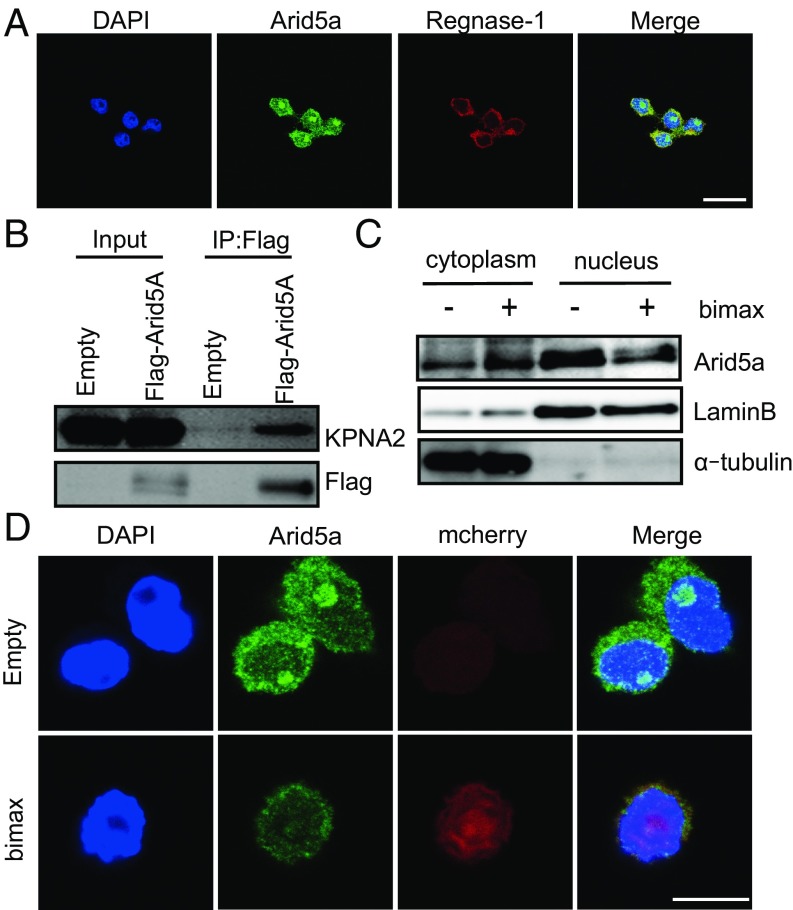
Fig. 3. Arid5a was actively imported into the nucleus. (A) Immunofluorescence staining of RAW264.7 cells was performed. The cells were incubated with indicated antibodies, and nuclei were visualized with DAPI. (Scale bar: 10 µm.) (B) HEK293T cells were transfected with Flag-tagged Arid5A or empty vector. Whole-cell lysates were prepared. Immunoprecipitation was performed with anti-Flag beads, followed by Western blotting with anti-Flag and anti-KPNA2 antibodies. (C) RAW264.7 cells were transfected with an empty or bimax vector. After 24 h, the cells were fractionated into cytoplasmic and nuclear extracts and analyzed by Western blot analysis using the indicated antibodies. (D) RAW264.7 cells were transfected with empty or bimax vector. After 24 h, cells were subjected to immunofluorescence staining. The cells were incubated with anti-Arid5a antibodies. The nuclei were visualized with DAPI. (Scale bar: 10 µm.)
Fig. 3. Arid5a was actively imported into the nucleus. (A) Immunofluorescence staining of RAW264.7 cells was performed. The cells were incubated with indicated antibodies, and nuclei were visualized with DAPI. (Scale bar: 10 µm.) (B) HEK293T cells were transfected with Flag-tagged Arid5A or empty vector. Whole-cell lysates were prepared. Immunoprecipitation was performed with anti-Flag beads, followed by Western blotting with anti-Flag and anti-KPNA2 antibodies. (C) RAW264.7 cells were transfected with an empty or bimax vector. After 24 h, the cells were fractionated into cytoplasmic and nuclear extracts and analyzed by Western blot analysis using the indicated antibodies. (D) RAW264.7 cells were transfected with empty or bimax vector. After 24 h, cells were subjected to immunofluorescence staining. The cells were incubated with anti-Arid5a antibodies. The nuclei were visualized with DAPI. (Scale bar: 10 µm.)CC BY-NC-ND · PubMed Central
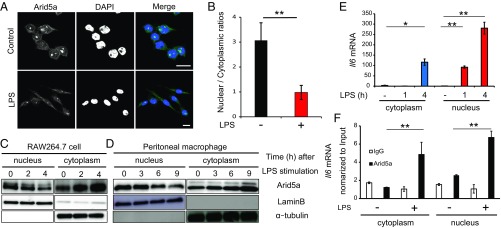
Fig. 4. Nucleocytoplasmic ratio of Arid5a protein changes after LPS stimulation (A) RAW264.7 cells were stimulated with or without LPS (500 ng/mL) for 4 h and then analyzed by immunofluorescence staining. The cells were incubated with anti-Arid5a antibodies, and nuclei were visualized with DAPI. (Scale bar: 10 µm.) (B) Mean nuclear/cytoplasm ratios (n = 50; **P < 0.01; Student’s t test). (C and D) Cells were stimulated with LPS (RAW264.7 cells: 500 ng/mL, peritoneal macrophages: 100 ng/mL) at the indicated times and were then fractionated into cytoplasmic and nuclear extracts and analyzed by Western blot analysis using the indicated antibodies. (E) RAW264.7 cells were stimulated with LPS (100 ng/mL) at the indicated times. Cytoplasmic and nuclear extracts were isolated, and Il6 mRNA was evaluated by qRT-PCR, with normalization to GAPDH expression. The data show the mean ± SD of three independent experiments. Asterisks indicate statistically significant differences between time point values (*P < 0.05; **P < 0.01, Student’s t test). (F) After LPS stimulation for 4 h, total RNA isolated from Arid5a immunoprecipitation of each compartment was subjected to qRT-PCR analysis. RNA levels in the Arid5a-bound fraction of each compartment were normalized to input levels and then compared with those in cells without stimulation. Data show the mean ± SD of three independent experiments. Asterisks indicate statistically significant differences between unstimulated and stimulated Arid5a-Il6 mRNA values (**P < 0.01, Student’s t test).
Fig. 4. Nucleocytoplasmic ratio of Arid5a protein changes after LPS stimulation (A) RAW264.7 cells were stimulated with or without LPS (500 ng/mL) for 4 h and then analyzed by immunofluorescence staining. The cells were incubated with anti-Arid5a antibodies, and nuclei were visualized with DAPI. (Scale bar: 10 µm.) (B) Mean nuclear/cytoplasm ratios (n = 50; **P < 0.01; Student’s t test). (C and D) Cells were stimulated with LPS (RAW264.7 cells: 500 ng/mL, peritoneal macrophages: 100 ng/mL) at the indicated times and were then fractionated into cytoplasmic and nuclear extracts and analyzed by Western blot analysis using the indicated antibodies. (E) RAW264.7 cells were stimulated with LPS (100 ng/mL) at the indicated times. Cytoplasmic and nuclear extracts were isolated, and Il6 mRNA was evaluated by qRT-PCR, with normalization to GAPDH expression. The data show the mean ± SD of three independent experiments. Asterisks indicate statistically significant differences between time point values (*P < 0.05; **P < 0.01, Student’s t test). (F) After LPS stimulation for 4 h, total RNA isolated from Arid5a immunoprecipitation of each compartment was subjected to qRT-PCR analysis. RNA levels in the Arid5a-bound fraction of each compartment were normalized to input levels and then compared with those in cells without stimulation. Data show the mean ± SD of three independent experiments. Asterisks indicate statistically significant differences between unstimulated and stimulated Arid5a-Il6 mRNA values (**P < 0.01, Student’s t test).CC BY-NC-ND · PubMed Central
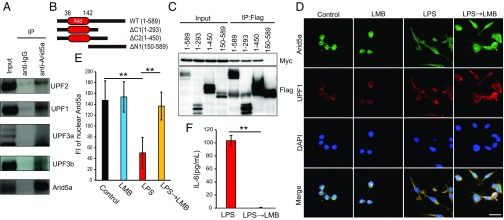
Fig. 5. Arid5a was associated with UPF1. (A) RAW264.7 cells were lysed with NETN buffer, and whole-cell lysates were then prepared. Immunoprecipitation was performed with anti-Arid5a antibodies and protein G Sepharose, followed by Western blot analysis with the indicated antibodies. (B) Schematic representation of truncated Arid5A. The Arid domain is shown in red. The amino acids present in each mutant are indicated. (C) Flag-tagged full-length (1–589) or truncated (1–293, 1–450, or 150–589) Arid5a was expressed with Myc-tagged UPF1 in HEK293T cells, and cell lysates were prepared. Immunoprecipitation was performed with anti-Flag beads, followed by Western blot analysis with anti-Flag and anti-Myc antibodies. (D) RAW264.7 cells were treated with or without LMB (10 nM) for 2 h, LPS (500 ng/mL) for 4 h, or LPS for 2 h + LMB for 2 h, and then analyzed by immunofluorescence staining. The nuclei were visualized with DAPI. (Scale bar: 10 µm.) (E) Fluorescence intensity of nuclear Arid5a. Asterisks indicate statistically significant differences between samples (n = 50; **P < 0.01; Student’s t test). (F) Levels of IL-6 in the medium from cultures of RAW264.7 cells were measured by ELISA. Data show the mean ± SEM of three independent experiments. Asterisks indicate statistically significant differences between LPS and LPS → LMB values (**P < 0.01, Student’s t test).
Fig. 5. Arid5a was associated with UPF1. (A) RAW264.7 cells were lysed with NETN buffer, and whole-cell lysates were then prepared. Immunoprecipitation was performed with anti-Arid5a antibodies and protein G Sepharose, followed by Western blot analysis with the indicated antibodies. (B) Schematic representation of truncated Arid5A. The Arid domain is shown in red. The amino acids present in each mutant are indicated. (C) Flag-tagged full-length (1–589) or truncated (1–293, 1–450, or 150–589) Arid5a was expressed with Myc-tagged UPF1 in HEK293T cells, and cell lysates were prepared. Immunoprecipitation was performed with anti-Flag beads, followed by Western blot analysis with anti-Flag and anti-Myc antibodies. (D) RAW264.7 cells were treated with or without LMB (10 nM) for 2 h, LPS (500 ng/mL) for 4 h, or LPS for 2 h + LMB for 2 h, and then analyzed by immunofluorescence staining. The nuclei were visualized with DAPI. (Scale bar: 10 µm.) (E) Fluorescence intensity of nuclear Arid5a. Asterisks indicate statistically significant differences between samples (n = 50; **P < 0.01; Student’s t test). (F) Levels of IL-6 in the medium from cultures of RAW264.7 cells were measured by ELISA. Data show the mean ± SEM of three independent experiments. Asterisks indicate statistically significant differences between LPS and LPS → LMB values (**P < 0.01, Student’s t test).CC BY-NC-ND · PubMed Central
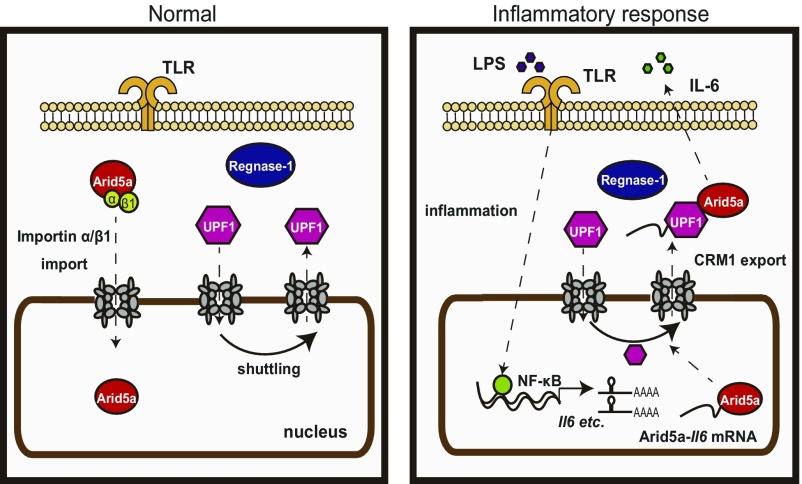
Fig. 6. Model of inflammatory response by Arid5a/Regnase-1/UPF1. Regnase-1 localizes to the cytoplasm. Arid5a is imported via an importin-α/β1 pathway. UPF1 shuttles between the nucleus and the cytoplasm. In response to inflammation, the Toll-like receptor (TLR) is activated by LPS, and Il6 mRNA is induced by NF-κB. After that, Arid5a interacts with Il6 mRNA. Arid5a is exported to the cytoplasm via CRM1 pathway with UPF1.
Fig. 6. Model of inflammatory response by Arid5a/Regnase-1/UPF1. Regnase-1 localizes to the cytoplasm. Arid5a is imported via an importin-α/β1 pathway. UPF1 shuttles between the nucleus and the cytoplasm. In response to inflammation, the Toll-like receptor (TLR) is activated by LPS, and Il6 mRNA is induced by NF-κB. After that, Arid5a interacts with Il6 mRNA. Arid5a is exported to the cytoplasm via CRM1 pathway with UPF1.CC BY-NC-ND · PubMed Central

Verification

Claims the paper makes

The claims and statistics of this paper haven’t been checked yet.

Run the check — free, no account needed. It reads the open-access text and checks the sources it cites.

A few free checks a day · papers already verified open instantly · results are public

Claims other papers make about this one

Each is checked against this paper’s own text: does it say what the citing paper says it does?

Self-check

Percentages, sums and reported differences re-computed from the paper’s own numbers.

The self-check needs the paper’s full text.

Citations

Cites

Show all 34 references

Cited by

Metadata

Authors
Higa, M., Oka, M., Fujihara, Y., Masuda, K., Yoneda, Y., & Kishimoto, T.
Affiliations
  • Laboratory of Immune Regulation, Immunology Frontier Research Center, Osaka University, Suita, 565-0871 Osaka, Japan;
  • Laboratory of Nuclear Transport Dynamics, National Institutes of Biomedical Innovation, Health and Nutrition, Ibaraki, 567-0085 Osaka, Japan;
  • Research Institute for Microbial Diseases, Osaka University, Suita, 565-0871 Osaka, Japan;
  • National Institutes of Biomedical Innovation, Health and Nutrition, Ibaraki, 567-0085 Osaka, Japan
Venue
Proceedings of the National Academy of Sciences
Published
2018-01-22
Volume
115
Issue
6
ISSN
  • 0027-8424
  • 1091-6490
Cited by
61
References
34
Language
en

About these checks

Registry, retraction, Cites and statistics results are computed, not judged, with one exception: a printed reference that no index lists is read once by a model before it counts as a citation error. Claims are extracted by a model and kept only when their quote appears verbatim in the text; each cited source is then checked, with a model’s help, for whether it says what the claim relies on. Those verdicts can be wrong — read the claim’s quote and the cited source before relying on one.

Statistics and arithmetic are recomputed, not judged.

Confidence bands are shown only for fields calibrated on our annotated test set. None is calibrated yet, so no band is shown.

What counts as a claim ›How we measure confidence ›How we check this ›

Are you an author, or do you see a problem with this page? Request a review

Data sources

Bibliographic data: Semantic Scholar, OpenAlex, Crossref.

Contains information from the Semantic Scholar Academic Graph Datasets, made available under the ODC Attribution License (ODC-BY 1.0).

Semantic Scholar’s data is described in: Kinney, R., et al. (2023). The Semantic Scholar Open Data Platform. arXiv:2301.10140.