

The DOI matches its Crossref record; 35 of the 35 references it cites were found in a registry or an index.
Differential effects of partial and complete loss of TREM2 on microglial injury response and tauopathy
Open accessAbstract
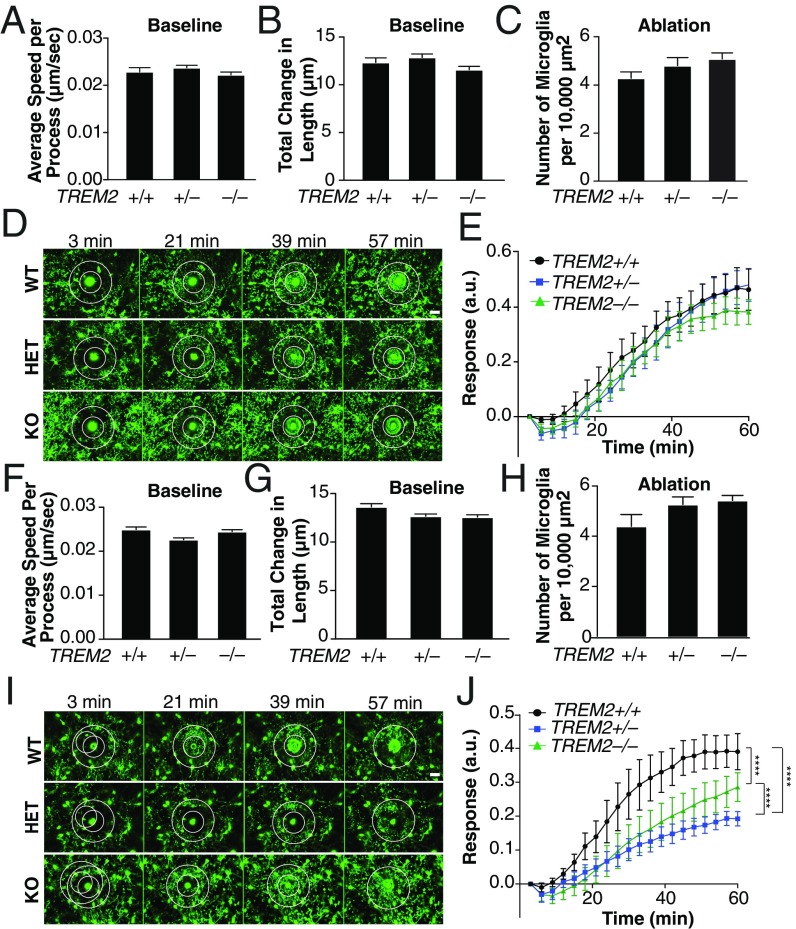
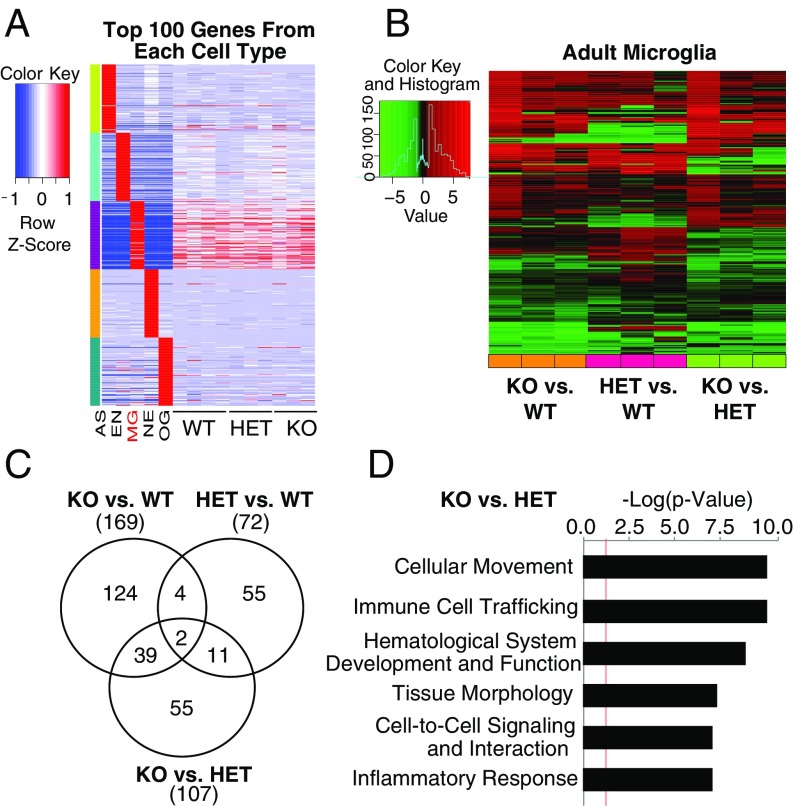
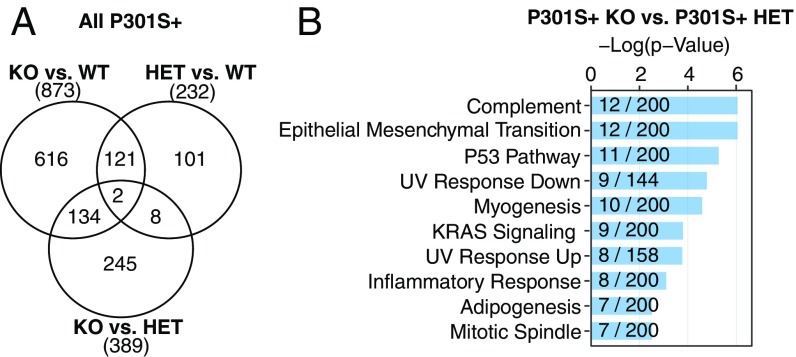
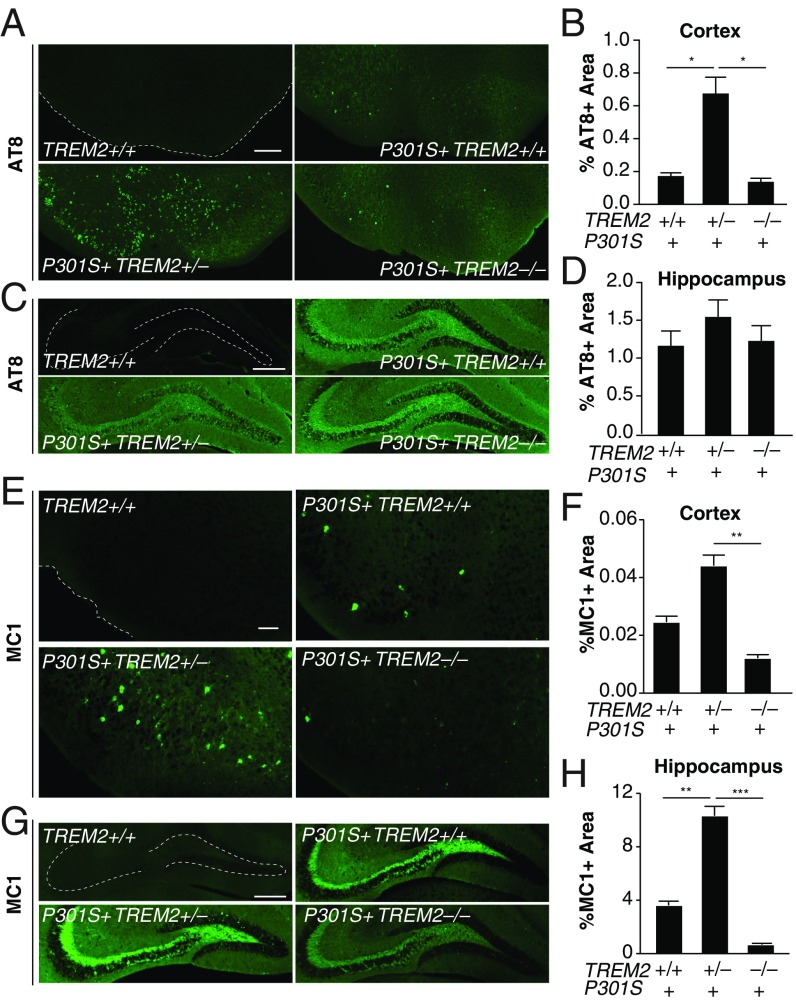
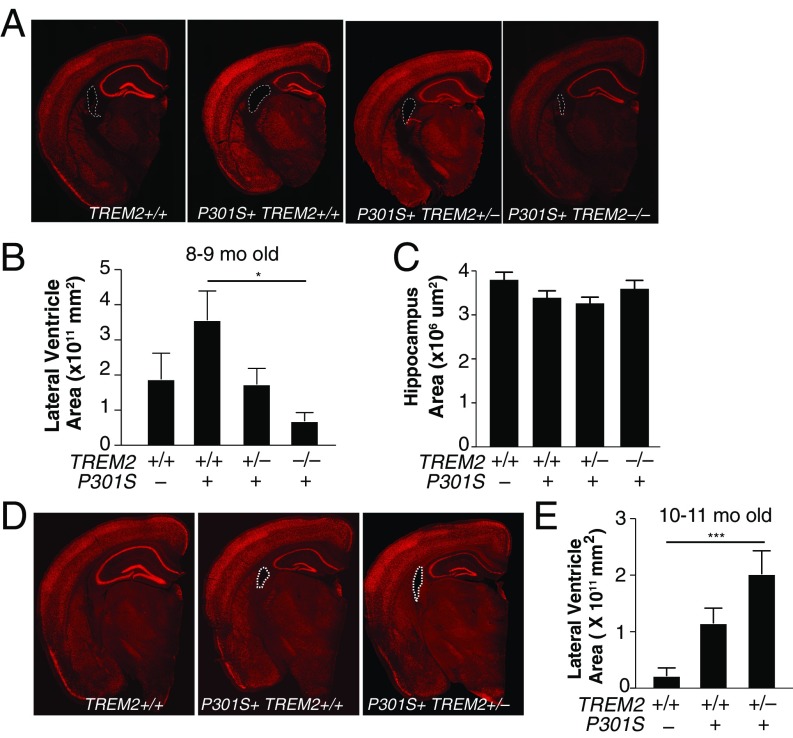
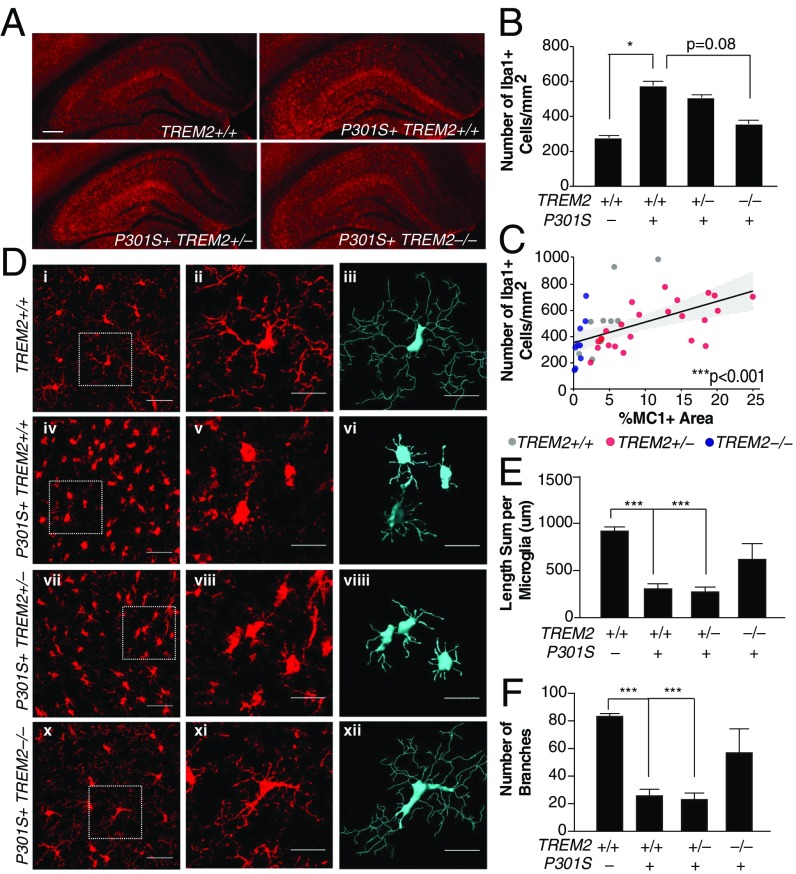
Alzheimer’s disease (AD), the most common form of dementia, is characterized by the abnormal accumulation of amyloid plaques and hyperphosphorylated tau aggregates, as well as microgliosis. Hemizygous missense variants in Triggering Receptor Expressed on Myeloid Cells 2 ( TREM2 ) are associated with elevated risk for developing late-onset AD. These variants are hypothesized to result in loss of function, mimicking TREM2 haploinsufficiency. However, the consequences of TREM2 haploinsufficiency on tau pathology and microglial function remain unknown. We report the effects of partial and complete loss of TREM2 on microglial function and tau-associated deficits. In vivo imaging revealed that microglia from aged TREM2-haploinsufficient mice show a greater impairment in their injury response compared with microglia from aged TREM2-KO mice. In transgenic mice expressing mutant human tau, TREM2 haploinsufficiency, but not complete loss of TREM2, increased tau pathology. In addition, whereas complete TREM2 deficiency protected against tau-mediated microglial activation and atrophy, TREM2 haploinsufficiency elevated expression of proinflammatory markers and exacerbated atrophy at a late stage of disease. The differential effects of partial and complete loss of TREM2 on microglial function and tau pathology provide important insights into the critical role of TREM2 in AD pathogenesis.
Overview
The claims and statistics of this paper haven’t been checked yet.
Run the check — free, no account needed. It reads the open-access text and checks the sources it cites.
Integrity signals
Registry
Cites
Statistics
Figures
Verification
Claims the paper makes
The claims and statistics of this paper haven’t been checked yet.
Run the check — free, no account needed. It reads the open-access text and checks the sources it cites.
Claims other papers make about this one
Each is checked against this paper’s own text: does it say what the citing paper says it does?
The source backs part of the claim, not all of it — or backs it for a different population, condition or comparison.
In the citing paper
“Recent important studies have also shown that impaired/absent Trem2 function attenuates the microglial response to amyloid pathology by regulating microglial number around plaques, regulating microglial activity, and restricting neuritic damage (37,61,84–87,95–99).”
From Trem2 promotes anti-inflammatory responses in microglia and is suppressed under pro-inflammatory conditions (2020) · cites this paper as [97]
Experimental — accuracy not yet measuredThe source backs part of the claim, not all of it — or backs it for a different population, condition or comparison.
In the citing paper
“a complete deficiency in TREM2 protected PS19 mice against tau-mediated microgliosis and brain atrophy [18].”
From TREM2-Deficient Microglia Attenuate Tau Spreading In Vivo (2023) · cites this paper as [18]
Experimental — accuracy not yet measuredThe source backs part of the claim, not all of it — or backs it for a different population, condition or comparison.
In the citing paper
“TREM2 haploinsufficiency (50% reduction in TREM2 levels) increased tau pathology [18].”
From TREM2-Deficient Microglia Attenuate Tau Spreading In Vivo (2023) · cites this paper as [18]
Experimental — accuracy not yet measuredThe source backs part of the claim, not all of it — or backs it for a different population, condition or comparison.
In the citing paper
“Indeed, manipulation of expression of Trem2, Tyrobp, Cx3cl1/Cx3cr1, IL1β, and IFN-γ have all been shown to have opposing effects on amyloid and tau pathologies [49–51, 55–65].”
From Deletion of Abi3/Gngt2 influences age-progressive amyloid β and tau pathologies in distinctive ways (2022) · cites this paper as [49]
Experimental — accuracy not yet measuredThe source backs part of the claim, not all of it — or backs it for a different population, condition or comparison.
In the citing paper
“More recently, this dichotomy has been elegantly demonstrated in multiple models of Trem2 and Tyrobp [49–51, 55–59].”
From Deletion of Abi3/Gngt2 influences age-progressive amyloid β and tau pathologies in distinctive ways (2022) · cites this paper as [49]
Experimental — accuracy not yet measured
The source backs part of the claim, not all of it — or backs it for a different population, condition or comparison.
In the citing paper
“Deficiency of Apoe or Trem2 attenuates tau-dependent neuroinflammation and neurodegeneration in mice expressing human P301S mutant tau (PS19 mice) (Shi et al., 2017; Leyns et al., 2017; Sayed et al., 2018).”
From Cholesterol 25-hydroxylase mediates neuroinflammation and neurodegeneration in a mouse model of tauopathy (2024) · cites this paper as Sayed et al., 2018
Experimental — accuracy not yet measuredThe cited source says what the claim attributes to it.
In the citing paper
“Further complicating matters, haploinsufficiency and total deficiency of TREM2 can lead to opposite effects,44”
From Microglial INPP5D limits plaque formation and glial reactivity in the PSAPP mouse model of Alzheimer's disease (2023) · cites this paper as [44]
The cited source says what the claim attributes to it.
In the citing paper
“In another study that evaluated the effect of TREM2 loss-of-function in the PS19 model, a 50% decrease in TREM2 but not a total reduction enhanced tau phosphorylation and aggregation [18].”
From TREM2-Deficient Microglia Attenuate Tau Spreading In Vivo (2023) · cites this paper as [18]
The cited source says what the claim attributes to it.
In the citing paper
“Surprisingly, recent studies have identified a role for gene dosage in microglial genes, including TREM2, whereby partial and complete loss of gene expression resulted in divergent phenotypic consequences, emphasizing the importance of exploring total PLCG2 loss.”
From PLCG2 modulates TREM2 expression and signaling in response to Alzheimer's disease pathology (2025) · cites this paper as [31]
Self-check
Percentages, sums and reported differences re-computed from the paper’s own numbers.
The self-check needs the paper’s full text.
Citations
Cites
Resting microglial cells are highly dynamic surveillants of brain parenchyma in vivo
Nimmerjahn, A., Kirchhoff, F., & Helmchen, F. (2005) · Science · doi:10.1126/science.1110647 · Cited by 5,827
Zhang, Y., Chen, K., Sloan, S. A., Bennett, M. L., Scholze, A. R., O'Keeffe, S., Phatnani, H. P., Guarnieri, P., Caneda, C., Ruderisch, N., et al. (2014) · The Journal of Neuroscience · doi:10.1523/jneurosci.1860-14.2014 · Cited by 4,875
ATP mediates rapid microglial response to local brain injury in vivo
Davalos, D., Grutzendler, J., Yang, G., Kim, J. V., Zuo, Y., Jung, S., Littman, D. R., Dustin, M. L., & Gan, W.-B. (2005) · Nature Neuroscience · doi:10.1038/nn1472 · Cited by 3,913
Self-citationTREM2 Variants in Alzheimer's Disease
Guerreiro, R., Wojtas, A., Bras, J., Carrasquillo, M., Rogaeva, E., Majounie, E., Cruchaga, C., Sassi, C., Kauwe, J. S. K., Younkin, S., et al. (2013) · New England Journal of Medicine · doi:10.1056/nejmoa1211851 · Cited by 3,020
Jung, S., Aliberti, J., Graemmel, P., Sunshine, M. J., Kreutzberg, G. W., Sher, A., & Littman, D. R. (2000) · Molecular and Cellular Biology · doi:10.1128/mcb.20.11.4106-4114.2000 · Cited by 2,632
Variant of TREM2 Associated with the Risk of Alzheimer's Disease
Jonsson, T., Stefansson, H., Steinberg, S., Jonsdottir, I., Jonsson, P. V., Snaedal, J., Bjornsson, S., Huttenlocher, J., Levey, A. I., Lah, J. J., et al. (2013) · New England Journal of Medicine · doi:10.1056/nejmoa1211103 · Cited by 2,558
Identification of a unique TGF-β–dependent molecular and functional signature in microglia
Butovsky, O., Jedrychowski, M. P., Moore, C. S., Cialic, R., Lanser, A. J., Gabriely, G., Koeglsperger, T., Dake, B., Wu, P. M., Doykan, C. E., et al. (2014) · Nature Neuroscience · doi:10.1038/nn.3599 · Cited by 2,543
Synapse Loss and Microglial Activation Precede Tangles in a P301S Tauopathy Mouse Model
Yoshiyama, Y., Higuchi, M., Zhang, B., Huang, S.-M., Iwata, N., Saido, T. C., Maeda, J., Suhara, T., Trojanowski, J. Q., & Lee, V. M.-Y. (2007) · Neuron · doi:10.1016/j.neuron.2007.01.010 · Cited by 2,208
TREM2 Lipid Sensing Sustains the Microglial Response in an Alzheimer’s Disease Model
Wang, Y., Cella, M., Mallinson, K., Ulrich, J. D., Young, K. L., Robinette, M. L., Gilfillan, S., Krishnan, G. M., Sudhakar, S., Zinselmeyer, B. H., et al. (2015) · Cell · doi:10.1016/j.cell.2015.01.049 · Cited by 1,736
Depletion of microglia and inhibition of exosome synthesis halt tau propagation
Asai, H., Ikezu, S., Tsunoda, S., Medalla, M., Luebke, J., Haydar, T., Wolozin, B., Butovsky, O., Kügler, S., & Ikezu, T. (2015) · Nature Neuroscience · doi:10.1038/nn.4132 · Cited by 1,591
Cited by
Sorted by citations
Items 201–232 of 232
Ibanez, K. R., McFarland, K. N., Phillips, J., Allen, M., Lessard, C. B., Zobel, L., De La Cruz, E. G., Shah, S., Vo, Q., Wang, X., et al. (2022) · Figshare · doi:10.6084/m9.figshare.20390913
Tran, K. M., Kawauchi, S., Kramár, E. A., Rezaie, N., Liang, H. Y., Sakr, J., Gómez-Arboledas, Á., Arreola, M. A., Cunha, C. D., Phan, J., et al. (2023) · Figshare · doi:10.6084/m9.figshare.22612564
Benítez, D. P., Jiang, S., Wood, J. I., Wang, R., Hall, C. M., Peerboom, C., Wong, N., Stringer, K. M., Vitanova, K. S., Smith, V. C., et al. (2021) · Figshare · doi:10.6084/m9.figshare.14992870
Additional file 2 of Trem2 deletion enhances tau dispersion and pathology through microglia exosomes
Zhu, B., Liu, Y., Hwang, S. Y., Archuleta, K., Huang, H., Campos, A., Murad, R., Piña-Crespo, J., Xu, H., & Huang, T. Y. (2022) · Figshare · doi:10.6084/m9.figshare.20861134
Delizannis, A. T., Nonneman, A., Tsering, W., Bondt, A. D., den Wyngaert, I. V., Zhang, B., Meymand, E. S., Olufemi, M. F., Koivula, P. P., Maimaiti, S., et al. (2021) · Figshare · doi:10.6084/m9.figshare.16599810
Dong, Y., Yu, H., Li, X., Bian, K., Zheng, Y., Dai, M., Feng, X., Sun, Y., He, Y., Yu, B., et al. (2022) · Figshare · doi:10.6084/m9.figshare.20495857
Tran, K. M., Kawauchi, S., Kramár, E. A., Rezaie, N., Liang, H. Y., Sakr, J., Gómez-Arboledas, Á., Arreola, M. A., Cunha, C. D., Phan, J., et al. (2023) · Figshare · doi:10.6084/m9.figshare.22612546
Tran, K. M., Kawauchi, S., Kramár, E. A., Rezaie, N., Liang, H. Y., Sakr, J., Gómez-Arboledas, Á., Arreola, M. A., Cunha, C. D., Phan, J., et al. (2023) · Figshare · doi:10.6084/m9.figshare.22612534
Tran, K. M., Kawauchi, S., Kramár, E. A., Rezaie, N., Liang, H. Y., Sakr, J., Gómez-Arboledas, Á., Arreola, M. A., Cunha, C. D., Phan, J., et al. (2023) · Figshare · doi:10.6084/m9.figshare.22612555
Ibanez, K. R., McFarland, K. N., Phillips, J., Allen, M., Lessard, C. B., Zobel, L., De La Cruz, E. G., Shah, S., Vo, Q., Wang, X., et al. (2022) · Figshare · doi:10.6084/m9.figshare.20390892
Tran, K. M., Kawauchi, S., Kramár, E. A., Rezaie, N., Liang, H. Y., Sakr, J., Gómez-Arboledas, Á., Arreola, M. A., Cunha, C. D., Phan, J., et al. (2023) · Figshare · doi:10.6084/m9.figshare.22612570
Ibanez, K. R., McFarland, K. N., Phillips, J., Allen, M., Lessard, C. B., Zobel, L., De La Cruz, E. G., Shah, S., Vo, Q., Wang, X., et al. (2022) · Figshare · doi:10.6084/m9.figshare.20390877
Benítez, D. P., Jiang, S., Wood, J. I., Wang, R., Hall, C. M., Peerboom, C., Wong, N., Stringer, K. M., Vitanova, K. S., Smith, V. C., et al. (2021) · Figshare · doi:10.6084/m9.figshare.14992882
Benítez, D. P., Jiang, S., Wood, J. I., Wang, R., Hall, C. M., Peerboom, C., Wong, N., Stringer, K. M., Vitanova, K. S., Smith, V. C., et al. (2021) · Figshare · doi:10.6084/m9.figshare.14992876
Dong, Y., Yu, H., Li, X., Bian, K., Zheng, Y., Dai, M., Feng, X., Sun, Y., He, Y., Yu, B., et al. (2022) · Figshare · doi:10.6084/m9.figshare.20495848
Tran, K. M., Kawauchi, S., Kramár, E. A., Rezaie, N., Liang, H. Y., Sakr, J., Gómez-Arboledas, Á., Arreola, M. A., Cunha, C. D., Phan, J., et al. (2023) · Figshare · doi:10.6084/m9.figshare.22612567
Tran, K. M., Kawauchi, S., Kramár, E. A., Rezaie, N., Liang, H. Y., Sakr, J., Gómez-Arboledas, Á., Arreola, M. A., Cunha, C. D., Phan, J., et al. (2023) · Figshare · doi:10.6084/m9.figshare.22612573
Ibanez, K. R., McFarland, K. N., Phillips, J., Allen, M., Lessard, C. B., Zobel, L., De La Cruz, E. G., Shah, S., Vo, Q., Wang, X., et al. (2022) · Figshare · doi:10.6084/m9.figshare.20390901
Dong, Y., Yu, H., Li, X., Bian, K., Zheng, Y., Dai, M., Feng, X., Sun, Y., He, Y., Yu, B., et al. (2022) · Figshare · doi:10.6084/m9.figshare.20495830
Benítez, D. P., Jiang, S., Wood, J. I., Wang, R., Hall, C. M., Peerboom, C., Wong, N., Stringer, K. M., Vitanova, K. S., Smith, V. C., et al. (2021) · Figshare · doi:10.6084/m9.figshare.14992867
Ibanez, K. R., McFarland, K. N., Phillips, J., Allen, M., Lessard, C. B., Zobel, L., De La Cruz, E. G., Shah, S., Vo, Q., Wang, X., et al. (2022) · Figshare · doi:10.6084/m9.figshare.20390907
Dong, Y., Yu, H., Li, X., Bian, K., Zheng, Y., Dai, M., Feng, X., Sun, Y., He, Y., Yu, B., et al. (2022) · Figshare · doi:10.6084/m9.figshare.20495839
Additional file 1 of Trem2 deletion enhances tau dispersion and pathology through microglia exosomes
Zhu, B., Liu, Y., Hwang, S. Y., Archuleta, K., Huang, H., Campos, A., Murad, R., Piña-Crespo, J., Xu, H., & Huang, T. Y. (2022) · Figshare · doi:10.6084/m9.figshare.20861131
Tran, K. M., Kawauchi, S., Kramár, E. A., Rezaie, N., Liang, H. Y., Sakr, J., Gómez-Arboledas, Á., Arreola, M. A., Cunha, C. D., Phan, J., et al. (2023) · Figshare · doi:10.6084/m9.figshare.22612540
Tran, K. M., Kawauchi, S., Kramár, E. A., Rezaie, N., Liang, H. Y., Sakr, J., Gómez-Arboledas, Á., Arreola, M. A., Cunha, C. D., Phan, J., et al. (2023) · Figshare · doi:10.6084/m9.figshare.22612552
Tran, K. M., Kawauchi, S., Kramár, E. A., Rezaie, N., Liang, H. Y., Sakr, J., Gómez-Arboledas, Á., Arreola, M. A., Cunha, C. D., Phan, J., et al. (2023) · Figshare · doi:10.6084/m9.figshare.22612561
Vautheny, A. (2019) · theses.fr (ABES) · doi:10.70675/1812d71aze8d9z48d6z87d1z5a23a4e81953
Liao, Y., Ye, S., Zhao, L., Zhou, M., Wen, Y., Zhu, Y., Huang, J., 张罗青, Zhang, X., Guo, P., et al. (2026) · Molecular Neurobiology · doi:10.1007/s12035-026-05925-6
“More concerning is that haploinsufficiency may be more detrimental than complete loss, trapping microglia in a dysfunctional “intermediate state” that fails to provide protection yet sustains chronic neuroinflammation, thereby accelerating Tau aggregation, spread, and neurodegeneration [44].”
Muela‐Zarzuela, I., Alcocer‐Gómez, E., Suarez-Rivero, J. M., Low, E., Ishaq, A., Azkargorta, M., Luque‐Sierra, A., Martı́n, F., Elortza, F., Astorga-Gamaza, A., et al. (2026) · Science Advances · doi:10.1126/sciadv.aec9499 · Cited by 1
“This points to compensatory mechanisms associated with gene dose dependence ( 19 ).”
Wang, H., Wen, R., Parker, E., & Yang, L. (2026) · Cell Communication and Signaling · doi:10.1186/s12964-026-03083-9 · Cited by 2
“In most tau mouse models, including those with TREM2 silencing [112], haploinsufficiency [113, 114], and homozygous deletion [115, 116], TREM2 deficiency exacerbates tau pathology and its spread, whereas TREM2 overexpression attenuates these pathological changes [117].”
Mercado, C., Amaro, A., Martínez-Pinto, J., Vidal, R., Jury, N., & Lasagna‐Reeves, C. A. (2026) · Journal of Neuroinflammation · doi:10.1186/s12974-026-04065-x
Metadata
- Authors
- Sayed, F. A., Telpoukhovskaia, M., Kodama, L., Li, Y., Zhou, Y., Le, D., Hauduc, A., Ludwig, C., Gao, F., Clelland, C., Zhan, L., Cooper, Y. A., Davalos, D., Akassoglou, K., Coppola, G., & Gan, L.
- Affiliations
- Gladstone Institutes (US)
- University of California, Los Angeles (US)
- Corresponding author
- Gan, Li
- ORCID
- Venue
- Proceedings of the National Academy of Sciences
- Publisher
- National Academy of Sciences
- Published
- 2018-09-19
- Volume
- 115
- Issue
- 40
- Pages
- 10172-10177
- ISSN
- 0027-8424 (ISSN-L)
- 1091-6490
- PMC
- PMC6176614
- OpenAlex
- W2890556232
- Cited by
- 229
- References
- 35
- Citations by year
- 2026: 15 · 2025: 23 · 2024: 31 · 2023: 40 · 2022: 44 · 2021: 33 · 2020: 19 · 2019: 21 · 2018: 3
- FWCI
- 8.55
- Type
- journal article
- Language
- en
- Open access
- hybrid
- doi.org
- Licence
- Locations
- Proceedings of the National Academy of Sciences (publishedVersion, cc-by-nc-nd)
- Europe PMC (PubMed Central) (publishedVersion, cc-by-nc-nd)
- PubMed Central (publishedVersion, cc-by-nc-nd)
- PubMed (publishedVersion)
- eScholarship (California Digital Library) (submittedVersion)
- eScholarship (California Digital Library) (submittedVersion, cc-by-nc-nd)
- Funders
- HHS | NIH | National Institute on Aging (R01AG051390, R01AG054214)
- Topics
- Life Sciences › Neuroscience › Neurology › Neuroinflammation and Neurodegeneration Mechanisms
- Life Sciences › Neuroscience › Cellular and Molecular Neuroscience › Alzheimer's disease research and treatments
- Life Sciences › Biochemistry, Genetics and Molecular Biology › Molecular Biology › Inflammasome and immune disorders
- Keywords
- TREM2, Alzheimer's disease, tauopathy, microglial activation, TREM2 knockout mice, pro-inflammatory markers
- MeSH terms
- Aging, Alzheimer Disease, Animals, Membrane Glycoproteins, Receptors, Immunologic, Microglia, Mice, Knockout, Mutation, Missense, Mice, Haploinsufficiency, Hemizygote
About these checks
Registry, retraction, Cites and statistics results are computed, not judged, with one exception: a printed reference that no index lists is read once by a model before it counts as a citation error. Claims are extracted by a model and kept only when their quote appears verbatim in the text; each cited source is then checked, with a model’s help, for whether it says what the claim relies on. Those verdicts can be wrong — read the claim’s quote and the cited source before relying on one.
Statistics and arithmetic are recomputed, not judged.
Confidence bands are shown only for fields calibrated on our annotated test set. None is calibrated yet, so no band is shown.
What counts as a claim ›How we measure confidence ›How we check this ›
Are you an author, or do you see a problem with this page? Request a review
