

The DOI matches its Crossref record; 76 of the 76 references it cites were found in a registry or an index.
Learning probabilistic neural representations with randomly connected circuits
Open accessPublished version of a preprint
Abstract
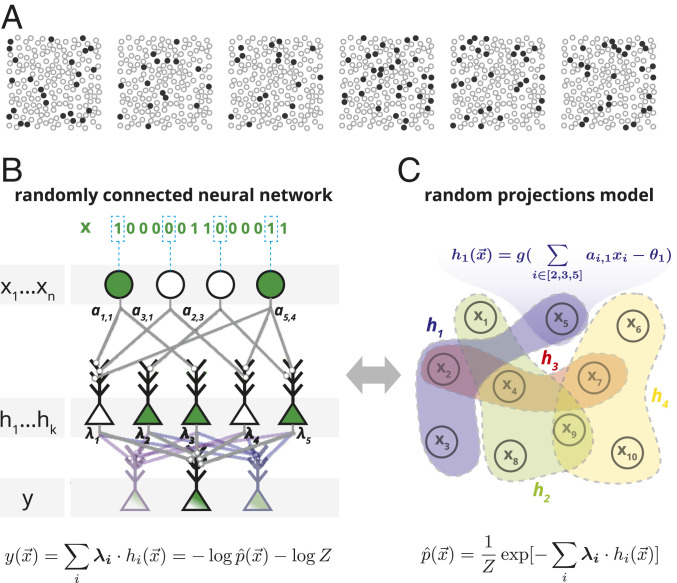
Significance: We present a theory of neural circuits’ design and function, inspired by the random connectivity of real neural circuits and the mathematical power of random projections. Specifically, we introduce a family of statistical models for large neural population codes, a straightforward neural circuit architecture that would implement these models, and a biologically plausible learning rule for such circuits. The resulting neural architecture suggests a design principle for neural circuit—namely, that they learn to compute the mathematical surprise of their inputs, given past inputs, without an explicit teaching signal. We applied these models to recordings from large neural populations in monkeys’ visual and prefrontal cortices and show them to be highly accurate, efficient, and scalable.
Overview
The claims and statistics of this paper haven’t been checked yet.
Free: it reads the open-access text and checks the first 5 claims that cite a source we can check. Create a free account to check every claim.
Integrity signals
Registry
Cites
Statistics
Figures

Verification
Claims the paper makes
The claims and statistics of this paper haven’t been checked yet.
Free: it reads the open-access text and checks the first 5 claims that cite a source we can check. Create a free account to check every claim.
Self-check
Percentages, sums and reported differences re-computed from the paper’s own numbers.
The self-check needs the paper’s full text.
Citations
Cites
Advances in neural information processing systems 7
Cios, K., & Shields, M. (1997) · Neurocomputing · doi:10.1016/s0925-2312(97)90018-7 · Cited by 22,059
Reducing the dimensionality of data with neural networks
Hinton, G. E., & Salakhutdinov, R. R. (2006) · Science · doi:10.1126/science.1127647 · Cited by 20,928
Neural networks and physical systems with emergent collective computational abilities.
Hopfield, J. J. (1982) · Proceedings of the National Academy of Sciences · doi:10.1073/pnas.79.8.2554 · Cited by 19,270 · cited 1×
“Top-down approaches suggest biologically plausible circuits that solve particular computational tasks but often rely on explicit “teaching signals” or do not even specify how learning could take place (8–14).”
BackgroundGuide for the Care and Use of Laboratory Animals: Eighth Edition
(2011) · doi:10.17226/12910 · Cited by 16,199
Information theory and statistical mechanics
Jaynes, E. T. (1957) · Physical Review · doi:10.1103/physrev.106.620 · Cited by 12,931
Advances in Neural Information Processing Systems 25
Zhang, Y., Sutton, C. A., Storkey, A., & Zoubin Ghahramani, A. (2012) · Cited by 12,653
A neural substrate of prediction and reward
Schultz, W., Dayan, P., & Montague, P. R. (1997) · Science · doi:10.1126/science.275.5306.1593 · Cited by 9,388
BEAST 2: a software platform for Bayesian evolutionary analysis
Bouckaert, R., Heled, J., Kühnert, D., Vaughan, T., Wu, C.-H., Xie, D., Suchard, M. A., Rambaut, A., & Drummond, A. J. (2014) · PLoS Computational Biology · doi:10.1371/journal.pcbi.1003537 · Cited by 6,527
Rao, R. P. N., & Ballard, D. H. (1999) · Nature Neuroscience · doi:10.1038/4580 · Cited by 5,483 · cited 1×
“The idea that the brain computes the probability of its inputs is supported by evidence of responses to novel inputs or events (28, 29) and has been explored in different contexts such as the hippocampal (30), olfactory (31), and visual (32) systems, as well as in the role of dopamine (33).”
BackgroundSparse coding with an overcomplete basis set: A strategy employed by V1?
Olshausen, B. A., & Field, D. J. (1997) · Vision Research · doi:10.1016/s0042-6989(97)00169-7 · Cited by 3,642
Research works printed but not linked: 2
- J. W. Gibbs, Elementary Principles of Statistical Mechanics (Dover Publications, NY; Reprint Edition, 2014).
- Y. Nesterov, A method of solving a convex programming problem with convergence rate O (1/k2). Soviet Mathematics Doklady 27, 372–376 (1983).
Cited by
Alhamrouni, I., Abdul Kahar, N. H., Salem, M., Swadi, M., Zahroui, Y., Kadhim, D. J., Mohamed, F. A., & Alhuyi Nazari, M. (2024) · Applied Sciences · doi:10.3390/app14146214 · Cited by 217
Sequential and efficient neural-population coding of complex task information
Koay, S. A., Charles, A. S., Thiberge, S. Y., Brody, C. D., & Tank, D. W. (2021) · Neuron · doi:10.1016/j.neuron.2021.10.020 · Cited by 91
A neuroscience-inspired spiking neural network for EEG-based auditory spatial attention detection
Faghihi, F., Cai, S., & Moustafa, A. A. (2022) · Neural Networks · doi:10.1016/j.neunet.2022.05.003 · Cited by 45
Rational thoughts in neural codes
Wu, Z., Kwon, M., Daptardar, S., Schrater, P., & Pitkow, X. (2020) · Proceedings of the National Academy of Sciences · doi:10.1073/pnas.1912336117 · Cited by 27
Toward Principles of Brain Network Organization and Function
Kulkarni, S., & Bassett, D. S. (2025) · Annual Review of Biophysics · doi:10.1146/annurev-biophys-030722-110624 · Cited by 36
Metadata
- Authors
- Maoz, O., Tkačik, G., Esteki, M. S., Kiani, R., & Schneidman, E.
- Affiliations
- Weizmann Institute of Science (IL)
- Institute of Science and Technology Austria (AT)
- Center for Neural Science, New York University, New York, NY 10003;
- NYU Langone Health (US)
- Corresponding author
- Kiani, Roozbeh
- Schneidman, Elad
- Venue
- Proceedings of the National Academy of Sciences
- Publisher
- National Academy of Sciences
- Published
- 2020-09-18
- Volume
- 117
- Issue
- 40
- Pages
- 25066-25073
- ISSN
- 0027-8424 (ISSN-L)
- 1091-6490
- PMC
- PMC7547210
- OpenAlex
- W3087227179
- Cited by
- 44
- References
- 76
- Citations by year
- 2026: 8 · 2025: 5 · 2024: 13 · 2023: 6 · 2022: 4 · 2021: 4 · 2020: 3
- FWCI
- 2.28
- Type
- journal article
- Language
- en
- Open access
- hybrid
- doi.org
- Licence
- Locations
- Proceedings of the National Academy of Sciences (publishedVersion, cc-by-nc-nd)
- bioRxiv (Cold Spring Harbor Laboratory) (acceptedVersion)
- PubMed Central (publishedVersion, cc-by-nc-nd)
- PubMed (publishedVersion)
- Funders
- EC | FP7 | FP7 Ideas: European Research Council (311238)
- Israel Science Foundation (1629/12)
- HHS | NIH | National Institute of Mental Health (R01MH109180)
- Simons Foundation (542997)
- United States - Israel Binational Science Foundation (2014607)
- Pew Charitable Trusts (0)
- Topics
- Life Sciences › Neuroscience › Cognitive Neuroscience › Neural dynamics and brain function
- Physical Sciences › Computer Science › Artificial Intelligence › Neural Networks and Applications
- Life Sciences › Neuroscience › Cognitive Neuroscience › Memory and Neural Mechanisms
- Keywords
- spike-based computation, local learning rules, neural noise, monkey visual cortex, prefrontal cortex
- MeSH terms
- Machine Learning, Action Potentials, Algorithms, Brain, Humans, Models, Neurological, Nerve Net, Neuronal Plasticity, Neurons, Neural Networks, Computer
About these checks
Registry, retraction, Cites and statistics results are computed, not judged, with one exception: a printed reference that no index lists is read once by a model before it counts as a citation error. Claims are extracted by a model and kept only when their quote appears verbatim in the text; each cited source is then checked, with a model’s help, for whether it says what the claim relies on. Those verdicts can be wrong — read the claim’s quote and the cited source before relying on one.
Statistics and arithmetic are recomputed, not judged.
Confidence bands are shown only for fields calibrated on our annotated test set. None is calibrated yet, so no band is shown.
What counts as a claim ›How we measure confidence ›How we check this ›
Are you an author, or do you see a problem with this page? Request a review
How to cite
Cite CoChat for the checks on this page, and the paper for its own findings.
- This page
- CoChat. (2026). Citation check: Learning probabilistic neural representations with randomly connected circuits. https://app.cochat.ai/papers/10.1073/pnas.1912804117
- The paper
- Maoz, O., Tkačik, G., Esteki, M. S., Kiani, R., & Schneidman, E. (2020). Learning probabilistic neural representations with randomly connected circuits. Proceedings of the National Academy of Sciences. https://doi.org/10.1073/pnas.1912804117
Data sources
Bibliographic data: Semantic Scholar, OpenAlex, Crossref.
Contains information from the Semantic Scholar Academic Graph Datasets, made available under the ODC Attribution License (ODC-BY 1.0).
Semantic Scholar’s data is described in: Kinney, R., et al. (2023). The Semantic Scholar Open Data Platform. arXiv:2301.10140.
