

The DOI matches its Crossref record; 149 of the 150 references it cites were found in a registry or an index.
Potential ecological impacts of climate intervention by reflecting sunlight to cool Earth
Open accessAbstract
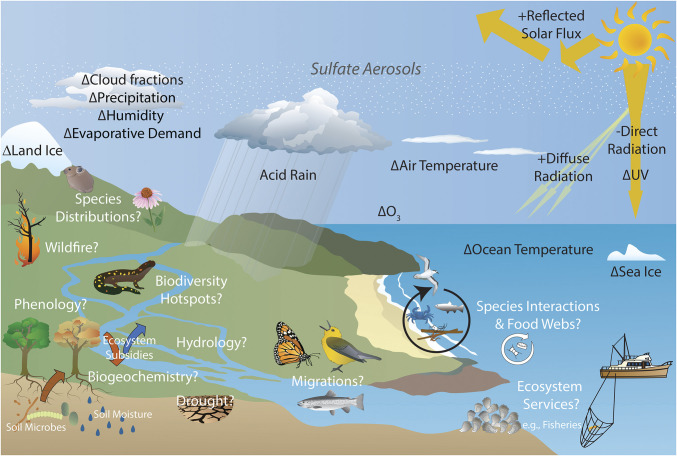
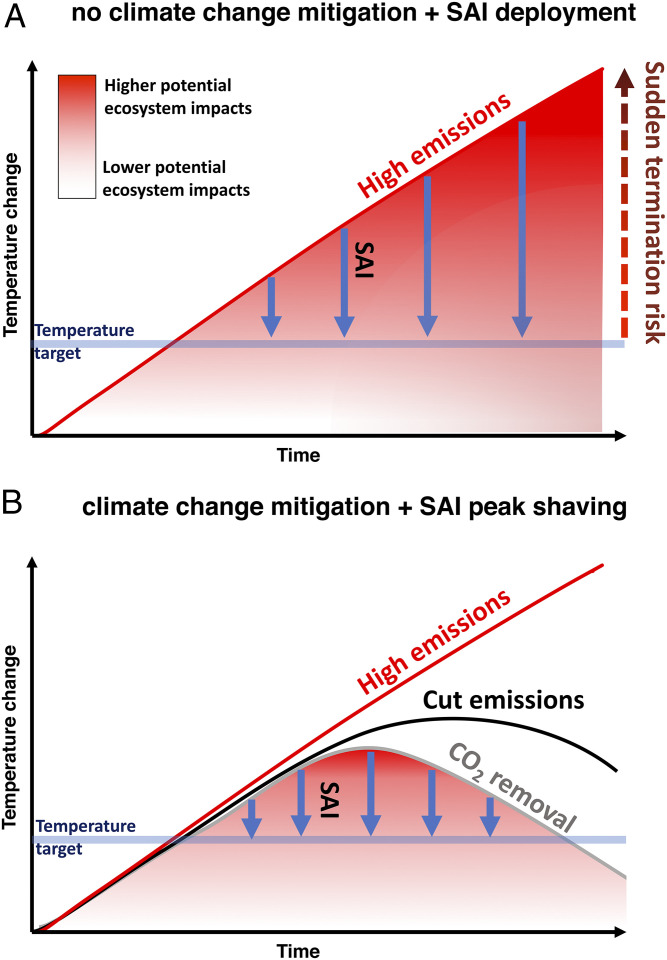
As the effects of anthropogenic climate change become more severe, several approaches for deliberate climate intervention to reduce or stabilize Earth's surface temperature have been proposed. Solar radiation modification (SRM) is one potential approach to partially counteract anthropogenic warming by reflecting a small proportion of the incoming solar radiation to increase Earth's albedo. While climate science research has focused on the predicted climate effects of SRM, almost no studies have investigated the impacts that SRM would have on ecological systems. The impacts and risks posed by SRM would vary by implementation scenario, anthropogenic climate effects, geographic region, and by ecosystem, community, population, and organism. Complex interactions among Earth's climate system and living systems would further affect SRM impacts and risks. We focus here on stratospheric aerosol intervention (SAI), a well-studied and relatively feasible SRM scheme that is likely to have a large impact on Earth's surface temperature. We outline current gaps in knowledge about both helpful and harmful predicted effects of SAI on ecological systems. Desired ecological outcomes might also inform development of future SAI implementation scenarios. In addition to filling these knowledge gaps, increased collaboration between ecologists and climate scientists would identify a common set of SAI research goals and improve the communication about potential SAI impacts and risks with the public. Without this collaboration, forecasts of SAI impacts will overlook potential effects on biodiversity and ecosystem services for humanity.
Overview
The claims and statistics of this paper haven’t been checked yet.
Run the check — free, no account needed. It reads the open-access text and checks the sources it cites.
Integrity signals
Registry
Cites
Statistics
Figures
Verification
Claims the paper makes
The claims and statistics of this paper haven’t been checked yet.
Run the check — free, no account needed. It reads the open-access text and checks the sources it cites.
Claims other papers make about this one
Each is checked against this paper’s own text: does it say what the citing paper says it does?
The source backs part of the claim, not all of it — or backs it for a different population, condition or comparison.
In the citing paper
“Reduced transpirational losses of water by vegetation, resulting from projected cooling by SAI and continuing high atmospheric CO2 concentrations, could leave more ground water available to terrestrial and aquatic ecosystems [61].”
From Environmental consequences of interacting effects of changes in stratospheric ozone, ultraviolet radiation, and climate: UNEP Environmental Effects Assessment Panel, Update 2024 (2025) · cites this paper as [61]
Experimental — accuracy not yet measuredThe cited source says what the claim attributes to it.
In the citing paper
“Higher levels and swifter deployment of SAI would mean greater potential for disastrous impacts (Trisos et al., 2018; Zarnetske et al., 2021).”
From A Fate Worse Than Warming? Stratospheric Aerosol Injection and Global Catastrophic Risk (2021) · cites this paper as Zarnetske et al., 2021
The cited source says what the claim attributes to it.
In the citing paper
“Plant communities could transform their structure, traits, and geographical range, particularly under larger swifter SAI deployments (Zarnetske et al., 2021).”
From A Fate Worse Than Warming? Stratospheric Aerosol Injection and Global Catastrophic Risk (2021) · cites this paper as Zarnetske et al., 2021
The cited source says what the claim attributes to it.
In the citing paper
“There are multiple potential objectives of SAI deployment, ranging from temperature reduction (of different extents), precipitation impact management, to biodiversity conservation (Lee et al., 2020; Zarnetske et al., 2021).”
From A Fate Worse Than Warming? Stratospheric Aerosol Injection and Global Catastrophic Risk (2021) · cites this paper as Zarnetske et al., 2021
Self-check
Percentages, sums and reported differences re-computed from the paper’s own numbers.
The self-check needs the paper’s full text.
Citations
Cites
A biochemical model of photosynthetic CO2 assimilation in leaves of C3 species
Farquhar, G. D., von Caemmerer, S., & Berry, J. A. (1980) · Planta · doi:10.1007/bf00386231 · Cited by 8,796
Ecological and Evolutionary Responses to Recent Climate Change
Parmesan, C. (2006) · Annual Review of Ecology, Evolution, and Systematics · doi:10.1146/annurev.ecolsys.37.091305.110100 · Cited by 8,652
Warming and earlier spring increase western U.S. forest wildfire activity.
Westerling, A. L., Hidalgo, H. G., Cayan, D. R., & Swetnam, T. W. (2006) · Science · doi:10.1126/science.1128834 · Cited by 5,176
Europe-wide reduction in primary productivity caused by the heat and drought in 2003
Ciais, P., Reichstein, M., Viovy, N., Granier, A., Ogée, J., Allard, V., Aubinet, M., Buchmann, N., Bernhofer, C., Carrara, A., et al. (2005) · Nature · doi:10.1038/nature03972 · Cited by 4,153
IPCC (2022) · Cambridge University Press eBooks · doi:10.1017/9781009157940 · Cited by 3,909
Climate-Driven Increases in Global Terrestrial Net Primary Production from 1982 to 1999
Nemani, R., Keeling, C. D., Hashimoto, H., Jolly, W. M., Piper, S. C., Tucker, C. J., Myneni, R. B., & Running, S. W. (2003) · Science · doi:10.1126/science.1082750 · Cited by 3,679
Trajectories of the Earth System in the Anthropocene
Steffen, W., Rockström, J., Richardson, K., Lenton, T. M., Folke, C., Liverman, D., Summerhayes, C. P., Barnosky, A. D., Cornell, S. E., Crucifix, M., et al. (2018) · Proceedings of the National Academy of Sciences · doi:10.1073/pnas.1810141115 · Cited by 3,139
Climate change impacts on marine ecosystems
Doney, S. C., Ruckelshaus, M., Emmett Duffy, J., Barry, J. P., Chan, F., English, C. A., Galindo, H. M., Grebmeier, J. M., Hollowed, A. B., Knowlton, N., et al. (2012) · Annual Review of Marine Science · doi:10.1146/annurev-marine-041911-111611 · Cited by 3,014
Terrestrial Gross Carbon Dioxide Uptake: Global Distribution and Covariation with Climate
Beer, C., Reichstein, M., Tomelleri, E., Ciais, P., Jung, M., Carvalhais, N., Rödenbeck, C., Arain, M. A., Baldocchi, D., Bonan, G. B., et al. (2010) · Science · doi:10.1126/science.1184984 · Cited by 2,841
Research works printed but not linked: 1
- M. I. Budyko, Climate modification techniques. Meteorologiya i Gidrologiya 2, 91–97 (1974).
Cited by
Sorted by citations
Items 101–119 of 119
Sanderson, B. M. (2024) · doi:10.5194/egusphere-2023-2127-ac2
Sanderson, B. M. (2024) · doi:10.5194/egusphere-2023-2127-ac1
Ahmadi, F., & Lackner, M. K. (2024) · Springer eBooks · doi:10.1007/978-1-4614-6431-0_207-1
Interactive Effect of Elevated Temperature and Carbon Dioxide on LAI and NDVI in Wheat Crop
Apoorva, M. S., Nayak, S. H., & Sindhu, D. (2024) · International Journal of Environment and Climate Change · doi:10.9734/ijecc/2024/v14i124645
Tang, A. (2025) · doi:10.1002/9781394204847.ch3
Liao, H., & Zheng, G. (2025) · Journal of Energy and Climate Change · doi:10.3724/j.issn.2097-4981.jecc-2025-0013
Ahmadi, F., & Lackner, M. K. (2025) · Springer eBooks · doi:10.1007/978-3-031-84483-6_207 · Cited by 1
Global and regional thermosteric and dynamic sea level change under stratospheric aerosol injection
Bonou, F., Hounsou‐Gbo, A., Dossa, A. N., Toupe, M. K., Kouakou, M., Kouekam, A., Mitchodigni, T., Sohou, Z., Robock, A. D., Kravitz, B., et al. (2025) · Environmental Research Climate · doi:10.1088/2752-5295/ae15b6 · Cited by 1
Self-citationDreiman, J., & Green, B. P. (2025) · Science and Engineering Ethics · doi:10.1007/s11948-025-00569-6
Maldonado, M. U., Vaz, C. R., Grobbelaar, S. S. S., & Singh, R. (2026) · Environmental Research Climate · doi:10.1088/2752-5295/ae3a09
Dong, C., Connolly, C. J., & Barnes, E. A. (2026) · Journal of Geophysical Research Atmospheres · doi:10.1029/2025jd045560
Energy management strategies for mitigating Arctic amplification using a solar chimney
Liu, Y., Zhou, L., Peng, C., Ming, T., Ahmadi, M. H., Shi, T., Fang, Y., de Richter, R. K., Sherif, S. A., & Zhou, N. (2026) · Solar Energy · doi:10.1016/j.solener.2026.114705
Solar Radiation and Climate Change Research: A Comprehensive Bibliometric Analysis (1991–2025)
Botsalı, A. R. (2026) · Atmosphere · doi:10.3390/atmos17060597
Robust Solar Radiation Modification Strategy for Achieving Temperature Targets
Zheng, G., Wu, J., Zhang, T., & Liao, H. (2026) · Risk Analysis · doi:10.1111/risa.70312
Self-citationClouding the mind? Assessing the suicide impacts of solar radiation management in the United States
Tanaka, S., & Matsubayashi, T. (2026) · Japanese Economic Review · doi:10.1007/s42973-026-00273-5
Visioni, D., Robock, A. D., Duffey, A., Henry, M., Hirasawa, H., Lee, W., Wang, C., Roberts, K., Watanabe, S., Reboita, M. S., et al. (2026) · Geoscientific model development · doi:10.5194/gmd-19-8469-2026
Self-citationMapping justice claims for solar geoengineering
Jinnah, S., Williams, P. A., & McKinnon, C. (2026) · PLOS Climate · doi:10.1371/journal.pclm.0001054
Эбботт, Б. У., Браун, М., Кэри, Д. К., Эрнакович, Д., Фредерик, Д. М., Го, Л., Хугелиус, Г., Ли, Р. М., Loranty, M. M., Макдональд, Р., et al. (2026) · Геоинфо · doi:10.58339/2949-0677-2026-8-2-98-119
Current Status and Perspectives of Solar Geoengineering
Kim, S., Shin, H., Kwon, T., Cho, Y., & Jung, S. P. (2026) · Journal of Korean Society for Atmospheric Environment · doi:10.5572/kosae.2026.42.3.409
Metadata
- Authors
- Zarnetske, P. L., Gurevitch, J., Franklin, J., Groffman, P. M., Harrison, C. S., Hellmann, J. J., Hoffman, F. M., Kothari, S., Robock, A., Tilmes, S., Visioni, D., Wu, J., Xia, L., & Yang, C.-E.
- Affiliations
- Michigan State University (US)
- Stony Brook University (US)
- University of California, Riverside (US)
- The Graduate Center, CUNY (US)
- The University of Texas Rio Grande Valley (US)
- University of Minnesota (US)
- Oak Ridge National Laboratory (US)
- Rutgers, The State University of New Jersey (US)
- NSF National Center for Atmospheric Research (US)
- Cornell University (US)
- University of Hong Kong (HK)
- University of Tennessee at Knoxville (US)
- Corresponding author
- Franklin, Janet
- ORCID
- Venue
- Proceedings of the National Academy of Sciences
- Publisher
- National Academy of Sciences
- Published
- 2021-04-05
- Volume
- 118
- Issue
- 15
- ISSN
- 0027-8424 (ISSN-L)
- 1091-6490
- PMC
- PMC8053992
- OpenAlex
- W3145236039
- Cited by
- 119
- References
- 150
- Citations by year
- 2026: 12 · 2025: 20 · 2024: 24 · 2023: 28 · 2022: 21 · 2021: 12
- FWCI
- 8.71
- Type
- journal article
- Language
- en
- Open access
- hybrid
- doi.org
- Licence
- Locations
- Proceedings of the National Academy of Sciences (publishedVersion, cc-by-nc-nd)
- PubMed Central (publishedVersion, cc-by-nc-nd)
- PubMed (publishedVersion)
- CUNY Academic Works (City University of New York) (submittedVersion, cc-by-nc-nd)
- Civil War Book Review (submittedVersion)
- ScholarWorks @ UTRGV (The University of Texas Rio Grande Valley) (submittedVersion, cc-by-nc-nd)
- eScholarship (California Digital Library) (submittedVersion, cc-by-nc-nd)
- OSTI OAI (U.S. Department of Energy Office of Scientific and Technical Information) (submittedVersion)
- Funders
- National Science Foundation (1937619, 1937699, 1617844, 1853697)
- U.S. Department of Energy (SC-23 - RUBISCO SFA, TES SFA)
- Topics
- Physical Sciences › Environmental Science › Global and Planetary Change › Climate Change and Geoengineering
- Physical Sciences › Environmental Science › Global and Planetary Change › Atmospheric aerosols and clouds
- Physical Sciences › Environmental Science › Global and Planetary Change › Climate Change and Environmental Impact
- Keywords
- solar geoengineering, stratospheric aerosol injection, geoengineering, ecological impacts, climate intervention, Earth albedo, anthropogenic climate change, biodiversity, ecosystem services, ecological risk, climate-ecosystem interactions
About these checks
Registry, retraction, Cites and statistics results are computed, not judged, with one exception: a printed reference that no index lists is read once by a model before it counts as a citation error. Claims are extracted by a model and kept only when their quote appears verbatim in the text; each cited source is then checked, with a model’s help, for whether it says what the claim relies on. Those verdicts can be wrong — read the claim’s quote and the cited source before relying on one.
Statistics and arithmetic are recomputed, not judged.
Confidence bands are shown only for fields calibrated on our annotated test set. None is calibrated yet, so no band is shown.
What counts as a claim ›How we measure confidence ›How we check this ›
Are you an author, or do you see a problem with this page? Request a review
