

The DOI matches its Crossref record; 47 of the 47 references it cites were found in a registry or an index.
Selective engram coreactivation in idling brain inspires implicit learning
Open accessPublished version of a preprint
Abstract
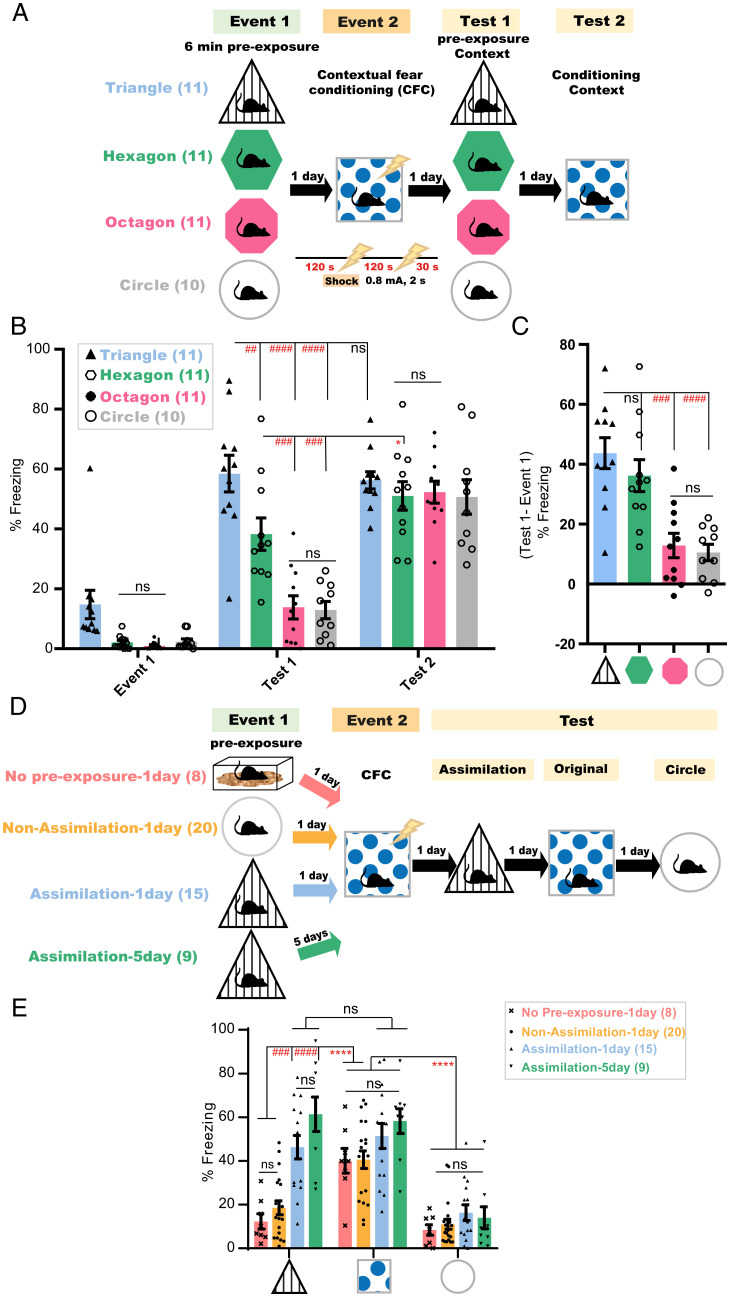
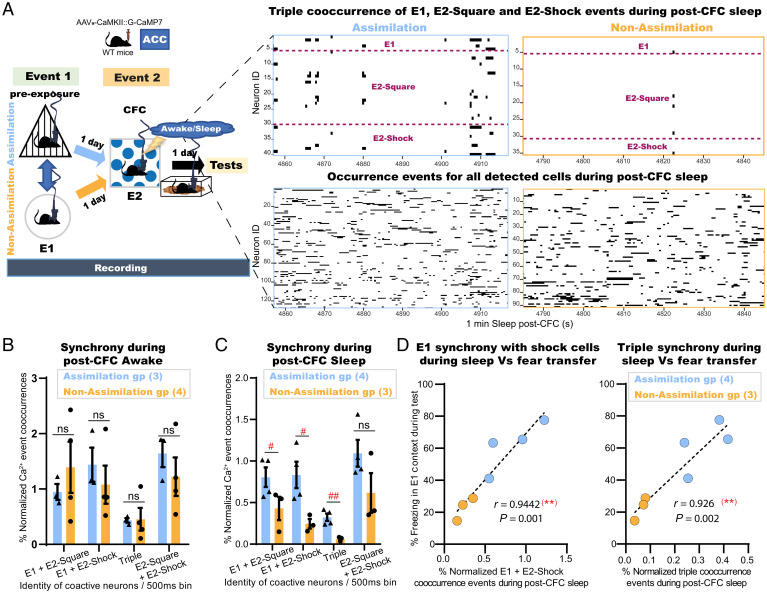
Passive priming of prior knowledge to assimilate ongoing experiences underlies advanced cognitive processing. However, the necessary neural dynamics of memory assimilation remains elusive. Uninstructed brain could also show boosted creativity, particularly after idling states, yet it remains unclear whether the idling brain can spontaneously spark relevant knowledge assimilations. We established a paradigm that links/separates context-dependent memories according to geometrical similarities. Mice exploring one of four contexts 1 d before undergoing contextual fear conditioning in a square context showed a gradual fear transfer to preexposed geometrically relevant contexts the next day, but not after 15 min. Anterior cingulate cortex neurons representing relevant, rather than distinct, memories were significantly coreactivated during postconditioning sleep only, before their selective integration the next day during testing. Disrupting sleep coreactivations prevented assimilation while preserving recent memory consolidation. Thus, assimilating pertinent memories during sleep through coreactivation of their respective engrams represents the neural underpinnings of sleep-triggered implicit cortical learning.
Overview
The claims and statistics of this paper haven’t been checked yet.
Run the check — free, no account needed. It reads the open-access text and checks the sources it cites.
Integrity signals
Registry
Cites
Statistics
Figures



Verification
Claims the paper makes
The claims and statistics of this paper haven’t been checked yet.
Run the check — free, no account needed. It reads the open-access text and checks the sources it cites.
Claims other papers make about this one
Each is checked against this paper’s own text: does it say what the citing paper says it does?
The cited source doesn’t support the claim as written.
In the citing paper
“Similar to hippocampal replay, extrahippocampal reactivations have also been shown to positively correlate 65 and causally contribute to sleep-dependent memory consolidation.”
From Sleep—A brain-state serving systems memory consolidation (2023) · cites this paper as [97]
Checked by a reasoning model — may be wrong.
Experimental — accuracy not yet measuredThe cited source says what the claim attributes to it.
In the citing paper
“Moreover, generalization of a specific contextual fear memory to a similar context, but not consolidation of individual contexts, critically depended on the co-reactivation of engram ensembles for both context experiences during sleep 97 (Figure 1).”
From Sleep—A brain-state serving systems memory consolidation (2023) · cites this paper as [97]
Self-check
Percentages, sums and reported differences re-computed from the paper’s own numbers.
The self-check needs the paper’s full text.
Citations
Cites
Reactivation of hippocampal ensemble memories during sleep
Wilson, M. A., & McNaughton, B. L. (1994) · Science · doi:10.1126/science.8036517 · Cited by 3,118
Schemas and Memory Consolidation.
Tse, D., Langston, R. F., Kakeyama, M., Bethus, I., Spooner, P. A., Wood, E. R., Witter, M. P., & Morris, R. G. M. (2007) · Science · doi:10.1126/science.1135935 · Cited by 1,244
Long-term dynamics of CA1 hippocampal place codes
Ziv, Y., Burns, L. D., Cocker, E. D., Hamel, E. O., Ghosh, K. K., Kitch, L. J., Gamal, A. E., & Schnitzer, M. J. (2013) · Nature Neuroscience · doi:10.1038/nn.3329 · Cited by 1,155
Engrams and circuits crucial for systems consolidation of a memory
Kitamura, T., Ogawa, S. K., Roy, D. S., Okuyama, T., Morrissey, M. D., Smith, L. M., Redondo, R. L., & Tonegawa, S. (2017) · Science · doi:10.1126/science.aam6808 · Cited by 1,104
Wagner, U., Gais, S., Haider, H., Verleger, R., & Born, J. (2004) · Nature · doi:10.1038/nature02223 · Cited by 1,012
Mattis, J., Tye, K. M., Ferenczi, E. A., Ramakrishnan, C., O'Shea, D. J., Prakash, R., Gunaydin, L. A., Hyun, M., Fenno, L. E., Gradinaru, V., et al. (2012) · Nature Methods · doi:10.1038/nmeth.1808 · Cited by 780
Hippocampal replay is not a simple function of experience
Gupta, A. S., van der Meer, M. A. A., Touretzky, D. S., & Redish, A. D. (2010) · Neuron · doi:10.1016/j.neuron.2010.01.034 · Cited by 733
Attractor Dynamics in the Hippocampal Representation of the Local Environment
Wills, T. J., Lever, C., Cacucci, F., Burgess, N., & O'Keefe, J. (2005) · Science · doi:10.1126/science.1108905 · Cited by 655
Schema-dependent gene activation and memory encoding in neocortex
Tse, D., Takeuchi, T., Kakeyama, M., Kajii, Y., Okuno, H., Tohyama, C., Bito, H., & Morris, R. G. M. (2011) · Science · doi:10.1126/science.1205274 · Cited by 618
Zeithamova, D., Dominick, A. L., & Preston, A. R. (2012) · Neuron · doi:10.1016/j.neuron.2012.05.010 · Cited by 529
Cited by
Sleep—A brain-state serving systems memory consolidation
Brodt, S., Inostroza, M., Niethard, N., & Born, J. (2023) · Neuron · doi:10.1016/j.neuron.2023.03.005 · Cited by 343
Metadata
- Authors
- Aly, M. H., Abdou, K., Okubo-Suzuki, R., Nomoto, M., & Inokuchi, K.
- Affiliations
- British University in Egypt (EG)
- Cairo University (EG)
- Japan Science and Technology Agency (JP)
- Corresponding author
- Inokuchi, Kaoru
- Venue
- Proceedings of the National Academy of Sciences
- Publisher
- National Academy of Sciences
- Published
- 2022-08
- Volume
- 119
- Issue
- 32
- Pages
- e2201578119-e2201578119
- ISSN
- 0027-8424 (ISSN-L)
- 1091-6490
- PMC
- PMC9371673
- OpenAlex
- W4289262419
- Semantic Scholar
- cf5bb864c06e56026eb0795b733eb6b7aeb31021
- Cited by
- 39
- References
- 47
- Citations by year
- 2026: 7 · 2025: 10 · 2024: 8 · 2023: 7 · 2022: 6
- FWCI
- 3.99
- Type
- journal article
- Language
- en
- Open access
- hybrid
- doi.org
- Licence
- Locations
- Proceedings of the National Academy of Sciences (publishedVersion, cc-by-nc-nd)
- bioRxiv (Cold Spring Harbor Laboratory) (acceptedVersion)
- PubMed Central (publishedVersion, cc-by-nc-nd)
- PubMed (publishedVersion)
- University of Toyama Repository for Academic Information (University of Toyama) (submittedVersion, cc-by-nc-nd)
- Funders
- MEXT | Japan Society for the Promotion of Science (JP18H05213, JP19K16892, JP20H03554, JP17K19445)
- MEXT | JST | Core Research for Evolutional Science and Technology (JPMJCR13W1)
- MEXT Grant-in-Aid for Scientific Research on Innovative Areas "Memory dynamism" (JP25115002)
- Topics
- Life Sciences › Neuroscience › Cognitive Neuroscience › Memory and Neural Mechanisms
- Life Sciences › Neuroscience › Cognitive Neuroscience › Sleep and Wakefulness Research
- Life Sciences › Neuroscience › Cognitive Neuroscience › Memory Processes and Influences
- Keywords
- implicit learning, sleep-dependent memory consolidation, contextual fear conditioning, anterior cingulate cortex, memory reconsolidation, contextual memory
- MeSH terms
- Memory Consolidation, Animals, Brain, Fear, Gyrus Cinguli, Learning, Memory, Sleep, Mice
About these checks
Registry, retraction, Cites and statistics results are computed, not judged, with one exception: a printed reference that no index lists is read once by a model before it counts as a citation error. Claims are extracted by a model and kept only when their quote appears verbatim in the text; each cited source is then checked, with a model’s help, for whether it says what the claim relies on. Those verdicts can be wrong — read the claim’s quote and the cited source before relying on one.
Statistics and arithmetic are recomputed, not judged.
Confidence bands are shown only for fields calibrated on our annotated test set. None is calibrated yet, so no band is shown.
What counts as a claim ›How we measure confidence ›How we check this ›
Are you an author, or do you see a problem with this page? Request a review
How to cite
Cite CoChat for the checks on this page, and the paper for its own findings.
- This page
- CoChat. (2026). Citation check: Selective engram coreactivation in idling brain inspires implicit learning. https://app.cochat.ai/papers/10.1073/pnas.2201578119
- The paper
- Aly, M. H., Abdou, K., Okubo-Suzuki, R., Nomoto, M., & Inokuchi, K. (2022). Selective engram coreactivation in idling brain inspires implicit learning. Proceedings of the National Academy of Sciences. https://doi.org/10.1073/pnas.2201578119
Data sources
Bibliographic data: Semantic Scholar, OpenAlex, Crossref.
Contains information from the Semantic Scholar Academic Graph Datasets, made available under the ODC Attribution License (ODC-BY 1.0).
Semantic Scholar’s data is described in: Kinney, R., et al. (2023). The Semantic Scholar Open Data Platform. arXiv:2301.10140.
