Cited by 17Bartonella species infections researchBacillus and Francisella bacterial researchBurkholderia infections and melioidosis

The DOI matches its Crossref record; 6 of the 6 references it cites were found in a registry or an index.

Identification of the Bartonella autotransporter CFA as a protective antigen and hypervariable target of neutralizing antibodies in mice

Open access
Siewert, Lena K., Korotaev, Aleksandr, Sedzicki, Jaroslaw, Fromm, Katja, Pinschewer, Daniel D., Dehio, Christoph·2022·Proceedings of the National Academy of Sciences

Published version of a preprint

Abstract

The bacterial genus Bartonella comprises numerous emerging pathogens that cause a broad spectrum of disease manifestations in humans. The targets and mechanisms of the anti- Bartonella immune defense are ill-defined and bacterial immune evasion strategies remain elusive. We found that experimentally infected mice resolved Bartonella infection by mounting antibody responses that neutralized the bacteria, preventing their attachment to erythrocytes and suppressing bacteremia independent of complement or Fc receptors. Bartonella -neutralizing antibody responses were rapidly induced and depended on CD40 signaling but not on affinity maturation. We cloned neutralizing monoclonal antibodies (mAbs) and by mass spectrometry identified the bacterial autotransporter CFA (CAMP-like factor autotransporter) as a neutralizing antibody target. Vaccination against CFA suppressed Bartonella bacteremia, validating CFA as a protective antigen. We mapped Bartonella -neutralizing mAb binding to a domain in CFA that we found is hypervariable in both human and mouse pathogenic strains, indicating mutational antibody evasion at the Bartonella subspecies level. These insights into Bartonella immunity and immune evasion provide a conceptual framework for vaccine development, identifying important challenges in this endeavor.

Overview

The claims and statistics of this paper haven’t been checked yet.

Run the check — free, no account needed. It reads the open-access text and checks the sources it cites.

A few free checks a day · papers already verified open instantly · results are public

Integrity signals

Registry

Crossref · 10.1073/pnas.2202059119

Cites

6 of 6 references verified0 citation errors · 0 not checkable

Statistics

Figures

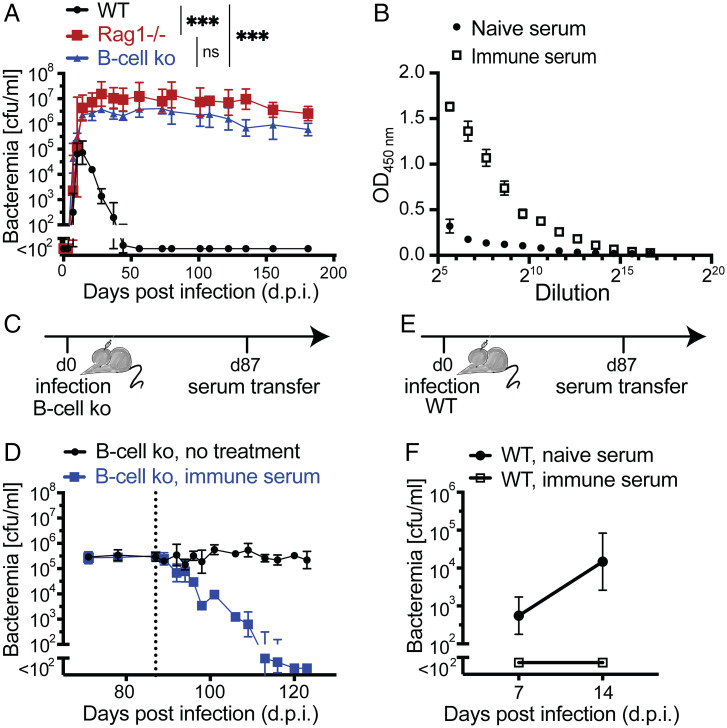
Fig. 1. B cell–dependent clearance of Bartonella bacteremia and passive antibody therapy. (A) Mice were infected i.d. with 107 cfu of B. taylorii IBS296, and bacteremia titers (cfu/mL blood) are shown for C57BL/6 WT, Rag1−/−, and B cell ko mice up to 180 d.p.i. Symbols show the mean ± SD of at least four mice. (B) ELISAs were performed on plates coated with a B. taylorii IBS296 outer-membrane protein preparation. A pool of immune serum from 10 mice infected with B. taylorii for at least 45 d was compared with naïve serum. Symbols represent the mean ± SD of three technical replicates. (C and E) Schematic of the passive immunization experiments by serum transfer reported in the subsequent panels. C describes the experiment in D; E describes the experiment in F. (D) We infected B cell ko mice i.d. with 107 cfu of B. taylorii IBS296 and 87 d later, after establishment of persistent bacteremia, treated them intravenously with 100 µL of either naïve or immune serum raised against B. taylorii IBS296 as described in B. Bacteremia was followed over time; the dashed line indicates the time point of serum transfer (day 87 post infection). Symbols represent the mean ± SD of three mice. (F) WT mice were infected as for the experiment in D and were treated intraveneously with 100 µL of either naïve or B. taylorii IBS296 immune serum on day 3. Bacteremia was determined on day 14 and day 21 post infection. Symbols represent the mean ± SD of six mice. A, B, and D show representative data and F shows pooled data from two independent experiments. Statistical analysis was performed using two-way ANOVA, and P values are reported for comparisons evidencing statistically significant differences. ns, P > 0.05; ***P ≤ 0.001.
Fig. 1. B cell–dependent clearance of Bartonella bacteremia and passive antibody therapy. (A) Mice were infected i.d. with 107 cfu of B. taylorii IBS296, and bacteremia titers (cfu/mL blood) are shown for C57BL/6 WT, Rag1−/−, and B cell ko mice up to 180 d.p.i. Symbols show the mean ± SD of at least four mice. (B) ELISAs were performed on plates coated with a B. taylorii IBS296 outer-membrane protein preparation. A pool of immune serum from 10 mice infected with B. taylorii for at least 45 d was compared with naïve serum. Symbols represent the mean ± SD of three technical replicates. (C and E) Schematic of the passive immunization experiments by serum transfer reported in the subsequent panels. C describes the experiment in D; E describes the experiment in F. (D) We infected B cell ko mice i.d. with 107 cfu of B. taylorii IBS296 and 87 d later, after establishment of persistent bacteremia, treated them intravenously with 100 µL of either naïve or immune serum raised against B. taylorii IBS296 as described in B. Bacteremia was followed over time; the dashed line indicates the time point of serum transfer (day 87 post infection). Symbols represent the mean ± SD of three mice. (F) WT mice were infected as for the experiment in D and were treated intraveneously with 100 µL of either naïve or B. taylorii IBS296 immune serum on day 3. Bacteremia was determined on day 14 and day 21 post infection. Symbols represent the mean ± SD of six mice. A, B, and D show representative data and F shows pooled data from two independent experiments. Statistical analysis was performed using two-way ANOVA, and P values are reported for comparisons evidencing statistically significant differences. ns, P > 0.05; ***P ≤ 0.001.CC BY-NC-ND · PubMed Central
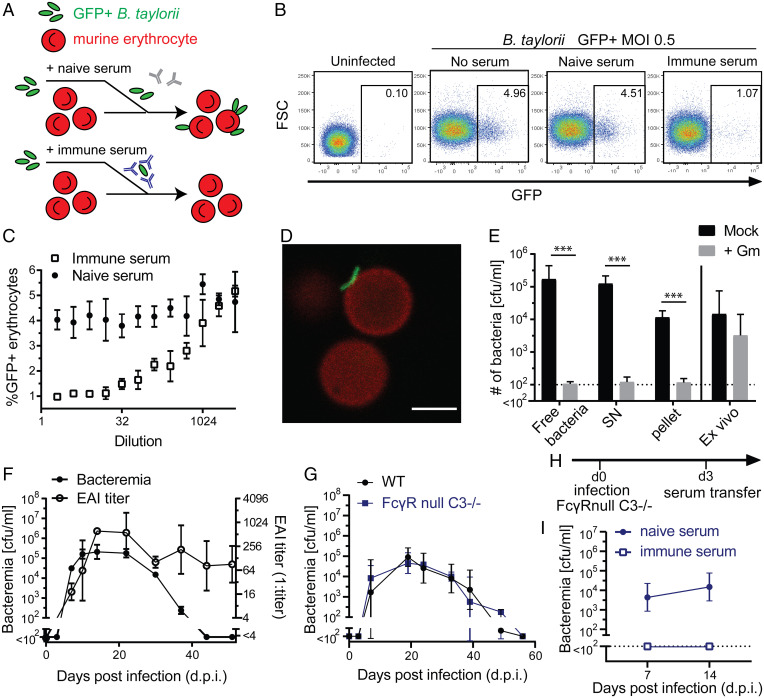
Fig. 2. Immune sera interfere with Bartonella adhesion to erythrocytes while complement and Fcγ-receptors are dispensable for bacterial control in mice. (A) Schematic of the EAI assay. (B) Exemplary flow cytometry pseudocolor plots of erythrocytes from the EAI assay: control erythrocytes without addition of Bartonella (uninfected) or erythrocytes incubated with GFP-expressing bacteria that have been mock-incubated without serum (no serum) or have been incubated with either naïve (naïve serum) or Bartonella-immune serum (immune serum). FSC = forward scatter. (C) The above EAI assay was conducted using serially diluted serum. The attachment rate in the presence of serially diluted either naïve or immune serum is reported as % GFP+ erythrocytes. (D) Confocal images of murine erythrocytes (stained with anti-Ter119 antibody; red) and incubated with GFP-expressing B. taylorii IBS296 (MOI 0.5; green). (Scale bar, 3 µm.) (E) Gentamicin (Gm) protection assays were performed with B. taylorii prepared and obtained as follows: Bacteria were either used directly from the plate (free bacteria) or incubated with erythrocytes (MOI 0.5) in vitro for 24 h followed by centrifugation to pellet erythrocytes. The resulting supernatant (SN) and pellet were assayed individually. For comparison, erythrocytes were prepared from mice infected with 107 cfu of B. taylorii IBS296 14 d before (ex vivo). (F) Bacteremia and EAI antibody titers were monitored longitudinally in WT C57BL/6 mice infected i.d. with 107 cfu of B. taylorii IBS296. (G) Bacteremia titers shown for WT compared with FcγRnull x C3−/− mice. (H) Schematic of the serum transfer passive immunization experiments in I. (I) We infected FcγRnull x C3−/− mice i.d. with 107 cfu of B. taylorii IBS296 and 3 d later treated them with 100 µL of either B. taylorii IBS296–immune (>45 d) or naïve serum. Bacteremia was determined on day 7 and day 14 post infection. (C and E) Symbols show mean and SD of technical replicates; representative results are shown from one out of three independent experiments. (D) One representative image from 50,000 erythrocytes analyzed by fluorescence microscopy. Symbols in F represent the mean of three mice and in G the mean of four mice per group; both are representative of two independent experiments. Pooled data from two independent experiments with a total of six mice are shown in I. Error bars indicate SD. Statistical analysis in E was performed using unpaired Student’s t test and statistically significant differences are indicated as ***P ≤ 0.001. See also SI Appendix, Fig. S1.
Fig. 2. Immune sera interfere with Bartonella adhesion to erythrocytes while complement and Fcγ-receptors are dispensable for bacterial control in mice. (A) Schematic of the EAI assay. (B) Exemplary flow cytometry pseudocolor plots of erythrocytes from the EAI assay: control erythrocytes without addition of Bartonella (uninfected) or erythrocytes incubated with GFP-expressing bacteria that have been mock-incubated without serum (no serum) or have been incubated with either naïve (naïve serum) or Bartonella-immune serum (immune serum). FSC = forward scatter. (C) The above EAI assay was conducted using serially diluted serum. The attachment rate in the presence of serially diluted either naïve or immune serum is reported as % GFP+ erythrocytes. (D) Confocal images of murine erythrocytes (stained with anti-Ter119 antibody; red) and incubated with GFP-expressing B. taylorii IBS296 (MOI 0.5; green). (Scale bar, 3 µm.) (E) Gentamicin (Gm) protection assays were performed with B. taylorii prepared and obtained as follows: Bacteria were either used directly from the plate (free bacteria) or incubated with erythrocytes (MOI 0.5) in vitro for 24 h followed by centrifugation to pellet erythrocytes. The resulting supernatant (SN) and pellet were assayed individually. For comparison, erythrocytes were prepared from mice infected with 107 cfu of B. taylorii IBS296 14 d before (ex vivo). (F) Bacteremia and EAI antibody titers were monitored longitudinally in WT C57BL/6 mice infected i.d. with 107 cfu of B. taylorii IBS296. (G) Bacteremia titers shown for WT compared with FcγRnull x C3−/− mice. (H) Schematic of the serum transfer passive immunization experiments in I. (I) We infected FcγRnull x C3−/− mice i.d. with 107 cfu of B. taylorii IBS296 and 3 d later treated them with 100 µL of either B. taylorii IBS296–immune (>45 d) or naïve serum. Bacteremia was determined on day 7 and day 14 post infection. (C and E) Symbols show mean and SD of technical replicates; representative results are shown from one out of three independent experiments. (D) One representative image from 50,000 erythrocytes analyzed by fluorescence microscopy. Symbols in F represent the mean of three mice and in G the mean of four mice per group; both are representative of two independent experiments. Pooled data from two independent experiments with a total of six mice are shown in I. Error bars indicate SD. Statistical analysis in E was performed using unpaired Student’s t test and statistically significant differences are indicated as ***P ≤ 0.001. See also SI Appendix, Fig. S1.CC BY-NC-ND · PubMed Central
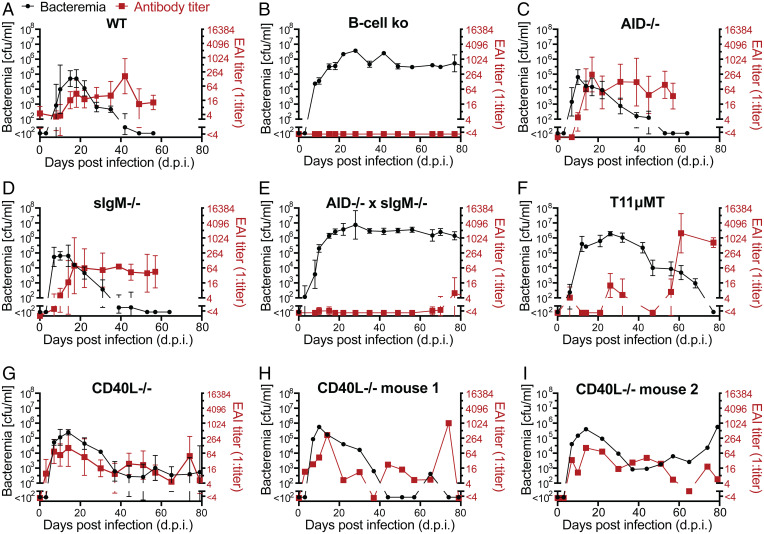
Fig. 3. Bartonella clearance depends on antibody specificity and CD40L, but occurs independent of antibody affinity maturation and isotype class switching. (A–G) We infected groups of mice of the indicated genotypes with 107 cfu of B. taylorii IBS296 and followed bacteremia as well as EAI titers over time. (H and I) These parameters are for two individual mice of the experiment shown in G. Data of additional individual CD40L−/− mice are displayed in SI Appendix, Fig. S2. Representative data from two independent experiments are reported as mean ± SD. Symbols in A and D–F show the mean of four mice and symbols in B report the mean of three mice; symbols in C and G display the mean of five mice per group.
Fig. 3. Bartonella clearance depends on antibody specificity and CD40L, but occurs independent of antibody affinity maturation and isotype class switching. (A–G) We infected groups of mice of the indicated genotypes with 107 cfu of B. taylorii IBS296 and followed bacteremia as well as EAI titers over time. (H and I) These parameters are for two individual mice of the experiment shown in G. Data of additional individual CD40L−/− mice are displayed in SI Appendix, Fig. S2. Representative data from two independent experiments are reported as mean ± SD. Symbols in A and D–F show the mean of four mice and symbols in B report the mean of three mice; symbols in C and G display the mean of five mice per group.CC BY-NC-ND · PubMed Central
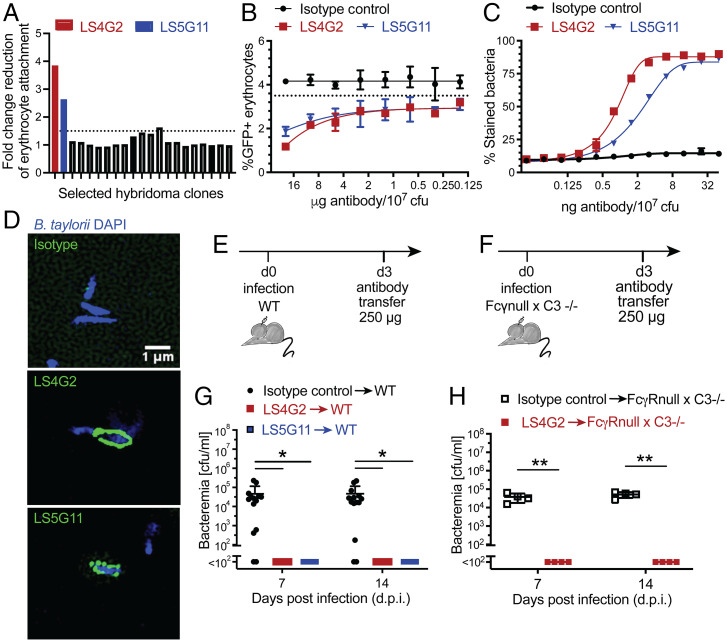
Fig. 4. Cloning and characterization of protective mAbs against B. taylorii IBS296. (A) Supernatants collected from 20 individual hybridoma clones in our screen were analyzed using EAI assays. The potency of each clone is expressed as fold-change reduction of erythrocyte attachment when compared with mock (medium only). The two most potent clones (LS4G2 and LS5G11) are highlighted in red and blue, respectively. (B) The EAI potency of purified LS4G2 (red) and LS5G11 (blue) in side-by-side comparison with an isotype control antibody. (C) B. taylorii IBS296 surface staining by LS4G2 (red), LS5G11 (blue), and an isotype control antibody was quantified by flow cytometry. (D) Surface labeling of B. taylorii IBS296 (DAPI; blue) upon incubation with LS4G2, LS5G11, or an isotype control antibody (all in green) was visualized by structured illumination microscopy. (E–H) Schematic of passive immunization antibody transfer experiments conducted in F (schematic in E) and H (schematic in G): WT (F) and FcγR null x C3−/− mice (H) were infected i.d. with 107 cfu of B. taylorii IBS296 and 3 d later were treated with 250 µg of the indicated antibodies intravenously. Bacteremia was determined on day 7 and on day 14 post infection. (B–D) One representative dataset from two independent experiments is shown. Each experiment was performed in technical triplicates. (F) Pooled data from three independent experiments are reported. Symbols in F and H represent individual mice (n = 10 per group in F; n = 4 per group in H). Statistical analysis was performed by unpaired Student’s t tests; *P ≤ 0.05, **P ≤ 0.01. Error bars show SD. See SI Appendix, Fig. S3 for related data.
Fig. 4. Cloning and characterization of protective mAbs against B. taylorii IBS296. (A) Supernatants collected from 20 individual hybridoma clones in our screen were analyzed using EAI assays. The potency of each clone is expressed as fold-change reduction of erythrocyte attachment when compared with mock (medium only). The two most potent clones (LS4G2 and LS5G11) are highlighted in red and blue, respectively. (B) The EAI potency of purified LS4G2 (red) and LS5G11 (blue) in side-by-side comparison with an isotype control antibody. (C) B. taylorii IBS296 surface staining by LS4G2 (red), LS5G11 (blue), and an isotype control antibody was quantified by flow cytometry. (D) Surface labeling of B. taylorii IBS296 (DAPI; blue) upon incubation with LS4G2, LS5G11, or an isotype control antibody (all in green) was visualized by structured illumination microscopy. (E–H) Schematic of passive immunization antibody transfer experiments conducted in F (schematic in E) and H (schematic in G): WT (F) and FcγR null x C3−/− mice (H) were infected i.d. with 107 cfu of B. taylorii IBS296 and 3 d later were treated with 250 µg of the indicated antibodies intravenously. Bacteremia was determined on day 7 and on day 14 post infection. (B–D) One representative dataset from two independent experiments is shown. Each experiment was performed in technical triplicates. (F) Pooled data from three independent experiments are reported. Symbols in F and H represent individual mice (n = 10 per group in F; n = 4 per group in H). Statistical analysis was performed by unpaired Student’s t tests; *P ≤ 0.05, **P ≤ 0.01. Error bars show SD. See SI Appendix, Fig. S3 for related data.CC BY-NC-ND · PubMed Central
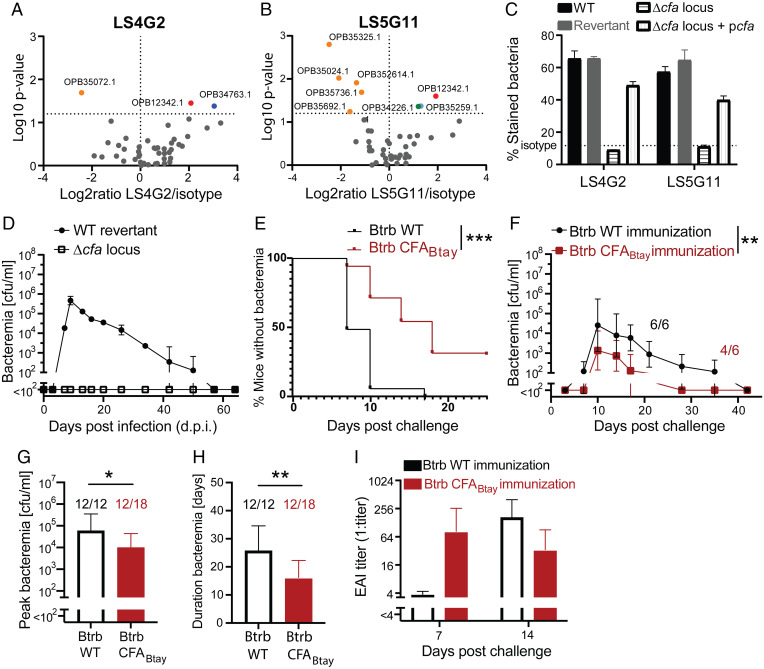
Fig. 5. B. taylorii autotransporter CFA is a target of protective antibodies. (A and B) Volcano plots of proteins identified by mass spectrometry after pull-down with either LS4G2 (A) or LS5G11 (B). OPB12342 denominates the gene product of cfa. The second LS4G2 hit OPB34763.1 could not be confirmed in a repeat experiment and hence was not pursued further. (C) To validate CFA as a molecular target of the LS4G2 and LS5G11 mAbs, we stained the following versions of B. taylorii IBS296 and determined surface-bound antibody by flow cytometry: 1) the parental WT bacterium, 2) the cfa locus ko mutant (Δcfa locus), 3) the corresponding WT “revertant” strain, and 4) the cfa locus ko strain complemented by the expression of cfa from plasmid (Δcfa locus + pcfa). Note that the WT revertant and the Δcfa locus ko mutant are isogenic strains, which are progeny of the same bacterial mutagenesis intermediate but represent the result of independent recombination events in different homology regions, both leading to the deletion of a transiently integrated mutagenesis plasmid. Symbols represent the mean ± SD of three technical replicates. (D) We infected WT C57BL/6 mice i.d. with 107 cfu of either WT revertant or the Δcfa locus deletion mutant of B. taylorii IBS296 and monitored bacteremia over time. Symbols represent three mice per group, each infected with an independent clone of deletion mutant or revertant. (E–I) We immunized C57BL/6 WT mice i.d. either with 107 cfu of WT B. tribocorum (Btrb WT) or with the same dose of an isogenic strain expressing CFA of B. taylorii IBS296 (Btrb CFABtay). Six weeks later, both groups of mice were challenged with B. taylorii IBS296. (E) The percentage of abacteremic mice as a function of time. Combined data from three experiments with three to six mice per group each. (F) Bacterial loads in blood are selectively reported only for bacteremic animals (6/6 Btrb WT-immunized mice; 4/6 Btrb CFABtay-immunized mice) from one out of three experiments. (G and H) Peak bacteremia (G) and duration of bacteremia (H) for bacteremic animals (12/12 Btrb WT-immunized mice; 12/18 Btrb CFABtay-immunized mice). Combined data from three independent experiments. (I) EAI titers of the animals in F were determined on day 7 and day 14 after B. taylorii challenge. (A–D) Representative data from two independent experiments are shown. For statistical analysis, we used the log-rank test (E), two-way ANOVA (F), and unpaired Student’s t test (G and H); *P ≤ 0.05, **P ≤ 0.01, ***P ≤ 0.001. Data in C, D, F, and I are reported as mean ± SD; mean ± SEM is shown in F.
Fig. 5. B. taylorii autotransporter CFA is a target of protective antibodies. (A and B) Volcano plots of proteins identified by mass spectrometry after pull-down with either LS4G2 (A) or LS5G11 (B). OPB12342 denominates the gene product of cfa. The second LS4G2 hit OPB34763.1 could not be confirmed in a repeat experiment and hence was not pursued further. (C) To validate CFA as a molecular target of the LS4G2 and LS5G11 mAbs, we stained the following versions of B. taylorii IBS296 and determined surface-bound antibody by flow cytometry: 1) the parental WT bacterium, 2) the cfa locus ko mutant (Δcfa locus), 3) the corresponding WT “revertant” strain, and 4) the cfa locus ko strain complemented by the expression of cfa from plasmid (Δcfa locus + pcfa). Note that the WT revertant and the Δcfa locus ko mutant are isogenic strains, which are progeny of the same bacterial mutagenesis intermediate but represent the result of independent recombination events in different homology regions, both leading to the deletion of a transiently integrated mutagenesis plasmid. Symbols represent the mean ± SD of three technical replicates. (D) We infected WT C57BL/6 mice i.d. with 107 cfu of either WT revertant or the Δcfa locus deletion mutant of B. taylorii IBS296 and monitored bacteremia over time. Symbols represent three mice per group, each infected with an independent clone of deletion mutant or revertant. (E–I) We immunized C57BL/6 WT mice i.d. either with 107 cfu of WT B. tribocorum (Btrb WT) or with the same dose of an isogenic strain expressing CFA of B. taylorii IBS296 (Btrb CFABtay). Six weeks later, both groups of mice were challenged with B. taylorii IBS296. (E) The percentage of abacteremic mice as a function of time. Combined data from three experiments with three to six mice per group each. (F) Bacterial loads in blood are selectively reported only for bacteremic animals (6/6 Btrb WT-immunized mice; 4/6 Btrb CFABtay-immunized mice) from one out of three experiments. (G and H) Peak bacteremia (G) and duration of bacteremia (H) for bacteremic animals (12/12 Btrb WT-immunized mice; 12/18 Btrb CFABtay-immunized mice). Combined data from three independent experiments. (I) EAI titers of the animals in F were determined on day 7 and day 14 after B. taylorii challenge. (A–D) Representative data from two independent experiments are shown. For statistical analysis, we used the log-rank test (E), two-way ANOVA (F), and unpaired Student’s t test (G and H); *P ≤ 0.05, **P ≤ 0.01, ***P ≤ 0.001. Data in C, D, F, and I are reported as mean ± SD; mean ± SEM is shown in F.CC BY-NC-ND · PubMed Central
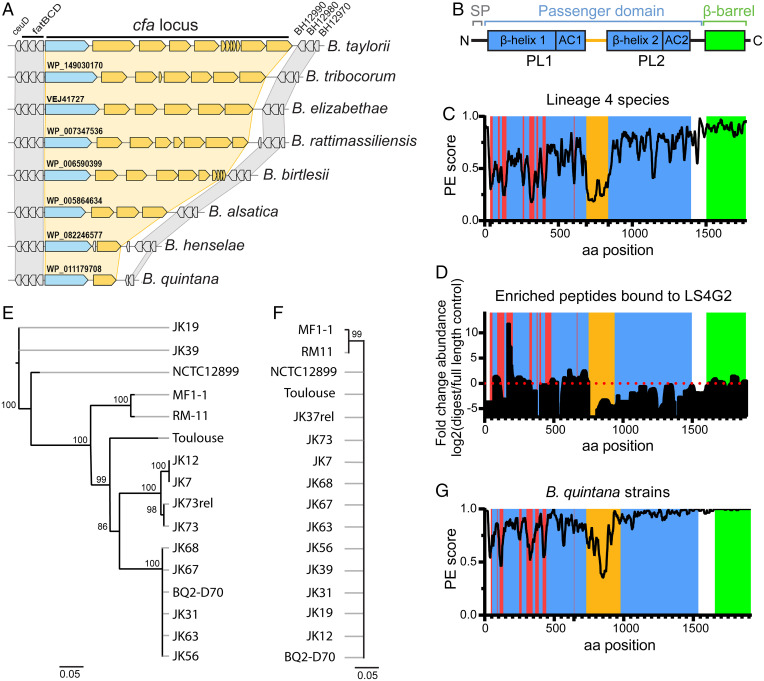
Fig. 6. High variation of CFA on the Bartonella subspecies level suggests immune evasion from antibody selection pressure. (A) Gene synteny analysis of the cfa locus and flanking regions in the indicated Bartonella species. Flanking housekeeping genes are shown in gray, the cfa locus is shown in blue with the corresponding gene annotation, and further putative autotransporter genes/pseudogenes are shown in yellow. (B) Domain organization of CFA of B. taylorii IBS296. SP (signal peptide; gray), the surface-located passenger domain with two β-helices (blue), pertactin-like domains (PL), and corresponding autochaperones (AC) predicted to form two stalks, separated by a linker (orange) and the C-terminal β-barrel (green). (C and G) Conservation scores of amino acid (aa) sequences along alignments of CFA homologs for (C) representative species of Bartonella lineage 4 or (G) closely related strains of B. quintana. The PE (property entropy) score is a metric based on Shannon entropy (34). The coloring scheme is based on colors used to illustrate CFA domain organization in B, except for the red color indicating hypervariable regions. (D) Analysis of putative LS4G2-binding regions in CFA of B. taylorii IBS296. After LS4G2 immunoprecipitation of CFA from bacterial lysates, a partial digest with proteinase K was performed and the eluted peptides were compared with full-length eluted (undigested) protein by mass spectrometry. Data are represented as fold-change difference between the above two conditions. The domain architecture is depicted including regions of high variability between B. taylorii strains IBS296 and M1 (red). Representative data from two independent experiments are reported, each performed in biological triplicates. (E and F) Phylogeny analyses of the indicated B. quintana strains were generated for the genes encoding either cfa (E) or virB5 (F). Values above nodes show bootstrap support (>75%). Scale bars indicate the number of substitutions per site. See SI Appendix, Figs. S4 and S5 for further details.
Fig. 6. High variation of CFA on the Bartonella subspecies level suggests immune evasion from antibody selection pressure. (A) Gene synteny analysis of the cfa locus and flanking regions in the indicated Bartonella species. Flanking housekeeping genes are shown in gray, the cfa locus is shown in blue with the corresponding gene annotation, and further putative autotransporter genes/pseudogenes are shown in yellow. (B) Domain organization of CFA of B. taylorii IBS296. SP (signal peptide; gray), the surface-located passenger domain with two β-helices (blue), pertactin-like domains (PL), and corresponding autochaperones (AC) predicted to form two stalks, separated by a linker (orange) and the C-terminal β-barrel (green). (C and G) Conservation scores of amino acid (aa) sequences along alignments of CFA homologs for (C) representative species of Bartonella lineage 4 or (G) closely related strains of B. quintana. The PE (property entropy) score is a metric based on Shannon entropy (34). The coloring scheme is based on colors used to illustrate CFA domain organization in B, except for the red color indicating hypervariable regions. (D) Analysis of putative LS4G2-binding regions in CFA of B. taylorii IBS296. After LS4G2 immunoprecipitation of CFA from bacterial lysates, a partial digest with proteinase K was performed and the eluted peptides were compared with full-length eluted (undigested) protein by mass spectrometry. Data are represented as fold-change difference between the above two conditions. The domain architecture is depicted including regions of high variability between B. taylorii strains IBS296 and M1 (red). Representative data from two independent experiments are reported, each performed in biological triplicates. (E and F) Phylogeny analyses of the indicated B. quintana strains were generated for the genes encoding either cfa (E) or virB5 (F). Values above nodes show bootstrap support (>75%). Scale bars indicate the number of substitutions per site. See SI Appendix, Figs. S4 and S5 for further details.CC BY-NC-ND · PubMed Central

Verification

Claims the paper makes

The claims and statistics of this paper haven’t been checked yet.

Run the check — free, no account needed. It reads the open-access text and checks the sources it cites.

A few free checks a day · papers already verified open instantly · results are public

Self-check

Percentages, sums and reported differences re-computed from the paper’s own numbers.

The self-check needs the paper’s full text.

Citations

Cites

Research works printed but not linked: 43

  1. 10.1128/CMR.05009-11 · DOI
  2. 10.1111/cmi.13004 · DOI
  3. 10.3390/tropicalmed4020069 · DOI
  4. P. K. Mada, H. Zulfiqar, A. S. Joel Chandranesan, “Bartonellosis” in StatPearls (StatPearls Publishing, 2022). https://www.ncbi.nlm.nih.gov/books/NBK430874/?report=reader#_NBK430874_pubdet. Accessed 1 February 2022.
  5. S. M. Akram, M. Y. Anwar, K. C. Thandra, P. Rawla, “Bacillary angiomatosis” in StatPearls (StatPearls Publishing, 2022). https://www.ncbi.nlm.nih.gov/books/NBK448092/. Accessed 1 February 2022.
  6. 10.1016/j.clindermatol.2008.10.006 · DOI
  7. 10.1002/ajpa.1330410212 · DOI
  8. 10.1371/journal.pntd.0002919 · DOI
  9. 10.1078/1438-4221-00167 · DOI
  10. 10.1051/vetres/2009011 · DOI
  11. 10.2217/fmb.09.41 · DOI
  12. 10.4049/jimmunol.167.1.11 · DOI
  13. 10.1016/j.cimid.2008.07.011 · DOI
  14. 10.1080/10408410008984173 · DOI
  15. 10.1084/jem.193.9.1077 · DOI
  16. 10.1128/iai.61.12.4962-4971.1993 · DOI
  17. 10.1016/j.micpath.2016.05.007 · DOI
  18. 10.1038/nri891 · DOI · Paper page
  19. 10.1016/j.abb.2012.06.001 · DOI
  20. 10.1128/IAI.71.12.6864-6870.2003 · DOI
  21. 10.1128/IAI.69.2.1009-1015.2001 · DOI
  22. 10.1128/iai.58.4.1017-1025.1990 · DOI
  23. 10.1084/jem.184.3.993 · DOI
  24. 10.1038/s41467-021-20930-0 · DOI
  25. 10.1093/gbe/evx042 · DOI
  26. 10.1371/journal.ppat.1004187 · DOI
  27. 10.1371/journal.ppat.1000946 · DOI
  28. 10.1371/journal.pbio.1000080 · DOI
  29. 10.1128/jvi.70.12.8375-8381.1996 · DOI
  30. 10.1002/eji.200324717 · DOI
  31. 10.1128/IAI.73.7.4205-4213.2005 · DOI
  32. 10.1515/BMC.2011.045 · DOI
  33. 10.1038/ng.2007.38 · DOI
  34. 10.1093/bioinformatics/btm270 · DOI
  35. 10.3389/fmicb.2017.02607 · DOI
  36. 10.1016/j.cels.2017.05.011 · DOI
  37. 10.1111/cmi.13068 · DOI
  38. 10.1038/nature01097 · DOI · Paper page
  39. 10.1016/j.vaccine.2015.01.081 · DOI
  40. 10.1128/CMR.2.Suppl.S139 · DOI
  41. 10.1128/JVI.01659-16 · DOI
  42. 10.1016/j.chom.2020.01.015 · DOI
  43. 10.1093/nar/gky1106 · DOI

Metadata

Authors
Siewert, L. K., Korotaev, A., Sedzicki, J., Fromm, K., Pinschewer, D. D., & Dehio, C.
Affiliations
  • University of Basel (CH)
  • Biozentrum, University of Basel, 4056 Basel, Switzerland
Corresponding author
  • Pinschewer, Daniel D.
  • Dehio, Christoph
Venue
Proceedings of the National Academy of Sciences
Published
2022-06-17
Volume
119
Issue
25
Pages
e2202059119-e2202059119
ISSN
  • 0027-8424 (ISSN-L)
  • 1091-6490
OpenAlex
W4283026028
Cited by
17
References
6
Citations by year
2026: 3 · 2025: 3 · 2024: 5 · 2023: 4 · 2022: 2
FWCI
2.78
Type
journal article
Language
en
Open access
Locations
  • Proceedings of the National Academy of Sciences (publishedVersion, cc-by-nc-nd)
  • bioRxiv (Cold Spring Harbor Laboratory) (acceptedVersion)
  • PubMed Central (publishedVersion, cc-by-nc-nd)
  • PubMed (publishedVersion)
  • edoc (University of Basel) (acceptedVersion)
  • edoc (University of Basel)
Funders
  • Schweizerischer Nationalfonds zur Förderung der Wissenschaftlichen Forschung (310030B_201273, 310030_173132)
  • National Center of Competence in Research AntiResist (51NF40_180541)
  • EC | ERC | HORIZON EUROPE European Research Council (310962)
Topics
  • Health Sciences › Medicine › Infectious Diseases › Bartonella species infections research
  • Life Sciences › Biochemistry, Genetics and Molecular Biology › Molecular Biology › Bacillus and Francisella bacterial research
  • Health Sciences › Medicine › Epidemiology › Burkholderia infections and melioidosis
Keywords
Bartonella, neutralizing antibodies, protective antigen, antibody escape, hypervariable region, CD40 signaling, bacteremia, vaccination, monoclonal antibodies, immune evasion, vaccine development
MeSH terms
Type V Secretion Systems, Animals, Antibodies, Monoclonal, Antigens, Bacterial, Bacterial Vaccines, Bartonella, Bartonella Infections, Cloning, Molecular, Vaccination, Bacteremia, Mice, Immune Evasion, Antibodies, Neutralizing

About these checks

Registry, retraction, Cites and statistics results are computed, not judged, with one exception: a printed reference that no index lists is read once by a model before it counts as a citation error. Claims are extracted by a model and kept only when their quote appears verbatim in the text; each cited source is then checked, with a model’s help, for whether it says what the claim relies on. Those verdicts can be wrong — read the claim’s quote and the cited source before relying on one.

Statistics and arithmetic are recomputed, not judged.

Confidence bands are shown only for fields calibrated on our annotated test set. None is calibrated yet, so no band is shown.

What counts as a claim ›How we measure confidence ›How we check this ›

Are you an author, or do you see a problem with this page? Request a review