Cited by 26Enzyme Structure and FunctionProtein Structure and DynamicsFolate and B Vitamins Research

The DOI matches its Crossref record; 2 of the 2 references it cites were found in a registry or an index.

Conformational switching and flexibility in cobalamin-dependent methionine synthase studied by small-angle X-ray scattering and cryoelectron microscopy

Open access
Watkins, Maxwell B., Wang, Haoyue, Burnim, Audrey, Ando, Nozomi·2023·Proceedings of the National Academy of Sciences

Published version of a preprint

Abstract

Cobalamin-dependent methionine synthase (MetH) catalyzes the synthesis of methionine from homocysteine and 5-methyltetrahydrofolate (CH 3 -H 4 folate) using the unique chemistry of its cofactor. In doing so, MetH links the cycling of S -adenosylmethionine with the folate cycle in one-carbon metabolism. Extensive biochemical and structural studies on Escherichia coli MetH have shown that this flexible, multidomain enzyme adopts two major conformations to prevent a futile cycle of methionine production and consumption. However, as MetH is highly dynamic as well as both a photosensitive and oxygen-sensitive metalloenzyme, it poses special challenges for structural studies, and existing structures have necessarily come from a “divide and conquer” approach. In this study, we investigate E. coli MetH and a thermophilic homolog from Thermus filiformis using small-angle X-ray scattering (SAXS), single-particle cryoelectron microscopy (cryo-EM), and extensive analysis of the AlphaFold2 database to present a structural description of the full-length MetH in its entirety. Using SAXS, we describe a common resting-state conformation shared by both active and inactive oxidation states of MetH and the roles of CH 3 -H 4 folate and flavodoxin in initiating turnover and reactivation. By combining SAXS with a 3.6-Å cryo-EM structure of the T. filiformis MetH, we show that the resting-state conformation consists of a stable arrangement of the catalytic domains that is linked to a highly mobile reactivation domain. Finally, by combining AlphaFold2-guided sequence analysis and our experimental findings, we propose a general model for functional switching in MetH.

Overview

The claims and statistics of this paper haven’t been checked yet.

Run the check — free, no account needed. It reads the open-access text and checks the sources it cites.

A few free checks a day · papers already verified open instantly · results are public

Integrity signals

Registry

Crossref · 10.1073/pnas.2302531120

Cites

2 of 2 references verified0 citation errors · 0 not checkable

Statistics

Figures

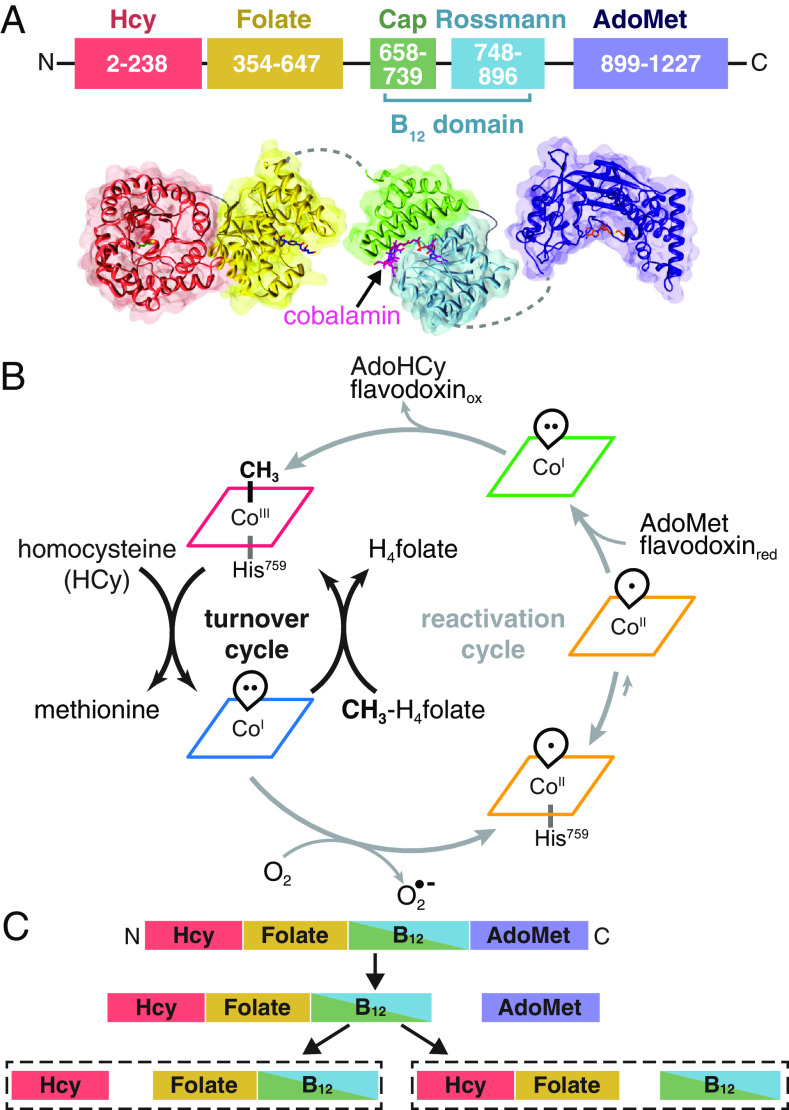
Fig. 1. Overview of MetH. (A) MetH has a multidomain architecture (shown in E. coli numbering), consisting of four domains, which bind homocysteine (Hcy), 5-methyltetrahydrofolate (CH3-H4folate) (13), cobalamin (B12) (14), and S-adenosylmethionine (AdoMet) (15). The B12 domain additionally consists of the cap and Rossmann subdomains. There is flexibility expected between all the domains except the two N-terminal domains. (B) During normal turnover (black arrows), CH3-Cob(III) enzyme will bind Hcy and CH3-H4folate sequentially, with the latter preferentially binding first (16). Both reactions then proceed in the ternary complex, with the first reaction being methylation of Hcy by CH3-Cob(III) to yield methionine and a reduced Cob(I) intermediate. Methyl transfer from CH3-H4folate to the cofactor then yields H4folate and regenerates CH3-Cob(III). When the Cob(I) cofactor is occasionally oxidized to inactive Cob(II), MetH is able to reactivate via reductive methylation using AdoMet as a methyl donor and an electron from hydroquinone or semiquinone flavodoxin (gray arrows). Cob(II) is predominantly His-on at physiological pH but can interconvert with the His-off state, which is likely to be recognized by flavodoxin. The reactivation cycle proceeds through a distinct, 4-coordinate Cob(I), which is thought to be conformationally gated from normal turnover. (C) Limited trypsin proteolysis produces two different pathways. Cob(II) enzyme in the His-off state or in the presence of flavodoxin proceeds through the right pathway, while all other states proceed through the left (17).
Fig. 1. Overview of MetH. (A) MetH has a multidomain architecture (shown in E. coli numbering), consisting of four domains, which bind homocysteine (Hcy), 5-methyltetrahydrofolate (CH3-H4folate) (13), cobalamin (B12) (14), and S-adenosylmethionine (AdoMet) (15). The B12 domain additionally consists of the cap and Rossmann subdomains. There is flexibility expected between all the domains except the two N-terminal domains. (B) During normal turnover (black arrows), CH3-Cob(III) enzyme will bind Hcy and CH3-H4folate sequentially, with the latter preferentially binding first (16). Both reactions then proceed in the ternary complex, with the first reaction being methylation of Hcy by CH3-Cob(III) to yield methionine and a reduced Cob(I) intermediate. Methyl transfer from CH3-H4folate to the cofactor then yields H4folate and regenerates CH3-Cob(III). When the Cob(I) cofactor is occasionally oxidized to inactive Cob(II), MetH is able to reactivate via reductive methylation using AdoMet as a methyl donor and an electron from hydroquinone or semiquinone flavodoxin (gray arrows). Cob(II) is predominantly His-on at physiological pH but can interconvert with the His-off state, which is likely to be recognized by flavodoxin. The reactivation cycle proceeds through a distinct, 4-coordinate Cob(I), which is thought to be conformationally gated from normal turnover. (C) Limited trypsin proteolysis produces two different pathways. Cob(II) enzyme in the His-off state or in the presence of flavodoxin proceeds through the right pathway, while all other states proceed through the left (17).CC BY-NC-ND · PubMed Central
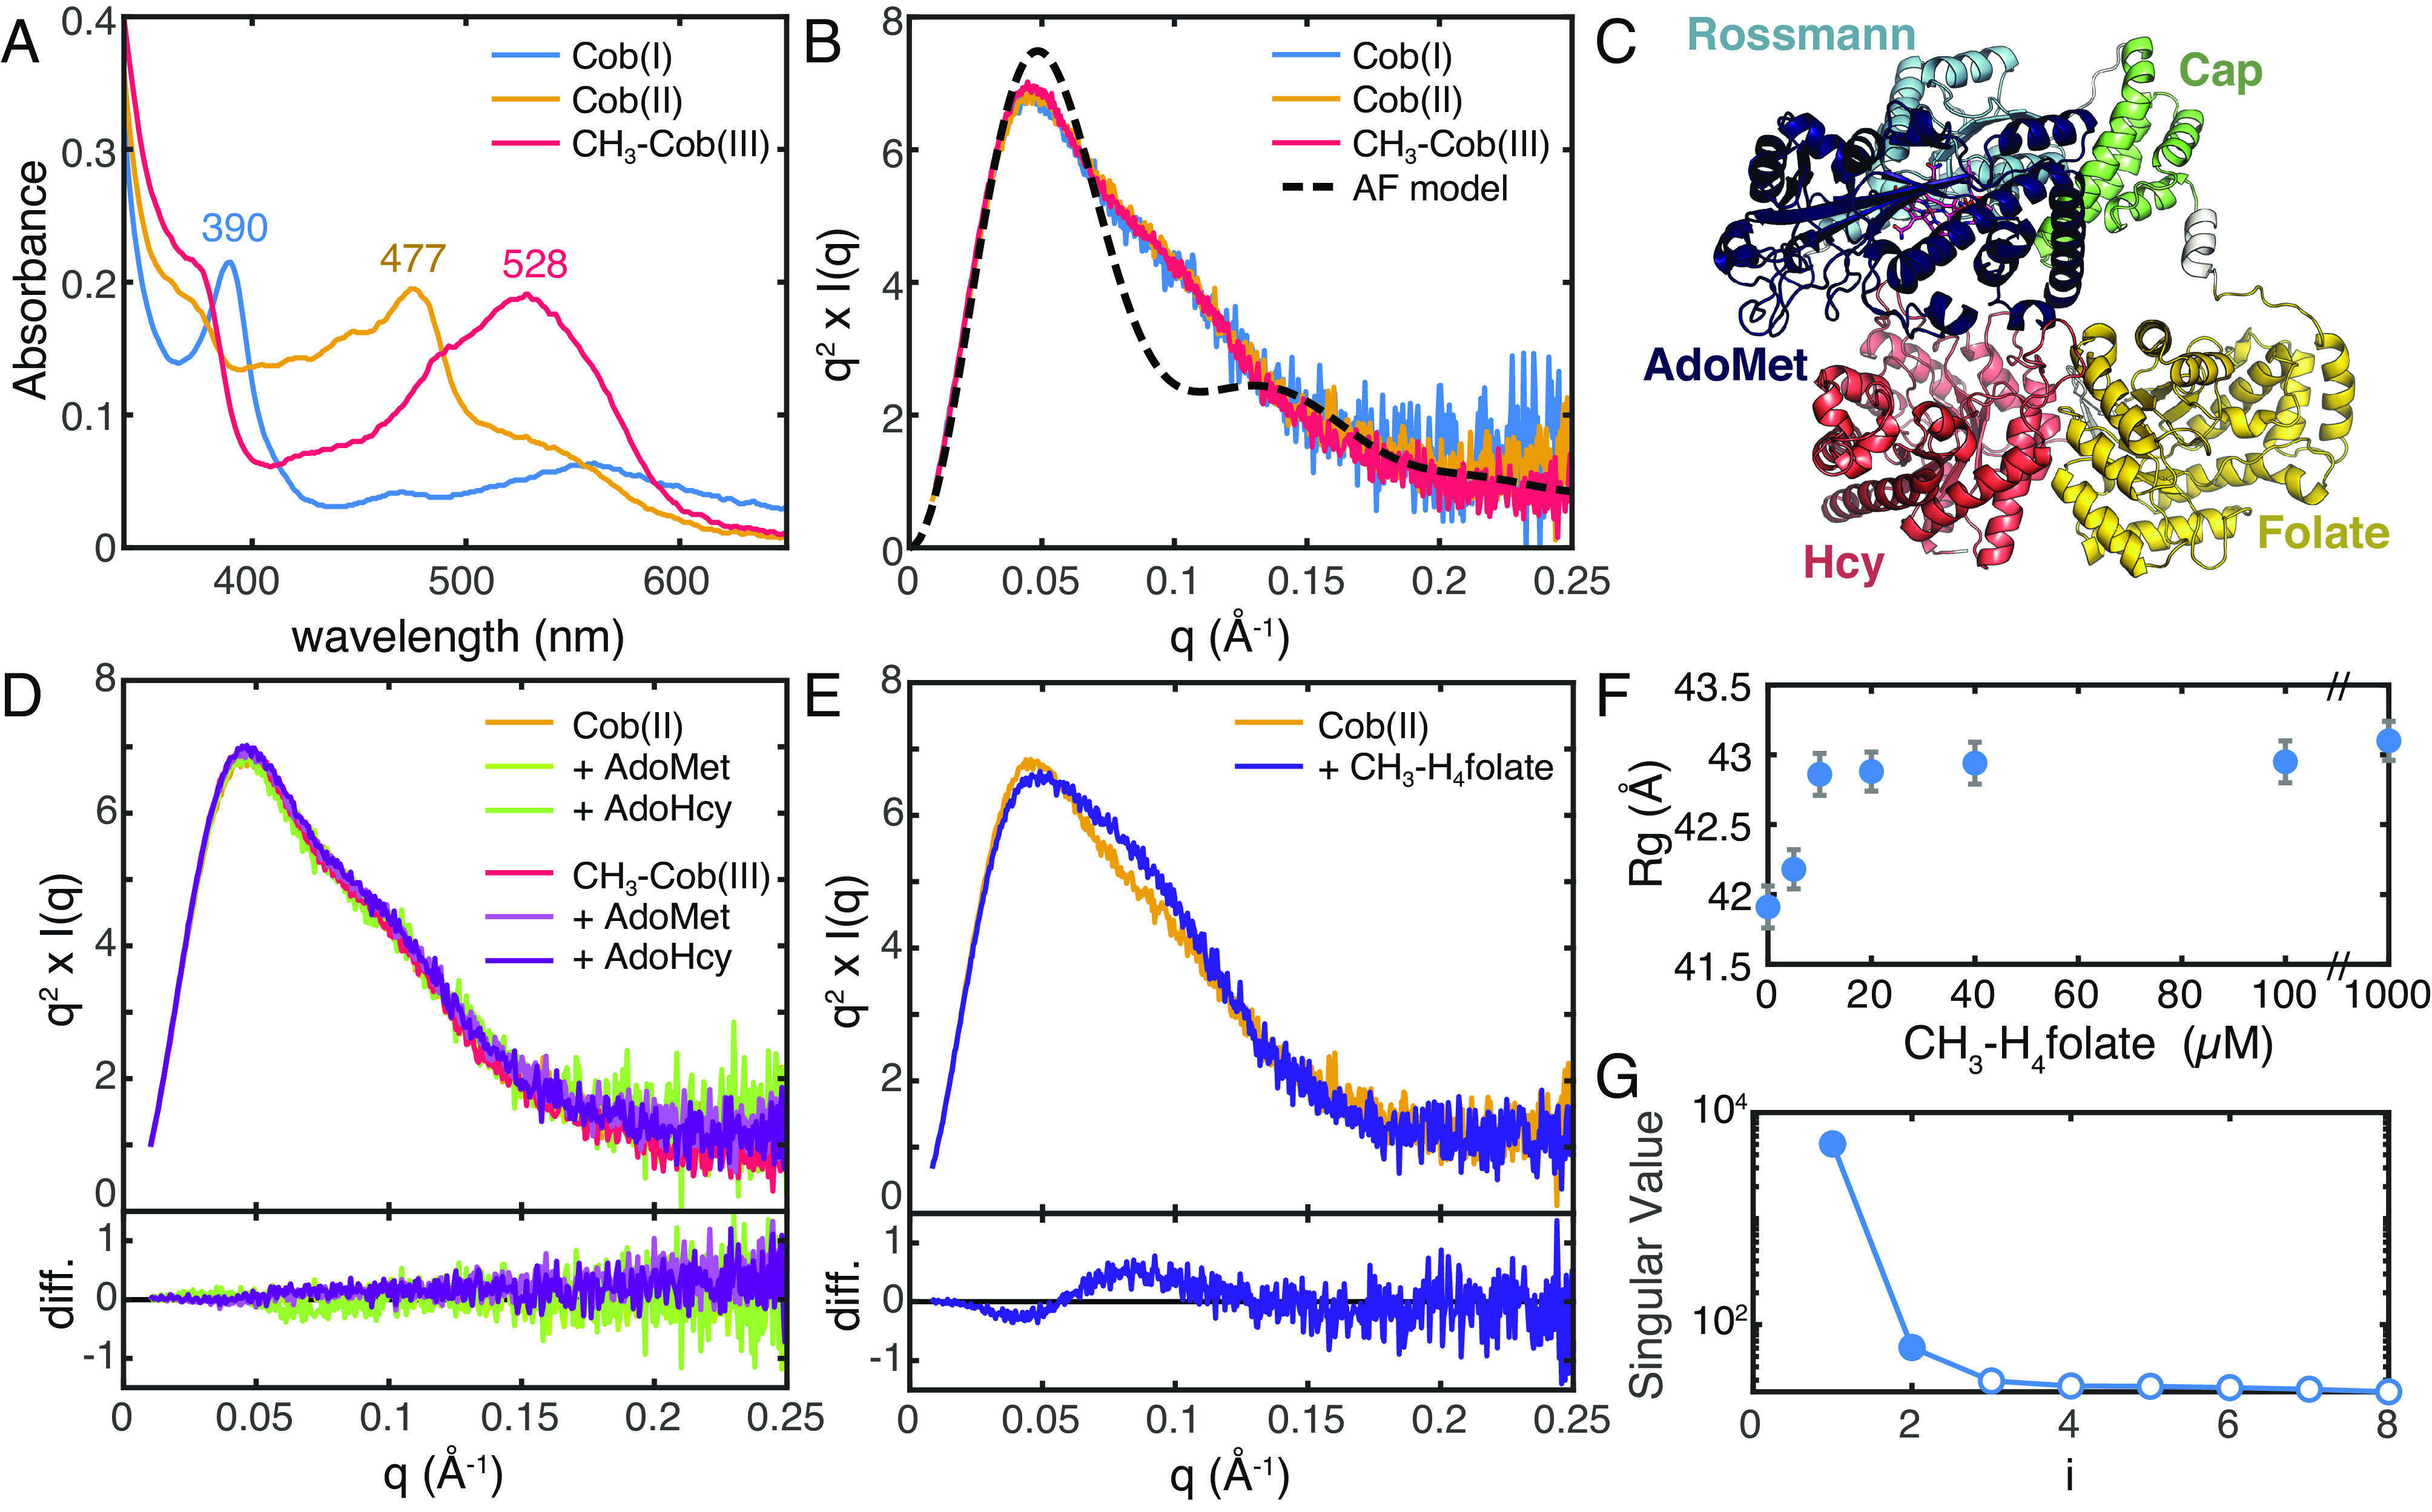
Fig. 2. SAXS shows that there is a shared conformation of E. coli MetH and that conformational change is driven by CH3-H4folate. (A) UV-Vis absorption spectra of E. coli MetH in the Cob(I) and CH3-Cob(III) states from the turnover cycle (blue and red) and the inactive Cob(II) state (orange) are distinct. (B) SAXS profiles, shown in Kratky representation (q2 × I vs. q), of 20 µM E. coli MetH in the three oxidation states (same colors as in panel A) are indistinguishable. The theoretical scattering from the AlphaFold2 model in panel C (black dashed) displays a much sharper Kratky peak compared to the experimental curves, indicating that in solution, MetH is much more extended and flexible. (C) The AlphaFold2 prediction for full-length E. coli MetH predicts the two C-terminal domains in the reactivation conformation. (D) Addition of reactivation-cycle substrates and products produces no discernable change to the MetH conformation. The top plot shows the Kratky curves, while the bottom shows difference curves. (E) Addition of 1 mM CH3-H4folate [specifically, (6S)-CH3-H4PteGlu3] to Cob(II) MetH results in a widened Kratky peak, indicative of a conformational change to a more elongated structure. The top plot shows the Kratky curves, while the bottom shows difference curves. (F) The conformational change corresponds to a modest increase in the radius of gyration (Rg) with increasing CH3-H4folate concentration. The error bars represent the SD from Guinier analysis. (G) SVD of the titration series shown in panel F suggests a minimally two-state transition.
Fig. 2. SAXS shows that there is a shared conformation of E. coli MetH and that conformational change is driven by CH3-H4folate. (A) UV-Vis absorption spectra of E. coli MetH in the Cob(I) and CH3-Cob(III) states from the turnover cycle (blue and red) and the inactive Cob(II) state (orange) are distinct. (B) SAXS profiles, shown in Kratky representation (q2 × I vs. q), of 20 µM E. coli MetH in the three oxidation states (same colors as in panel A) are indistinguishable. The theoretical scattering from the AlphaFold2 model in panel C (black dashed) displays a much sharper Kratky peak compared to the experimental curves, indicating that in solution, MetH is much more extended and flexible. (C) The AlphaFold2 prediction for full-length E. coli MetH predicts the two C-terminal domains in the reactivation conformation. (D) Addition of reactivation-cycle substrates and products produces no discernable change to the MetH conformation. The top plot shows the Kratky curves, while the bottom shows difference curves. (E) Addition of 1 mM CH3-H4folate [specifically, (6S)-CH3-H4PteGlu3] to Cob(II) MetH results in a widened Kratky peak, indicative of a conformational change to a more elongated structure. The top plot shows the Kratky curves, while the bottom shows difference curves. (F) The conformational change corresponds to a modest increase in the radius of gyration (Rg) with increasing CH3-H4folate concentration. The error bars represent the SD from Guinier analysis. (G) SVD of the titration series shown in panel F suggests a minimally two-state transition.CC BY-NC-ND · PubMed Central
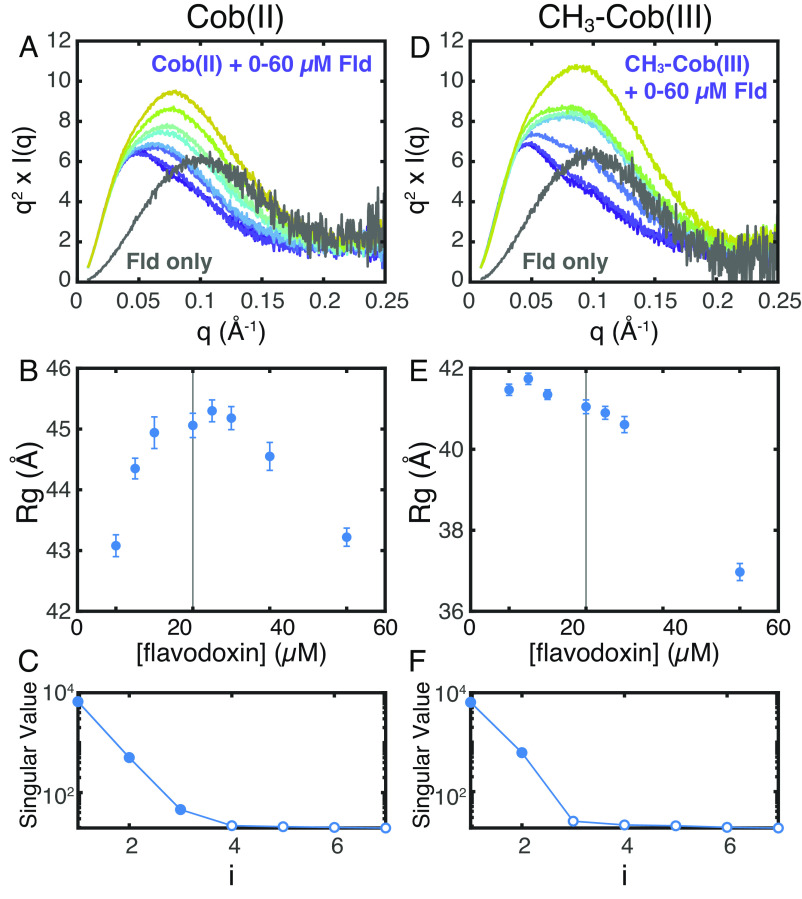
Fig. 3. SAXS shows that flavodoxin discriminates between E. coli MetH oxidation states. (A–C) Titration of 0 to 60 µM E. coli flavodoxin (Fld) into 20 µM Cob(II) E. coli MetH at pH 6.0 produces behavior consistent with complex formation and saturation. (A) Kratky curves for the titration series are shown in color (navy, 0 µM Fld, to yellow, 60 µM Fld), while that of pure Fld is shown in gray. (B) The apparent Guinier Rg of the mixture increases to near the equimolar point (vertical line), indicative of complex formation, followed by a decrease due to excess Fld (the Rg of free Fld is ~18 Å). (C) SVD of the titration series shown in panel Fld suggests a minimally three-component system, consistent with the two proteins as well as a complex of the two. (D–F) By contrast, titration of 0 to 60 μM Fld into 20 μM CH3-Cob(III) MetH indicates a lack of complex formation. (D) Kratky curves for the titration series are shown in color (navy to yellow), while that of pure Fld is shown in gray. (E) The apparent Guinier Rg of the mixture decreases with increasing Fld, indicating that the two proteins do not interact. (F) SVD of the titration series shown in panel D suggests a minimally two-component system, consistent a mixture of two noninteracting proteins.
Fig. 3. SAXS shows that flavodoxin discriminates between E. coli MetH oxidation states. (A–C) Titration of 0 to 60 µM E. coli flavodoxin (Fld) into 20 µM Cob(II) E. coli MetH at pH 6.0 produces behavior consistent with complex formation and saturation. (A) Kratky curves for the titration series are shown in color (navy, 0 µM Fld, to yellow, 60 µM Fld), while that of pure Fld is shown in gray. (B) The apparent Guinier Rg of the mixture increases to near the equimolar point (vertical line), indicative of complex formation, followed by a decrease due to excess Fld (the Rg of free Fld is ~18 Å). (C) SVD of the titration series shown in panel Fld suggests a minimally three-component system, consistent with the two proteins as well as a complex of the two. (D–F) By contrast, titration of 0 to 60 μM Fld into 20 μM CH3-Cob(III) MetH indicates a lack of complex formation. (D) Kratky curves for the titration series are shown in color (navy to yellow), while that of pure Fld is shown in gray. (E) The apparent Guinier Rg of the mixture decreases with increasing Fld, indicating that the two proteins do not interact. (F) SVD of the titration series shown in panel D suggests a minimally two-component system, consistent a mixture of two noninteracting proteins.CC BY-NC-ND · PubMed Central
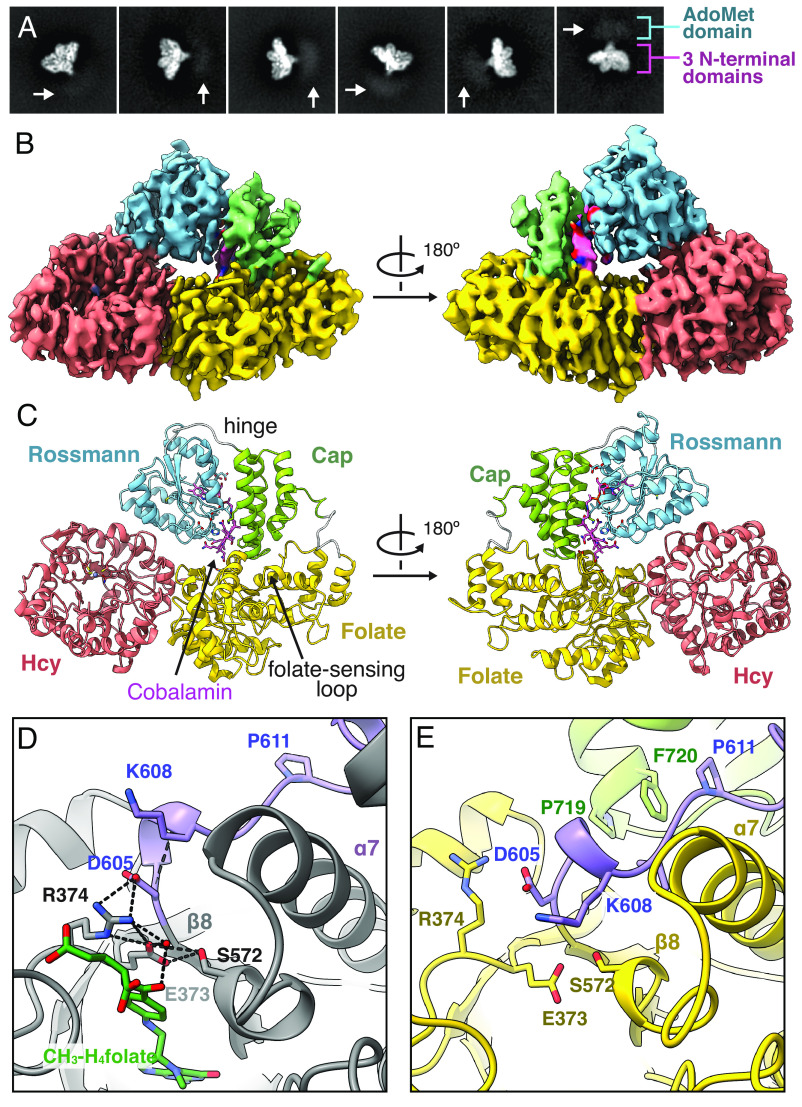
Fig. 4. Cryo-EM of T. Filiformis MetH reveals a resting-state conformation poised for folate sensing. (A) 2D classes of Cob(II) T. filiformis MetH depicts the full-length enzyme. (B) The 3.6-Å consensus reconstruction contains the three N-terminal domains: the Hcy, folate, and B12 domains (PDB 8G3H, EMD-29699). The map is colored by domain assignment and shown at a threshold level of 0.3. (C) Residues 23–877 along with the cobalamin and zinc cofactors were built into the consensus map. The model suggests that this conformation represents a resting state of the enzyme, where the B12 domain is in the cap-on conformation and nested between the Hcy and folate domains. (D) In a fragment structure of the folate domain from T. thermophilus MetH (PDB 5VOO) (26), residues on the loop (purple) that extends past the C terminus of the folate-domain β8-strand (specifically, D605 and K608, shown in T. filiformis numbering for clarity) are oriented to help stabilize binding of CH3-H4folate through water-mediated interactions with the p-aminobenzoate moiety. The methyl group makes no interactions with MetH. (E) In our cryo-EM structure, this folate-sensing loop (purple) is pushed toward the folate-binding site by interactions with the cap subdomain (green). The competition between the cap subdomain and CH3-H4folate for the folate-sensing loop provides a structural basis for folate-driven disruption of the resting-state conformation and resulting conformational changes. Both hydrophobic and polar interactions are involved in stabilizing this closed conformation of the folate-binding loop (SI Appendix, Figs. S13 and S14), and although the loop is colored in purple for contrast, it is part of the folate domain (SI Appendix, Fig. S15).
Fig. 4. Cryo-EM of T. Filiformis MetH reveals a resting-state conformation poised for folate sensing. (A) 2D classes of Cob(II) T. filiformis MetH depicts the full-length enzyme. (B) The 3.6-Å consensus reconstruction contains the three N-terminal domains: the Hcy, folate, and B12 domains (PDB 8G3H, EMD-29699). The map is colored by domain assignment and shown at a threshold level of 0.3. (C) Residues 23–877 along with the cobalamin and zinc cofactors were built into the consensus map. The model suggests that this conformation represents a resting state of the enzyme, where the B12 domain is in the cap-on conformation and nested between the Hcy and folate domains. (D) In a fragment structure of the folate domain from T. thermophilus MetH (PDB 5VOO) (26), residues on the loop (purple) that extends past the C terminus of the folate-domain β8-strand (specifically, D605 and K608, shown in T. filiformis numbering for clarity) are oriented to help stabilize binding of CH3-H4folate through water-mediated interactions with the p-aminobenzoate moiety. The methyl group makes no interactions with MetH. (E) In our cryo-EM structure, this folate-sensing loop (purple) is pushed toward the folate-binding site by interactions with the cap subdomain (green). The competition between the cap subdomain and CH3-H4folate for the folate-sensing loop provides a structural basis for folate-driven disruption of the resting-state conformation and resulting conformational changes. Both hydrophobic and polar interactions are involved in stabilizing this closed conformation of the folate-binding loop (SI Appendix, Figs. S13 and S14), and although the loop is colored in purple for contrast, it is part of the folate domain (SI Appendix, Fig. S15).CC BY-NC-ND · PubMed Central
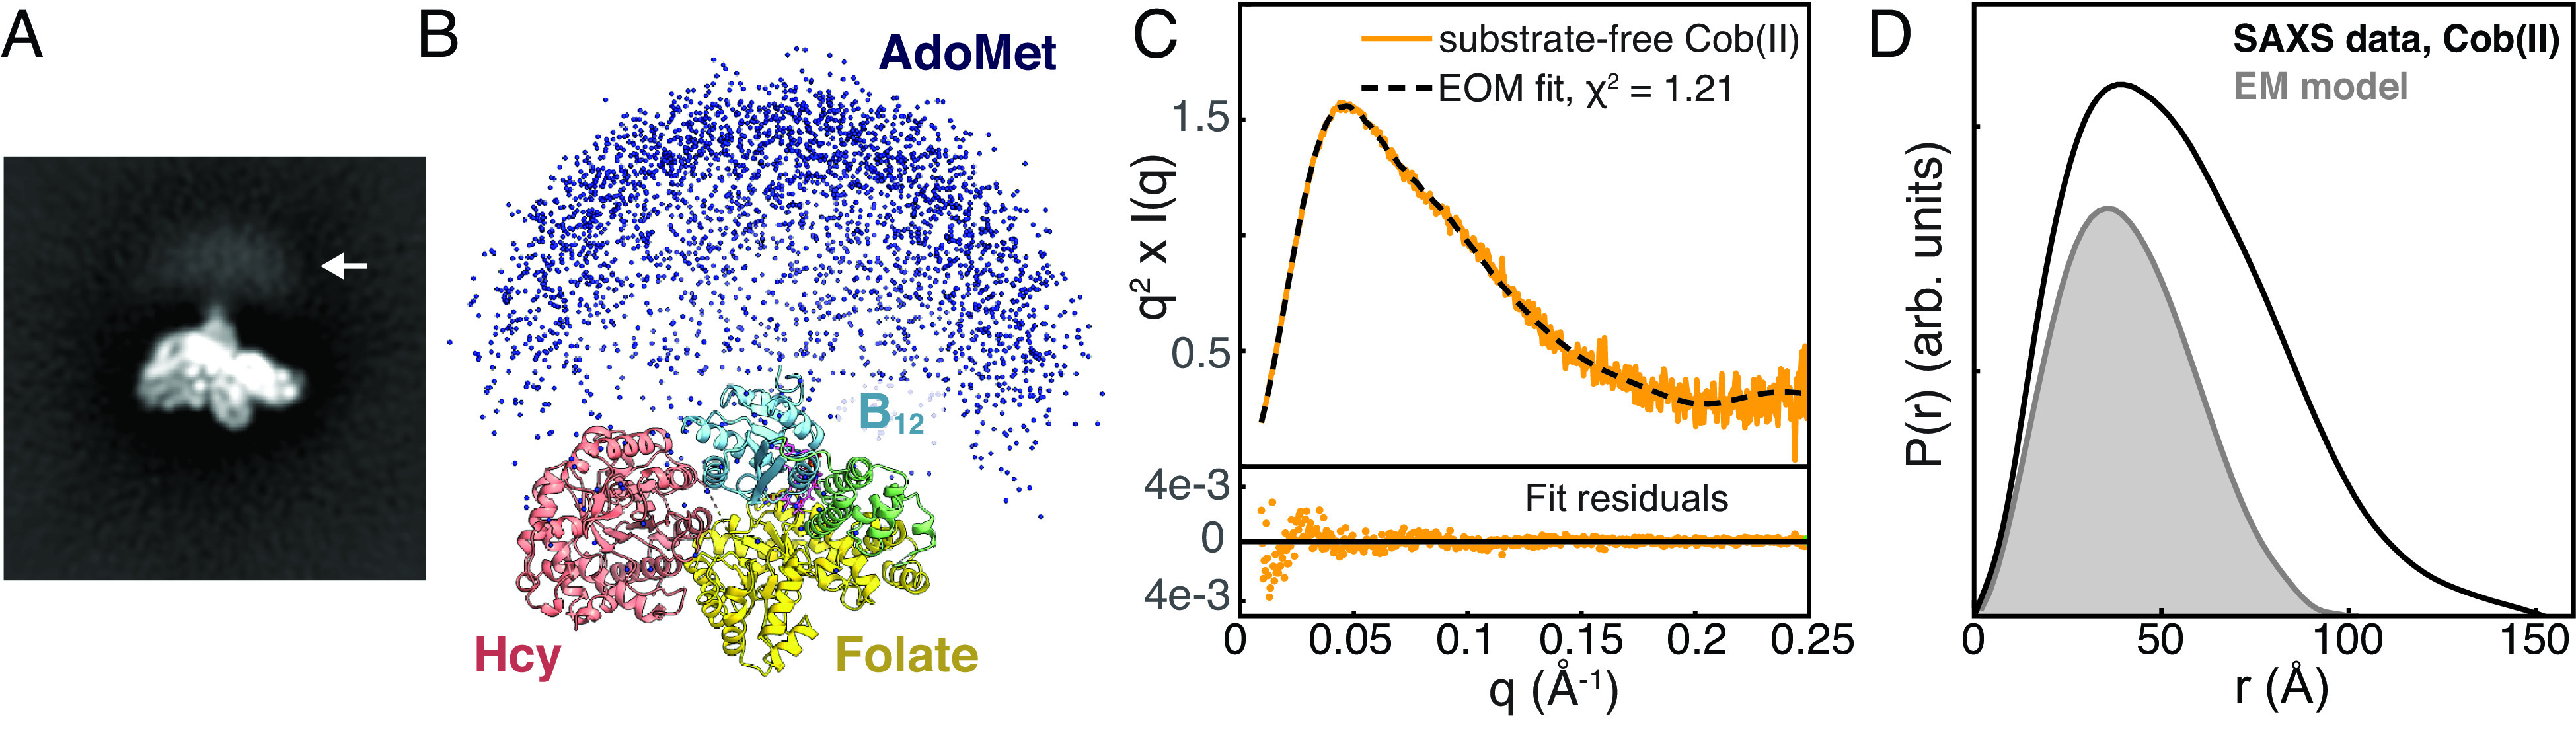
Fig. 5. Combining cryo-EM with ensemble modeling of SAXS data shows that the AdoMet domain is highly flexible in the resting state of full-length MetH. (A) Blurry density is visible past the C terminus of the B12 domain in reference-free 2D classes of T. filiformis MetH shown in Fig. 4A (arrow). (B) A large ensemble of E. coli MetH structures was generated in EOM (38, 39) by treating the three N-terminal domains in the conformation observed by cryo-EM and the C-terminal AdoMet domain as two independent, flexibly-linked rigid bodies. Plotting the position of the AdoMet domain in each of the 10,000 models (blue spheres) produces a qualitatively similar distribution to the blurry density seen in the 2D classes in panel A. (C) The substrate-free Cob(II) E. coli MetH SAXS data from Fig. 2B (orange) can be described very well by a minimal ensemble selected by EOM (38, 39) (dashed). (D) Comparison of the pair distance distribution, P(r), calculated from the SAXS data shown in panel C (black) to the theoretical P(r) generated from an E. coli model of the three N-terminal domains derived from the cryo-EM structure (gray) indicates that many of the large interparticle distances are not fully described by the EM model alone, indicating that the AdoMet domain samples many extended conformations. The P(r) functions were normalized by dividing by I(0)/MW2, where I(0) is the forward scattering intensity, and MW is the molecular weight.
Fig. 5. Combining cryo-EM with ensemble modeling of SAXS data shows that the AdoMet domain is highly flexible in the resting state of full-length MetH. (A) Blurry density is visible past the C terminus of the B12 domain in reference-free 2D classes of T. filiformis MetH shown in Fig. 4A (arrow). (B) A large ensemble of E. coli MetH structures was generated in EOM (38, 39) by treating the three N-terminal domains in the conformation observed by cryo-EM and the C-terminal AdoMet domain as two independent, flexibly-linked rigid bodies. Plotting the position of the AdoMet domain in each of the 10,000 models (blue spheres) produces a qualitatively similar distribution to the blurry density seen in the 2D classes in panel A. (C) The substrate-free Cob(II) E. coli MetH SAXS data from Fig. 2B (orange) can be described very well by a minimal ensemble selected by EOM (38, 39) (dashed). (D) Comparison of the pair distance distribution, P(r), calculated from the SAXS data shown in panel C (black) to the theoretical P(r) generated from an E. coli model of the three N-terminal domains derived from the cryo-EM structure (gray) indicates that many of the large interparticle distances are not fully described by the EM model alone, indicating that the AdoMet domain samples many extended conformations. The P(r) functions were normalized by dividing by I(0)/MW2, where I(0) is the forward scattering intensity, and MW is the molecular weight.CC BY-NC-ND · PubMed Central
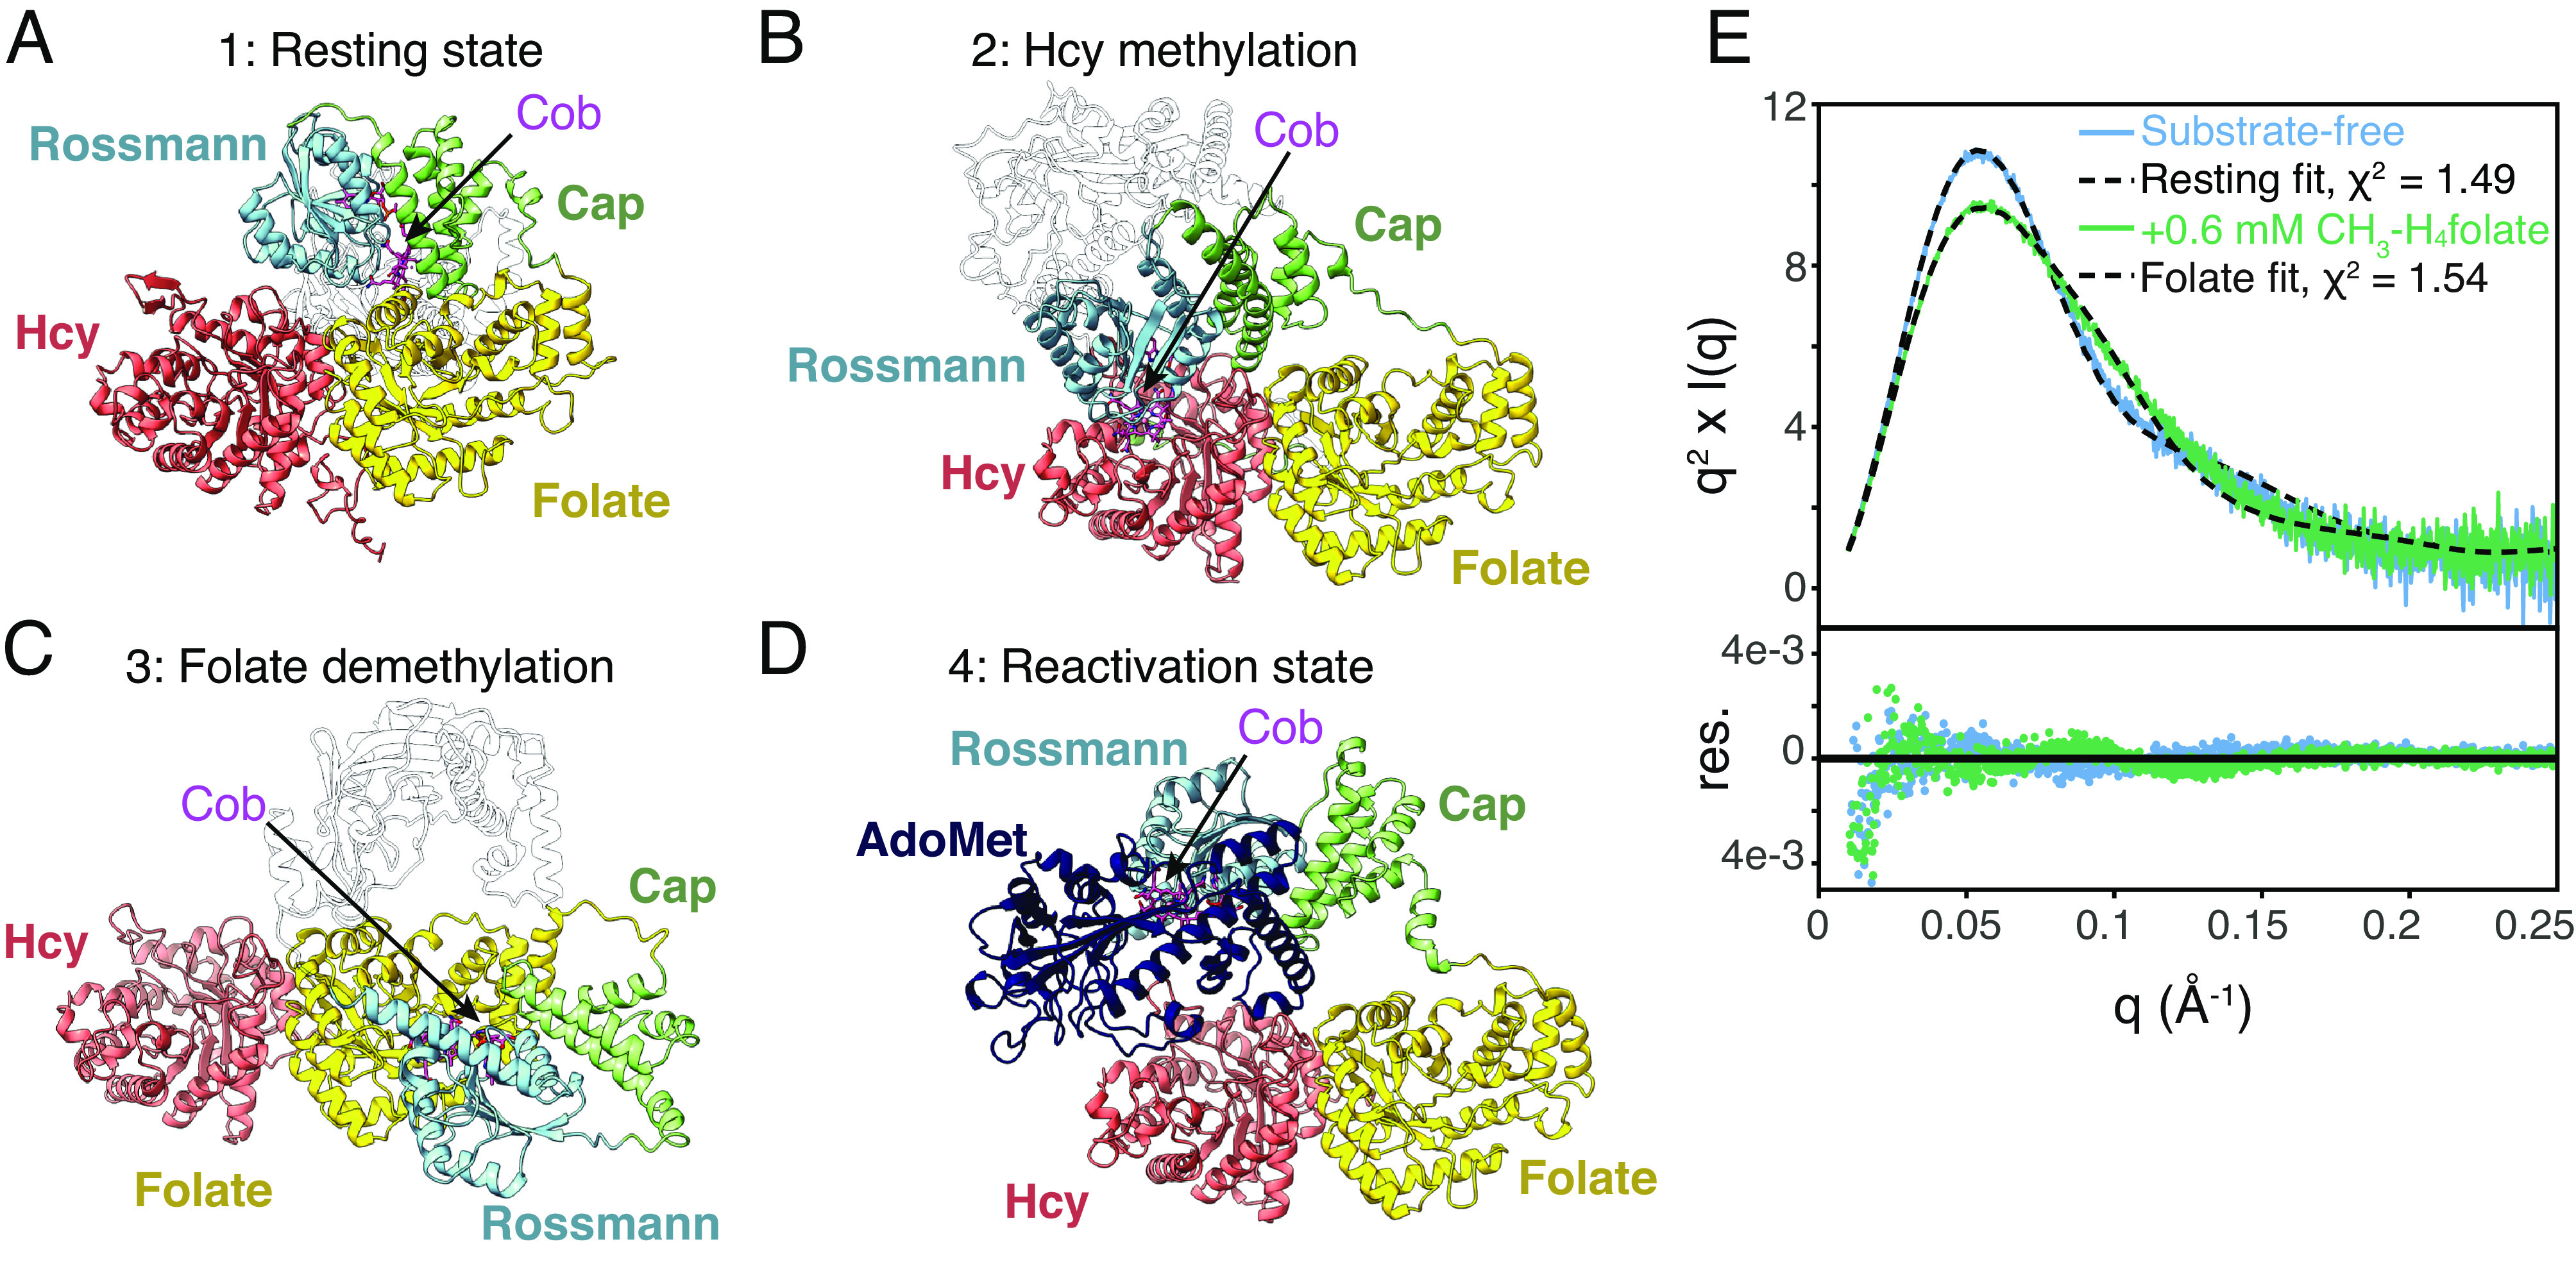
Fig. 6. Structure prediction and removal of the AdoMet domain disambiguates the conformational change caused by CH3-H4folate. (A) The most recent AlphaFold2 model for T. filiformis MetH predicts a conformation highly similar to the resting state observed in cryo-EM. (B) The AlphaFold2 model for Mus musculus MetH predicts a conformation similar to what would be expected to be competent for homocysteine methylation. (C) The AlphaFold2 model for a Sphaerochaeta sp. (Uniprot A0A521IQ66) predicts a conformation similar to what would be expected to be competent for folate demethylation. (D) The AlphaFold2 model for E. coli MetH predicts the C-terminal half of the enzyme in the reactivation conformation. This conformation is the most common conformation predicted among AlphaFold2 models, likely due to the prevalence of reactivation-state structures in the PDB. Models from across multiple species suggest that the N- and C-terminal halves do not interact. (E) A fragment containing only the three N-terminal domains of Cob(II) E. coli MetH was produced by tryptic proteolysis. The Kratky plot for this fragment (at 23 µM) displays a sharp peak (blue), indicating that removal of the AdoMet domain leads to a compact structure. Incubating the fragment with 0.6 mM CH3-H4folate leads to a change in scattering (green), indicating that folate-driven conformational change occurs within the three N-terminal domains. The model based on the cryo-EM resting state describes the substrate-free data well (blue/dashed), while a model based on that shown in panel C describes the folate-incubated Cob(II) data well (green/dashed). For panels A–C, the AdoMet domain has been rendered transparent for clarity, and for all models, the cobalamin ligand (magenta) has been docked into the structure by aligning the 1BMT (14) structure to the cobalamin-binding loop of each model.
Fig. 6. Structure prediction and removal of the AdoMet domain disambiguates the conformational change caused by CH3-H4folate. (A) The most recent AlphaFold2 model for T. filiformis MetH predicts a conformation highly similar to the resting state observed in cryo-EM. (B) The AlphaFold2 model for Mus musculus MetH predicts a conformation similar to what would be expected to be competent for homocysteine methylation. (C) The AlphaFold2 model for a Sphaerochaeta sp. (Uniprot A0A521IQ66) predicts a conformation similar to what would be expected to be competent for folate demethylation. (D) The AlphaFold2 model for E. coli MetH predicts the C-terminal half of the enzyme in the reactivation conformation. This conformation is the most common conformation predicted among AlphaFold2 models, likely due to the prevalence of reactivation-state structures in the PDB. Models from across multiple species suggest that the N- and C-terminal halves do not interact. (E) A fragment containing only the three N-terminal domains of Cob(II) E. coli MetH was produced by tryptic proteolysis. The Kratky plot for this fragment (at 23 µM) displays a sharp peak (blue), indicating that removal of the AdoMet domain leads to a compact structure. Incubating the fragment with 0.6 mM CH3-H4folate leads to a change in scattering (green), indicating that folate-driven conformational change occurs within the three N-terminal domains. The model based on the cryo-EM resting state describes the substrate-free data well (blue/dashed), while a model based on that shown in panel C describes the folate-incubated Cob(II) data well (green/dashed). For panels A–C, the AdoMet domain has been rendered transparent for clarity, and for all models, the cobalamin ligand (magenta) has been docked into the structure by aligning the 1BMT (14) structure to the cobalamin-binding loop of each model.CC BY-NC-ND · PubMed Central

Verification

Claims the paper makes

The claims and statistics of this paper haven’t been checked yet.

Run the check — free, no account needed. It reads the open-access text and checks the sources it cites.

A few free checks a day · papers already verified open instantly · results are public

Self-check

Percentages, sums and reported differences re-computed from the paper’s own numbers.

The self-check needs the paper’s full text.

Citations

Cites

Research works printed but not linked: 47

  1. 10.1096/fasebj.4.5.2407589 · DOI
  2. 10.1086/341354 · DOI
  3. 10.1093/hmg/5.12.1859 · DOI
  4. 10.1086/344209 · DOI
  5. J.-L. Guéant R.-M. Guéant-Rodriguez V. J. Kosgei D. Coelho Causes and consequences of impaired methionine synthase activity in acquired and inherited disorders of vitamin B 12 metabolism. Crit. Rev. Biochem. Mol. Biol. 57 133–155 (2022) 10.1080/10409238.2021.1979459. · DOI
  6. 10.1007/s12272-018-1016-4 · DOI
  7. 10.1021/bi700339v · DOI
  8. 10.1074/jbc.272.6.3628 · DOI
  9. 10.1016/S0021-9258(18)46968-2 · DOI
  10. 10.4162/nrp.2020.14.2.95 · DOI
  11. 10.1038/s42255-021-00465-w · DOI
  12. 10.1007/s13311-017-0593-0 · DOI
  13. 10.1073/pnas.0308082100 · DOI
  14. 10.1126/science.7992050 · DOI
  15. 10.1016/S0969-2126(96)00135-9 · DOI
  16. 10.1021/bi00502a013 · DOI
  17. 10.1021/bi9730893 · DOI
  18. 10.1038/nsb738 · DOI
  19. 10.1073/pnas.0906132106 · DOI
  20. 10.1073/pnas.0709960105 · DOI
  21. 10.1073/pnas.0800329105 · DOI
  22. 10.1021/bi9808565 · DOI
  23. 10.1021/bi001096c · DOI
  24. 10.1016/0968-0896(96)00119-8 · DOI
  25. 10.1021/bi00087a005 · DOI
  26. 10.1107/S2059798317018290 · DOI
  27. 10.1021/bi961693s · DOI
  28. V. Bandarian, R. G. Matthews, “Measurement of energetics of conformational change in cobalamin-dependent methionine synthase” in Methods in Enzymology (Elsevier, 2004), vol. 380, pp. 152–169.
  29. 10.1021/acs.chemrev.6b00790 · DOI
  30. 10.1016/j.cbpa.2022.102232 · DOI
  31. 10.1073/pnas.1133218100 · DOI
  32. J. T. Jarrett, C. W. Goulding, K. Fluhr, S. Huang, R. G. Matthews, “Purification and assay of cobalamin-dependent methionine synthase from Escherichia coli” in Methods in Enzymology (Elsevier, 1997), vol. 281, pp. 196–213.
  33. 10.1016/0003-9861(68)90109-4 · DOI
  34. G. Illava R. E. Gillilan N. Ando Development of in-line anoxic small-angle X-ray scattering and structural characterization of an oxygen-sensing transcriptional regulator. bioRXiv [Preprint] (2023). https://doi.org/10.1101/2023.05.18.541370 (Accessed 6 April 2023). · DOI
  35. 10.1146/annurev-biochem-072020-020231 · DOI
  36. 10.1021/la00021a062 · DOI
  37. 10.1021/ja069124n · DOI
  38. 10.1107/S205225251500202X · DOI
  39. 10.1016/j.jsb.2021.107702 · DOI
  40. 10.1110/ps.072936307 · DOI
  41. 10.1126/science.abj8754 · DOI · Paper page
  42. 10.1016/B978-0-12-804572-5.00039-2 · DOI
  43. 10.1073/pnas.171168898 · DOI
  44. 10.3389/fmolb.2019.00072 · DOI
  45. 10.1021/bi002801k · DOI
  46. M.B. Watkins N. Ando Structure of cobalamin-dependent methionine synthase (MetH) in a resting state. Electron Microscopy Data Bank and Protein Data Bank. https://www.ebi.ac.uk/emdb/EMD-29699. Deposited 6 February 2023. · DOI
  47. M.B. Watkins N. Ando Structure of cobalamin-dependent methionine synthase (MetH) in a resting state. Electron Microscopy Data Bank and Protein Data Bank. https://www.rcsb.org/structure/8G3H. Deposited 6 February 2023. · DOI

Metadata

Authors
Watkins, M. B., Wang, H., Burnim, A., & Ando, N.
Affiliations
  • Princeton University (US)
  • Cornell University (US)
Corresponding author
Ando, Nozomi
Venue
Proceedings of the National Academy of Sciences
Published
2023-06-20
Volume
120
Issue
26
Pages
e2302531120-e2302531120
ISSN
  • 0027-8424 (ISSN-L)
  • 1091-6490
OpenAlex
W4381327660
Cited by
26
References
2
Citations by year
2026: 8 · 2025: 5 · 2024: 6 · 2023: 7
FWCI
1.92
Type
journal article
Language
en
Open access
Locations
  • Proceedings of the National Academy of Sciences (publishedVersion, cc-by-nc-nd)
  • bioRxiv (Cold Spring Harbor Laboratory) (acceptedVersion, cc-by-nc-nd)
  • PubMed Central (publishedVersion, cc-by-nc-nd)
  • PubMed (publishedVersion)
  • PubMed Central (submittedVersion, cc-by-nc-nd)
Funders
HHS | National Institutes of Health (GM100008, GM124847)
Topics
  • Life Sciences › Biochemistry, Genetics and Molecular Biology › Structural Biology › Enzyme Structure and Function
  • Life Sciences › Biochemistry, Genetics and Molecular Biology › Molecular Biology › Protein Structure and Dynamics
  • Health Sciences › Nursing › Nutrition and Dietetics › Folate and B Vitamins Research
Keywords
methamphetamine, conformational switching, enzyme flexibility, 5-methyltetrahydrofolate, flavodoxin, Escherichia coli, one-carbon metabolism, folate cycle, metalloenzymes

About these checks

Registry, retraction, Cites and statistics results are computed, not judged, with one exception: a printed reference that no index lists is read once by a model before it counts as a citation error. Claims are extracted by a model and kept only when their quote appears verbatim in the text; each cited source is then checked, with a model’s help, for whether it says what the claim relies on. Those verdicts can be wrong — read the claim’s quote and the cited source before relying on one.

Statistics and arithmetic are recomputed, not judged.

Confidence bands are shown only for fields calibrated on our annotated test set. None is calibrated yet, so no band is shown.

What counts as a claim ›How we measure confidence ›How we check this ›

Are you an author, or do you see a problem with this page? Request a review