

Interpersonal heart rate synchrony predicts effective information processing in a naturalistic group decision-making task
Open accessPublished version of a preprint
The DOI matches its Crossref record; 78 of the 79 references it cites were found in a registry or an index, and 1 are not checked yet.
Abstract
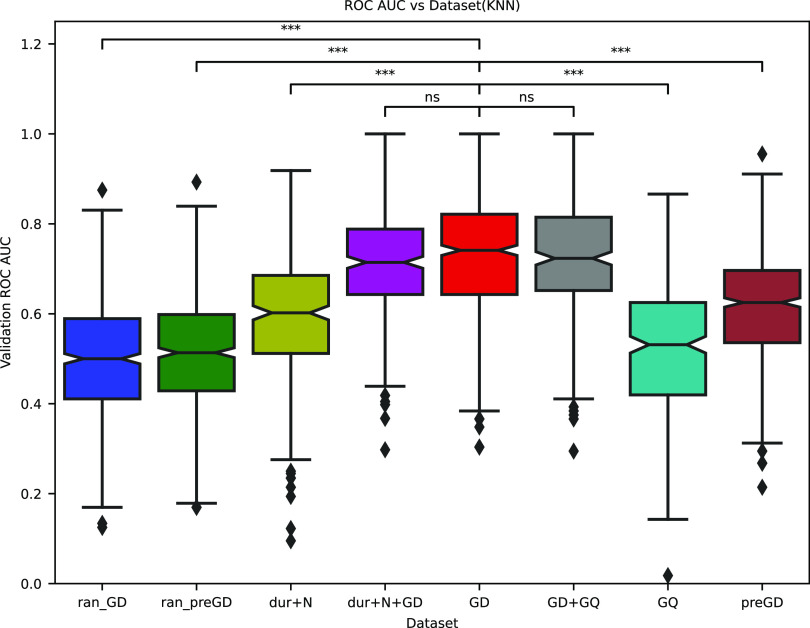
Groups often outperform individuals in problem-solving. Nevertheless, failure to critically evaluate ideas risks suboptimal outcomes through so-called groupthink. Prior studies have shown that people who hold shared goals, perspectives, or understanding of the environment show similar patterns of brain activity, which itself can be enhanced by consensus-building discussions. Whether shared arousal alone can predict collective decision-making outcomes, however, remains unknown. To address this gap, we computed interpersonal heart rate synchrony, a peripheral index of shared arousal associated with joint attention, empathic accuracy, and group cohesion, in 44 groups (n = 204) performing a collective decision-making task. The task required critical examination of all available information to override inferior, default options and make the right choice. Using multidimensional recurrence quantification analysis (MdRQA) and machine learning, we found that heart rate synchrony predicted the probability of groups reaching the correct consensus decision with >70% cross-validation accuracy–significantly higher than that predicted by the duration of discussions, subjective assessment of team function or baseline heart rates alone. We propose that heart rate synchrony during group discussion provides a biomarker of interpersonal engagement that facilitates adaptive learning and effective information sharing during collective decision-making.
Overview
The claims and statistics of this paper haven’t been checked yet.
Free: it reads the open-access text and checks the first 5 claims that cite a source we can check. Create a free account to check every claim.
Integrity signals
Registry
Cites
Statistics
Figures


Verification
Claims the paper makes
The claims and statistics of this paper haven’t been checked yet.
Free: it reads the open-access text and checks the first 5 claims that cite a source we can check. Create a free account to check every claim.
Self-check
Percentages, sums and reported differences re-computed from the paper’s own numbers.
The self-check needs the paper’s full text.
Citations
Cites
Statistical Power Analysis for the Behavioral Sciences
Muller, K. (1989) · Technometrics · doi:10.1080/00401706.1989.10488618 · Cited by 99,167
Psychological Safety and Learning Behavior in Work Teams
Edmondson, A. (1999) · Administrative Science Quarterly · doi:10.2307/2666999 · Cited by 12,026 · cited 3×
“However, continuous ECG data (as opposed to discrete beats per minute) could allow use of more sensitive physiological measures like heart rate variability (HRV) to better characterize physiological dynamics associated with effective group outcomes.”
Recurrence plots for the analysis of complex systems
MARWAN, N., CARMENROMANO, M., THIEL, M., & KURTHS, J. (2007) · Physics Reports · doi:10.1016/j.physrep.2006.11.001 · Cited by 3,814
Determining embedding dimension for phase-space reconstruction using a geometrical construction
Kennel, M. B., Brown, R., & Abarbanel, H. D. I. (1992) · Physical Review A · doi:10.1103/physreva.45.3403 · Cited by 3,776 · cited 1×
“…used the mode of the MdRQA variable distributions for further analysis since it has been independently shown to be more robust to noise levels in the signal while discriminating between the states of a dynamical system with cross-validation accuracy higher than chance (Thaikkandi & Sharika, 2023).”
Evidence for a Collective Intelligence Factor in the Performance of Human Groups
Woolley, A. W., Chabris, C. F., Pentland, A., Hashmi, N., & Malone, T. W. (2010) · Science · doi:10.1126/science.1193147 · Cited by 2,685
Nonlinear Time Series Analysis
Kantz, H., & Schreiber, T. (2003) · Cambridge University Press eBooks · doi:10.1017/cbo9780511755798 · Cited by 2,629
Dynamical Systems and Turbulence
Takens, F. (1981) · Medical Entomology and Zoology · Cited by 2,142
Stasser, G., & Titus, W. (1985) · Journal of Personality and Social Psychology · doi:10.1037/0022-3514.48.6.1467 · Cited by 1,850 · cited 2×
“We addressed this gap by examining heart rate data from 44 three-to-six member groups performing a collective decision-making task based on the Hidden Profile Paradigm, in which information is distributed unequally among group members and must be evaluated critically to reach the correct consensus decision.”
Dynamical assessment of physiological systems and states using recurrence plot strategies
Webber, C. L., & Zbilut, J. P. (1994) · Journal of Applied Physiology · doi:10.1152/jappl.1994.76.2.965 · Cited by 1,415 · cited 1×
“Multi-dimensional Recurrence Quantification Analysis (MdRQA): Recurrent quantification analysis (RQA) quantifies the pattern of recurrence (or how often a particular value is repeated over time) in the phase space of a dynamic system (Webber Jr & Zbilut, 1994; Marwan, Wessel, et al., 2002).”
Brain-to-brain coupling: a mechanism for creating and sharing a social world
Hasson, U., Ghazanfar, A. A., Galantucci, B., Garrod, S., & Keysers, C. (2012) · Trends in Cognitive Sciences · doi:10.1016/j.tics.2011.12.007 · Cited by 1,140
Research works printed but not linked: 2
- 10.1037/0022-3514.57.1.67 · doi:10.1037/0022-3514.57.1.67 · Paper page
- 10.1037/0022-3514.63.3.426 · doi:10.1037/0022-3514.63.3.426 · Paper page
Cited by
Wienhold, S., Bär, L., Ringleb, Z., Zirpel, V., Gomolla, A., Denk, B., Volkmer, N., Gaertner, R. J., Klink, E. S. C., & Pruessner, J. C. (2025) · Journal of Neural Transmission · doi:10.1007/s00702-025-02947-7 · Cited by 13
Validity of the Polar H10 for Continuous Measures of Heart Rate and Heart Rate Synchrony Analysis
Chung, V., Chopin, L., Karadayi, J., & Grèzes, J. (2026) · Sensors · doi:10.3390/s26030855 · Cited by 10
“…and signal stability than PPG finger monitors in contexts involving participant movement [18]. https://doi.org/10.3390/s26030855 Leveraging these advantages, more recent studies have employed Polar H10 devices to measure HR and quantify synchrony during group decision-making tasks [8,20].”
InfluentialThe neurosociological paradigm of the metaverse
Maslova, O., Shusharina, N. N., & Pyatin, V. F. (2025) · Frontiers in Psychology · doi:10.3389/fpsyg.2024.1371876 · Cited by 10
Environmental effects on inter-brain coupling: a systematic review
Leahy, O., Kontaris, E., Gunasekara, N., Hirsch, J., & Tachtsidis, I. (2025) · Frontiers in Human Neuroscience · doi:10.3389/fnhum.2025.1627457 · Cited by 6
“For example, synchrony of pupil diameter as well as heart rate has been shown to increase during joint attention (Wohltjen and Wheatley, 2021; Flory et al., 2023; Sharika et al., 2024).”
Zhao, H., & Zhang, F. (2025) · International Journal of Decision Support System Technology · doi:10.4018/ijdsst.368248 · Cited by 5
“These methods use different mathematical models and algorithms to help decision-makers integrate information and rank alternatives in complex multi-attribute scenarios (Sharika et al., 2024; Shen et al., 2024; Stolle et al., 2024).”
Metadata
- Authors
- Sharika, K. M., Thaikkandi, S., Nivedita, & Platt, M. L.
- Affiliations
- Indian Institute of Technology Kanpur (IN)
- Department of Material Science & Engineering, Indian Institute of Technology Kanpur, Kanpur, Uttar Pradesh 208016, India
- University of Pennsylvania (US)
- Corresponding author
- Sharika, K. M.
- Venue
- Proceedings of the National Academy of Sciences
- Publisher
- National Academy of Sciences
- Published
- 2024-05-16
- Volume
- 121
- Issue
- 21
- Pages
- e2313801121-e2313801121
- ISSN
- 0027-8424 (ISSN-L)
- 1091-6490
- PMC
- PMC11127007
- OpenAlex
- W4396950431
- Cited by
- 33
- References
- 79
- Citations by year
- 2026: 16 · 2025: 15 · 2024: 2
- FWCI
- 9.93
- Type
- journal article
- Language
- en
- Open access
- hybrid
- doi.org
- Licence
- Locations
- Proceedings of the National Academy of Sciences (publishedVersion, cc-by-nc-nd)
- bioRxiv (Cold Spring Harbor Laboratory) (acceptedVersion, cc-by-nd)
- PubMed Central (publishedVersion, cc-by-nc-nd)
- PubMed (publishedVersion)
- PubMed Central (submittedVersion, cc-by-nd)
- Funders
- University of Pennsylvania
- Indian Institute of Technology Kanpur
- National Institute on Aging (R21AG073958)
- National Institute of Mental Health (R01MH118203, R01MH095894, R56MH122819, R37MH109728, R01MH108627)
- National Institute of Neurological Disorders and Stroke (R01NS123054)
- Topics
- Health Sciences › Medicine › Cardiology and Cardiovascular Medicine › Heart Rate Variability and Autonomic Control
- Social Sciences › Psychology › Social Psychology › Team Dynamics and Performance
- Social Sciences › Psychology › Social Psychology › Action Observation and Synchronization
- Keywords
- group decision making, groupthink, consensus building, joint attention, empathic accuracy, group cohesion, interpersonal engagement, adaptive learning, information sharing
About these checks
Registry, retraction, Cites and statistics results are computed, not judged, with one exception: a printed reference that no index lists is read once by a model before it counts as a citation error. Claims are extracted by a model and kept only when their quote appears verbatim in the text; each cited source is then checked, with a model’s help, for whether it says what the claim relies on. Those verdicts can be wrong — read the claim’s quote and the cited source before relying on one.
Statistics and arithmetic are recomputed, not judged.
Confidence bands are shown only for fields calibrated on our annotated test set. None is calibrated yet, so no band is shown.
What counts as a claim ›How we measure confidence ›How we check this ›
Are you an author, or do you see a problem with this page? Request a review
How to cite
Cite CoChat for the checks on this page, and the paper for its own findings.
- This page
- CoChat. (2026). Citation check: Interpersonal heart rate synchrony predicts effective information processing in a naturalistic group decision-making task. https://app.cochat.ai/papers/10.1073/pnas.2313801121
- The paper
- Sharika, K. M., Thaikkandi, S., Nivedita, & Platt, M. L. (2024). Interpersonal heart rate synchrony predicts effective information processing in a naturalistic group decision-making task. Proceedings of the National Academy of Sciences. https://doi.org/10.1073/pnas.2313801121
Data sources
Bibliographic data: Semantic Scholar, OpenAlex, Crossref.
Contains information from the Semantic Scholar Academic Graph Datasets, made available under the ODC Attribution License (ODC-BY 1.0).
Semantic Scholar’s data is described in: Kinney, R., et al. (2023). The Semantic Scholar Open Data Platform. arXiv:2301.10140.
