

The DOI matches its Crossref record; 86 of the 86 references it cites were found in a registry or an index; none of the 21 sources its claims cite is checked for support yet.
The emergence of economic rationality of GPT
Open accessAbstract
As large language models (LLMs) like GPT become increasingly prevalent, it is essential that we assess their capabilities beyond language processing. This paper examines the economic rationality of GPT by instructing it to make budgetary decisions in four domains: risk, time, social, and food preferences. We measure economic rationality by assessing the consistency of GPT’s decisions with utility maximization in classic revealed preference theory. We find that GPT’s decisions are largely rational in each domain and demonstrate higher rationality score than those of human subjects in a parallel experiment and in the literature. Moreover, the estimated preference parameters of GPT are slightly different from human subjects and exhibit a lower degree of heterogeneity. We also find that the rationality scores are robust to the degree of randomness and demographic settings such as age and gender but are sensitive to contexts based on the language frames of the choice situations. These results suggest the potential of LLMs to make good decisions and the need to further understand their capabilities, limitations, and underlying mechanisms.
Overview
AI snapshot
Written from the paper’s full text.
TL;DR
GPT-3.5-Turbo made risk, time, social, and food decisions that were mostly consistent with utility maximization and often scored higher than human decisions. Its rationality was robust to temperature and demographic prompts but dropped under alternative price framing and discrete choice formats.
Key findings
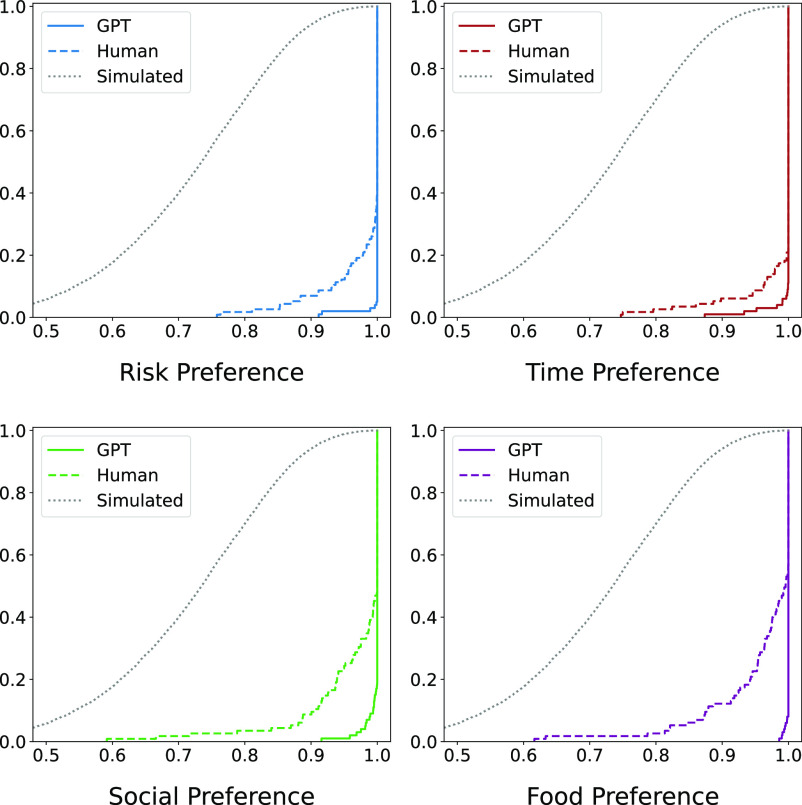
- In the baseline, 95, 89, 81, and 92 out of 100 GPT observations for risk, time, social, and food preferences had no GARP violations; average CCEI was 0.998, 0.997, 0.997, and 0.999, versus human averages of 0.980, 0.985, 0.967, and 0.963 (P < 0.01).
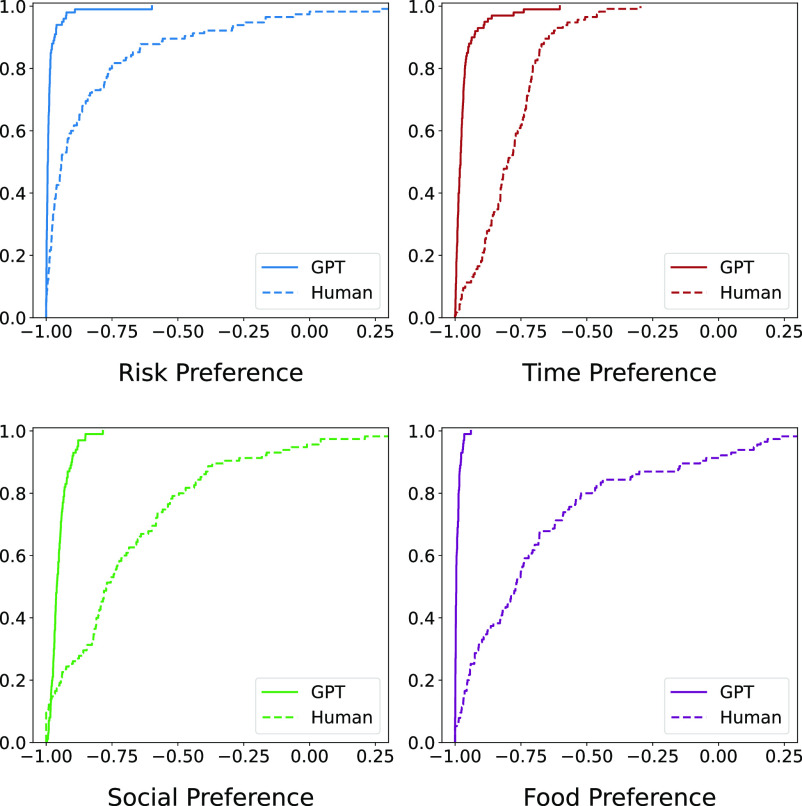
- GPT was more responsive to price changes than humans: mean Spearman correlations of ln(xA/xB) and ln(pA/pB) were −0.984, −0.966, −0.951, and −0.992 for risk, time, social, and food, versus −0.826, −0.788, −0.681, and −0.673 for humans (P < 0.01).
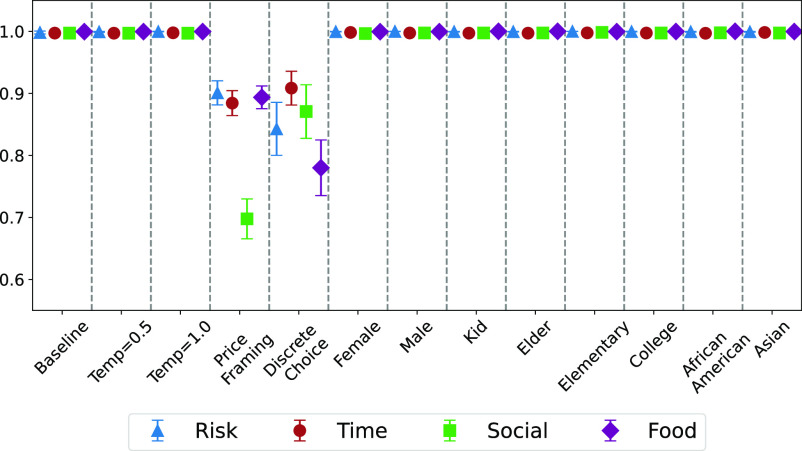
- Rationality was similar at temperature 0.5 and 1, though invalid response rates were 4.7% and 9.8%; alternative price framing reduced average CCEI to 0.901, 0.884, 0.698, and 0.894, and discrete choice reduced it to 0.843, 0.908, 0.871, and 0.780 across the four domains.
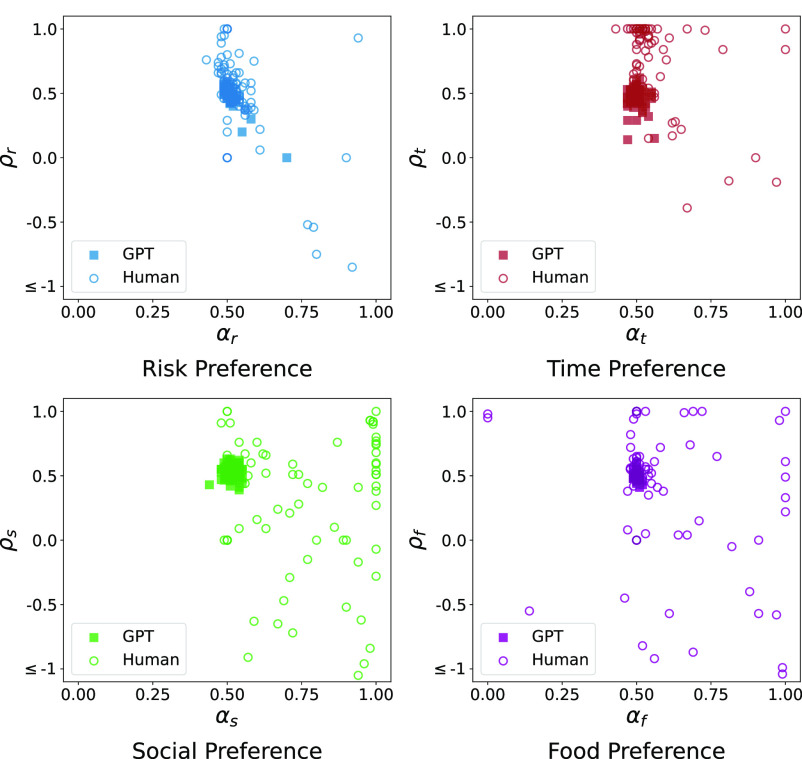
- GPT’s estimated preference parameters differed slightly from humans and showed substantially higher homogeneity; demographic prompts did not significantly affect CCEI, price responsiveness, or estimated parameters.
Methods
- GPT-3.5-Turbo was accessed via OpenAI API and instructed to allocate 100 points between two commodities across 25 budget tasks in four domains: risk, time, social, and food. Each domain was repeated 100 times, yielding 10,000 tasks; baseline temperature was 0, with variations at 0.5 and 1, price framing, discrete choice, and demographic prompts.
- A parallel human experiment used 347 subjects from a representative US sample, randomly assigned to baseline, price framing, and discrete choice conditions; the experiment was pre-registered and IRB-approved.
- Rationality was measured using GARP and the critical cost efficiency index (CCEI), with robustness checks using HMI, MPI, and MCI; preference parameters were structurally estimated using nonlinear tobit maximum likelihood.
Limitations
- The paper states it does not explore mechanisms behind GPT’s choices, including why responses are sensitive to context and framing; it suggests possible corpus-based heuristics, insufficient training on alternative frames, or spurious correlations.
- The paper states it uses a narrow revealed-preference definition of economic rationality and a simple two-commodity experimental environment, so broader and more realistic settings remain untested.
- The paper states demographic insensitivity may reflect hyperaccuracy distortion from alignment efforts; the text also makes evident that only GPT-3.5-Turbo was studied, and higher-temperature analyses were conditional on valid responses.
Model-written summary. Check it against the paper before relying on it.
Integrity signals
Registry
Cites
Statistics
Figures
Verification
Claims the paper makes
49 Own result · 13 Own interpretation · 10 Not checked yet · 7 Own method
A result the paper reports from its own data — it cites no other source for it, so there is none to check. The quote shows it is in the paper.
In the paper
“The performance is affected by the way questions are framed, but not by settings of demographic information and randomness.”
§ The emergence of economic rationality of GPT > Abstract
plain- Asserted: passes — The authors put it forward as true.
- Checkable: passes — It can be checked against evidence.
- Load-bearing: passes — The paper’s conclusions depend on it.
- Based: passes — The paper gives a reason why it holds.
A result the paper reports from its own data — it cites no other source for it, so there is none to check. The quote shows it is in the paper.
In the paper
“However, the level of rationality drops significantly when we employ a different price framing and when we use a discrete choice setting.”
- Also stated in: § Abstract · plain
“We observe that rationality decreases when alternative price framing or discrete choice are used.”
§ The emergence of economic rationality of GPT > Abstract
plaindirect- Asserted: passes — The authors put it forward as true.
- Checkable: passes — It can be checked against evidence.
- Load-bearing: passes — The paper’s conclusions depend on it.
- Based: passes — The paper gives a reason why it holds.
- Also stated in: § Abstract · plain
A result the paper reports from its own data — it cites no other source for it, so there is none to check. The quote shows it is in the paper.
In the paper
“Moreover, the estimated preference parameters of GPT, compared to those of human subjects, are slightly different and exhibit a substantially higher degree of homogeneity.”
- Also stated in: § Abstract · plain
“We find that the estimated preference parameters of GPT have some minor distinctions from human subjects and show a substantially higher degree of homogeneity.”
§ The emergence of economic rationality of GPT > Abstract
plain- Asserted: passes — The authors put it forward as true.
- Checkable: passes — It can be checked against evidence.
- Load-bearing: unclear — It is unclear whether the paper’s conclusions depend on it.
- Based: passes — The paper gives a reason why it holds.
- The authors state this as an assumption: For risk and time preferences, the underlying utility function is U(x1,x2)=αu(x1)+(1−α)u(x2), where u(z)=1/ρ z^ρ for ρ≤1, ρ≠0, and ln(z) for ρ=0.
- Also stated in: § Abstract · plain
A result the paper reports from its own data — it cites no other source for it, so there is none to check. The quote shows it is in the paper.
In the paper
“However, the level of rationality drops significantly when we employ a different price framing and when we use a discrete choice setting.”
- Also stated in: § Abstract · plain
“We observe that rationality decreases when alternative price framing or discrete choice are used.”
§ The emergence of economic rationality of GPT > Abstract
plaindirect- Asserted: passes — The authors put it forward as true.
- Checkable: passes — It can be checked against evidence.
- Load-bearing: passes — The paper’s conclusions depend on it.
- Based: passes — The paper gives a reason why it holds.
- Also stated in: § Abstract · plain
A result the paper reports from its own data — it cites no other source for it, so there is none to check. The quote shows it is in the paper.
In the paper
“Furthermore, we find that GPT’s rationality scores are consistent across different demographic characteristics and invariant to the specification of the randomness of GPT.”
§ The emergence of economic rationality of GPT > Abstract
plain- Asserted: passes — The authors put it forward as true.
- Checkable: passes — It can be checked against evidence.
- Load-bearing: passes — The paper’s conclusions depend on it.
- Based: passes — The paper gives a reason why it holds.
A result the paper reports from its own data — it cites no other source for it, so there is none to check. The quote shows it is in the paper.
In the paper
“Furthermore, we find that GPT’s rationality scores are consistent across different demographic characteristics and invariant to the specification of the randomness of GPT.”
§ The emergence of economic rationality of GPT > Abstract
plain- Asserted: passes — The authors put it forward as true.
- Checkable: passes — It can be checked against evidence.
- Load-bearing: unclear — It is unclear whether the paper’s conclusions depend on it.
- Based: passes — The paper gives a reason why it holds.
A result the paper reports from its own data — it cites no other source for it, so there is none to check. The quote shows it is in the paper.
In the paper
“The performance is affected by the way questions are framed, but not by settings of demographic information and randomness.”
§ The emergence of economic rationality of GPT > Abstract
plain- Asserted: passes — The authors put it forward as true.
- Checkable: passes — It can be checked against evidence.
- Load-bearing: passes — The paper’s conclusions depend on it.
- Based: passes — The paper gives a reason why it holds.
A result the paper reports from its own data — it cites no other source for it, so there is none to check. The quote shows it is in the paper.
In the paper
“The performance is affected by the way questions are framed, but not by settings of demographic information and randomness.”
§ The emergence of economic rationality of GPT > Abstract
plaindirect- Asserted: passes — The authors put it forward as true.
- Checkable: passes — It can be checked against evidence.
- Load-bearing: passes — The paper’s conclusions depend on it.
- Based: passes — The paper gives a reason why it holds.
A result the paper reports from its own data — it cites no other source for it, so there is none to check. The quote shows it is in the paper.
In the paper
“Moreover, the estimated preference parameters of GPT, compared to those of human subjects, are slightly different and exhibit a substantially higher degree of homogeneity.”
- Also stated in: § Abstract · plain
“We find that the estimated preference parameters of GPT have some minor distinctions from human subjects and show a substantially higher degree of homogeneity.”
§ The emergence of economic rationality of GPT > Abstract
plaincorrelational- Asserted: passes — The authors put it forward as true.
- Checkable: passes — It can be checked against evidence.
- Load-bearing: passes — The paper’s conclusions depend on it.
- Based: passes — The paper gives a reason why it holds.
- The authors state this as an assumption: For risk and time preferences, the underlying utility function is U(x1,x2)=αu(x1)+(1−α)u(x2), where u(z)=1/ρ z^ρ for ρ≤1, ρ≠0, and ln(z) for ρ=0.
- Also stated in: § Abstract · plain
A result the paper reports from its own data — it cites no other source for it, so there is none to check. The quote shows it is in the paper.
In the paper
“and is less fond of meat (αf: 0.583 vs. 0.501) and more efficiency-orientated (ρf: 0.386 vs. 0.491) in food preference.”
§ The emergence of economic rationality of GPT > Results > Results from the Baseline Condition.
plain- Asserted: passes — The authors put it forward as true.
- Checkable: passes — It can be checked against evidence.
- Load-bearing: unclear — It is unclear whether the paper’s conclusions depend on it.
- Based: passes — The paper gives a reason why it holds.
- It may state two separate claims as one. 26
- Probably not a substantial claim. 12
A result the paper reports from its own data — it cites no other source for it, so there is none to check. The quote shows it is in the paper.
In the paper
“We show that GPT’s decisions are mostly rational and even score higher than human decisions.”
- Also stated in: § Abstract · boosted
“We find that GPT demonstrates a high level of rationality in all four decision-making tasks concerning risk, time, social, and food, and it outperforms human subjects in the rationality score documented in both our human subject experiment and those reported in the literature.”
§ The emergence of economic rationality of GPT > Abstract
boostedcorrelational- Asserted: passes — The authors put it forward as true.
- Checkable: passes — It can be checked against evidence.
- Load-bearing: passes — The paper’s conclusions depend on it.
- Based: passes — The paper gives a reason why it holds.
It may state two separate claims as one.
- Also stated in: § Abstract · boosted
A result the paper reports from its own data — it cites no other source for it, so there is none to check. The quote shows it is in the paper.
In the paper
“Fig. 2 further illustrates that GPT observations always have negative Spearman’s correlation coefficients, while human has a lower proportion having negative Spearman’s correlation coefficients (96.1% on average).”
§ The emergence of economic rationality of GPT > Results > Results from the Baseline Condition.
plaincorrelational- Asserted: passes — The authors put it forward as true.
- Checkable: passes — It can be checked against evidence.
- Load-bearing: passes — The paper’s conclusions depend on it.
- Based: passes — The paper gives a reason why it holds.
It may state two separate claims as one.
A result the paper reports from its own data — it cites no other source for it, so there is none to check. The quote shows it is in the paper.
In the paper
“The average CCEI is 0.998, 0.997, 0.997, and 0.999 for risk, time, social, and food preferences, respectively.”
§ The emergence of economic rationality of GPT > Results > Results from the Baseline Condition.
plain- Asserted: passes — The authors put it forward as true.
- Checkable: passes — It can be checked against evidence.
- Load-bearing: passes — The paper’s conclusions depend on it.
- Based: passes — The paper gives a reason why it holds.
It may state two separate claims as one.
A result the paper reports from its own data — it cites no other source for it, so there is none to check. The quote shows it is in the paper.
In the paper
“For GPT observations, the coefficients for risk, time, social, and food preferences have a mean of −0.984, −0.966, −0.951, and −0.992, while these are −0.826, −0.788, −0.681, and −0.673 for human subjects, respectively.”
§ The emergence of economic rationality of GPT > Results > Results from the Baseline Condition.
plaincorrelational- Asserted: passes — The authors put it forward as true.
- Checkable: passes — It can be checked against evidence.
- Load-bearing: passes — The paper’s conclusions depend on it.
- Based: passes — The paper gives a reason why it holds.
It may state two separate claims as one.
A result the paper reports from its own data — it cites no other source for it, so there is none to check. The quote shows it is in the paper.
In the paper
“We find that as the randomness increases, the level of rationality is similar to that in the baseline condition (Fig. 4).”
- Also stated in: § Discussion · plain
“We also observe that increasing the randomness of GPT does not significantly impact its performance.”
§ The emergence of economic rationality of GPT > Results > Results from the Conditions with Variations.
plain- Asserted: passes — The authors put it forward as true.
- Checkable: passes — It can be checked against evidence.
- Load-bearing: passes — The paper’s conclusions depend on it.
- Based: passes — The paper gives a reason why it holds.
It may state two separate claims as one.
- Also stated in: § Discussion · plain
A result the paper reports from its own data — it cites no other source for it, so there is none to check. The quote shows it is in the paper.
In the paper
“We find that 95, 89, 81, and 92 out of 100 GPT observations for risk, time, social, and food preferences exhibit no violations of GARP; that is, CCEI equals 1.”
§ The emergence of economic rationality of GPT > Results > Results from the Baseline Condition.
plain- Asserted: passes — The authors put it forward as true.
- Checkable: passes — It can be checked against evidence.
- Load-bearing: passes — The paper’s conclusions depend on it.
- Based: passes — The paper gives a reason why it holds.
It may state two separate claims as one.
A result the paper reports from its own data — it cites no other source for it, so there is none to check. The quote shows it is in the paper.
In the paper
“Consistent with the observations based on CCEI, results from these indices show that GPT observations exhibit a high level of rationality across the four preference domains and surpass those of human subjects across all domains (P<0.1, two-sided two-sample t-tests).”
§ The emergence of economic rationality of GPT > Results > Results from the Baseline Condition.
plain- Asserted: passes — The authors put it forward as true.
- Checkable: passes — It can be checked against evidence.
- Load-bearing: passes — The paper’s conclusions depend on it.
- Based: passes — The paper gives a reason why it holds.
It may state two separate claims as one.
A result the paper reports from its own data — it cites no other source for it, so there is none to check. The quote shows it is in the paper.
In the paper
“For GPT observations, the coefficients for risk, time, social, and food preferences have a mean of −0.984, −0.966, −0.951, and −0.992, while these are −0.826, −0.788, −0.681, and −0.673 for human subjects, respectively.”
§ The emergence of economic rationality of GPT > Results > Results from the Baseline Condition.
plaincorrelational- Asserted: passes — The authors put it forward as true.
- Checkable: passes — It can be checked against evidence.
- Load-bearing: passes — The paper’s conclusions depend on it.
- Based: passes — The paper gives a reason why it holds.
It may state two separate claims as one.
A result the paper reports from its own data — it cites no other source for it, so there is none to check. The quote shows it is in the paper.
In the paper
“Meanwhile, in our human experiment, the average CCEI among human subjects is 0.980, 0.985, 0.967, and 0.963 for risk, time, social, and food preferences, respectively.”
§ The emergence of economic rationality of GPT > Results > Results from the Baseline Condition.
plain- Asserted: passes — The authors put it forward as true.
- Checkable: passes — It can be checked against evidence.
- Load-bearing: passes — The paper’s conclusions depend on it.
- Based: passes — The paper gives a reason why it holds.
It may state two separate claims as one.
A result the paper reports from its own data — it cites no other source for it, so there is none to check. The quote shows it is in the paper.
In the paper
“Moreover, the downward-sloping demand property is impaired under the alternative price framing, with the key Spearman’s correlation coefficients being −0.053, −0.116, 0.267, and −0.499 for risk, time, social, and food preferences, respectively (SI Appendix, Fig. S24).”
§ The emergence of economic rationality of GPT > Results > Results from the Conditions with Variations.
plaindirect- Asserted: passes — The authors put it forward as true.
- Checkable: passes — It can be checked against evidence.
- Load-bearing: passes — The paper’s conclusions depend on it.
- Based: passes — The paper gives a reason why it holds.
It may state two separate claims as one.
A result the paper reports from its own data — it cites no other source for it, so there is none to check. The quote shows it is in the paper.
In the paper
“Consistently, the Spearman’s correlation coefficients are −0.589, −0.497, −0.519, and −0.533 for risk, time, social, and food preferences (SI Appendix, Fig. S24; P<0.01 when compared to the baseline condition, two-sided two-sample t-tests).”
§ The emergence of economic rationality of GPT > Results > Results from the Conditions with Variations.
plaincorrelational- Asserted: passes — The authors put it forward as true.
- Checkable: passes — It can be checked against evidence.
- Load-bearing: passes — The paper’s conclusions depend on it.
- Based: passes — The paper gives a reason why it holds.
It may state two separate claims as one.
A result the paper reports from its own data — it cites no other source for it, so there is none to check. The quote shows it is in the paper.
In the paper
“Human subjects’ rationality level and the downward-sloping demand property reduce in the discrete setting, compared to the baseline condition (P<0.05, two-sided two-sample t-tests in risk and time preferences).”
§ The emergence of economic rationality of GPT > Results > Results from the Conditions with Variations.
plaindirect- Asserted: passes — The authors put it forward as true.
- Checkable: passes — It can be checked against evidence.
- Load-bearing: passes — The paper’s conclusions depend on it.
- Based: passes — The paper gives a reason why it holds.
It may state two separate claims as one.
A result the paper reports from its own data — it cites no other source for it, so there is none to check. The quote shows it is in the paper.
In the paper
“We find that the alternative price framing also reduces the rationality level and the downward-sloping demand property in the human subjects experiment (P<0.05, two-sided two-sample t-tests in risk and time preferences).”
§ The emergence of economic rationality of GPT > Results > Results from the Conditions with Variations.
plaindirect- Asserted: passes — The authors put it forward as true.
- Checkable: passes — It can be checked against evidence.
- Load-bearing: unclear — It is unclear whether the paper’s conclusions depend on it.
- Based: passes — The paper gives a reason why it holds.
It may state two separate claims as one.
A result the paper reports from its own data — it cites no other source for it, so there is none to check. The quote shows it is in the paper.
In the paper
“Comparing the baseline condition and variations in demographics in the GPT experiment, we find that CCEI values, Spearman’s correlation coefficients of ln(xA/xB) and ln(pA/pB), and estimated preference parameters are all insensitive to variations of demographic factors embedded in the prompts to request responses from GPT (Fig. 4, SI Appendix, Fig. S24 and Tables S2 and S3).”
§ The emergence of economic rationality of GPT > Results > Results from the Conditions with Variations.
plain- Asserted: passes — The authors put it forward as true.
- Checkable: passes — It can be checked against evidence.
- Load-bearing: unclear — It is unclear whether the paper’s conclusions depend on it.
- Based: passes — The paper gives a reason why it holds.
It may state two separate claims as one.
- The authors state this as an assumption: The underlying utility functions commonly employed in prior literature capture risk, time, social, and food preferences.
- The authors state this as an assumption: Risk preference is estimated using a disappointment aversion (DA) functional form.
- The authors state this as an assumption: Time preference is estimated using a time separable period utility function.
A result the paper reports from its own data — it cites no other source for it, so there is none to check. The quote shows it is in the paper.
In the paper
“Remarkably, the average CCEI for risk preference declines to 0.901, with 34% exhibiting a CCEI below 0.9. These values are 0.884 (48%), 0.698 (88%), and 0.894 (49%) for time, social, and food preferences, respectively.”
§ The emergence of economic rationality of GPT > Results > Results from the Conditions with Variations.
plain- Asserted: passes — The authors put it forward as true.
- Checkable: passes — It can be checked against evidence.
- Load-bearing: passes — The paper’s conclusions depend on it.
- Based: passes — The paper gives a reason why it holds.
It may state two separate claims as one.
A result the paper reports from its own data — it cites no other source for it, so there is none to check. The quote shows it is in the paper.
In the paper
“SI Appendix, Figs. S13–S16 show the disordered responses of GPT observations to price changes in the price framing condition, which appear to be flatter compared to those in the baseline condition.”
§ The emergence of economic rationality of GPT > Results > Results from the Conditions with Variations.
hedgedcorrelational- Asserted: passes — The authors put it forward as true.
- Checkable: passes — It can be checked against evidence.
- Load-bearing: unclear — It is unclear whether the paper’s conclusions depend on it.
- Based: passes — The paper gives a reason why it holds.
It may state two separate claims as one.
A result the paper reports from its own data — it cites no other source for it, so there is none to check. The quote shows it is in the paper.
In the paper
“As shown in the figures, these reductions are larger in the GPT experiment than in the human experiment. We also verify this observation through OLS regression analyses (SI Appendix, Table S4).”
§ The emergence of economic rationality of GPT > Results > Results from the Conditions with Variations.
plaincorrelational- Asserted: passes — The authors put it forward as true.
- Checkable: passes — It can be checked against evidence.
- Load-bearing: passes — The paper’s conclusions depend on it.
- Based: passes — The paper gives a reason why it holds.
It may state two separate claims as one.
A result the paper reports from its own data — it cites no other source for it, so there is none to check. The quote shows it is in the paper.
In the paper
“Additionally, 51%, 32%, 33%, and 55% of GPT observations demonstrate a CCEI below 0.9 in risk, time, social, and food preferences, respectively.”
§ The emergence of economic rationality of GPT > Results > Results from the Conditions with Variations.
boosted- Asserted: passes — The authors put it forward as true.
- Checkable: passes — It can be checked against evidence.
- Load-bearing: passes — The paper’s conclusions depend on it.
- Based: passes — The paper gives a reason why it holds.
It may state two separate claims as one.
None of the sources cited for this claim have been checked yet.
In the paper
“These are in contrast to results of our human experiment (SI Appendix, Tables S5 and S6) and prior studies where rationality score and preference have been shown to differ across demographic groups (22, 28, 61).”
§ The emergence of economic rationality of GPT > Results > Results from the Conditions with Variations.
What the sources say
- Not checked yetcites [22] S. Choi, S. Kariv, W. Müller, D. Silverman, Who is (more) rational? Am. Econ. Rev. 104, 1518– 1550 (2014). source
- Not checked yetcites [28] F. Echenique, S. Lee, M. Shum, The money pump as a measure of revealed preference violations. J. Polit. Econ. 119, 1201– 1223 (2011). source
- Not checked yetcites [61] H. M. Von Gaudecker, A. Van Soest, E. Wengström, Heterogeneity in risky choice behavior in a broad population. Am. Econ. Rev. 101, 664– 694 (2011). source
boostedcorrelational- Asserted: passes — The authors put it forward as true.
- Checkable: passes — It can be checked against evidence.
- Load-bearing: passes — The paper’s conclusions depend on it.
- Based: passes — The paper gives a reason why it holds.
It may state two separate claims as one.
What the paper did — it cites no source for this, so there is none to check. The quote shows it is in the paper.
In the paper
“For each question, we simulate 25 times and GPT constantly provides correct answers. This confirms that GPT understands the decision environment.”
§ The emergence of economic rationality of GPT > Methods > Design of the Baseline Condition.
plaindirect- Asserted: passes — The authors put it forward as true.
- Checkable: passes — It can be checked against evidence.
- Load-bearing: passes — The paper’s conclusions depend on it.
- Based: passes — The paper gives a reason why it holds.
It may state two separate claims as one.
None of the sources cited for this claim have been checked yet.
In the paper
“We set the temperature to be 0 in the baseline condition, in which the model gives deterministic answers (7, 9, 10).”
§ The emergence of economic rationality of GPT > Methods > Design of Conditions with Variations.
What the sources say
- Not checked yetcites [7] M. Binz, E. Schulz, Using cognitive psychology to understand GPT-3. Proc. Natl. Acad. Sci. U.S.A. 120, e2218523120 (2023). 36730192 PMC9963545 source
- Not checked yetcites [9] T. Webb, K. J. Holyoak, H. Lu, Emergent analogical reasoning in large language models. Nat. Hum. Behav. 7, 1526– 1541 (2023). 37524930 source
- Not checked yetcites [10] J. J. Horton, Large language models as simulated economic agents: What can we learn from homo silicus? NBER Working Paper (2023). source
plaindirect- Asserted: passes — The authors put it forward as true.
- Checkable: passes — It can be checked against evidence.
- Load-bearing: passes — The paper’s conclusions depend on it.
- Based: passes — The paper gives a reason why it holds.
Probably not a substantial claim.
None of the sources cited for this claim have been checked yet.
In the paper
“This is line with some studies which show that GPT response can be highly sensitive to contexts (7, 10, 45, 47, 48, 49).”
§ The emergence of economic rationality of GPT > Abstract
What the sources say
- Not checked yetcites [7] M. Binz, E. Schulz, Using cognitive psychology to understand GPT-3. Proc. Natl. Acad. Sci. U.S.A. 120, e2218523120 (2023). 36730192 PMC9963545 source
- Not checked yetcites [10] J. J. Horton, Large language models as simulated economic agents: What can we learn from homo silicus? NBER Working Paper (2023). source
- Not checked yetcites [45] A. Borji, A categorical archive of chatGPT failures. arXiv [Preprint] (2023). http://arxiv.org/abs/2302.03494 (Accessed 25 November 2023). source
- Not checked yetcites [47] K. Mahowald., Dissociating language and thought in large language models: A cognitive perspective. arXiv [Preprint] (2023). http://arxiv.org/abs/2301.06627 (Accessed 25 November 2023).
- Not checked yetcites [48] E. Jones, J. Steinhardt, Capturing failures of large language models via human cognitive biases. Adv. Neural Inf. Process. Syst. 35, 11785– 11799 (2022).
- Not checked yetcites [49] J. Brand, A. Israeli, D. Ngwe, Using GPT for market research. Available at SSRN 4395751 (2023). source
plaincorrelational- Asserted: passes — The authors put it forward as true.
- Checkable: passes — It can be checked against evidence.
- Load-bearing: fails — The paper’s conclusions may not depend on it.
- Based: passes — The paper gives a reason why it holds.
Probably not a substantial claim. The paper’s conclusions may not depend on it.
What the paper did — it cites no source for this, so there is none to check. The quote shows it is in the paper.
In the paper
“347 human subjects from a representative US sample are randomly assigned to the baseline, price framing, and discrete choice conditions.”
§ The emergence of economic rationality of GPT > Methods > Design of the Human Experiment.
plainn = 347- Asserted: passes — The authors put it forward as true.
- Checkable: passes — It can be checked against evidence.
- Load-bearing: passes — The paper’s conclusions depend on it.
- Based: passes — The paper gives a reason why it holds.
Probably not a substantial claim.
A conclusion the paper draws from its own results — it cites no other source for it, so there is none to check. The quote shows it is in the paper.
In the paper
“These findings suggest that GPT obtains high rationality score but has some potential limitations in its decision-making abilities.”
§ The emergence of economic rationality of GPT > Abstract
hedged- Asserted: passes — The authors put it forward as true.
- Checkable: passes — It can be checked against evidence.
- Load-bearing: passes — The paper’s conclusions depend on it.
- Based: passes — The paper gives a reason why it holds.
It may state two separate claims as one.
What the paper did — it cites no source for this, so there is none to check. The quote shows it is in the paper.
In the paper
“SI Appendix provides the design and instructions of this pre-registered human experiment (AEARCTR-0011750).”
§ The emergence of economic rationality of GPT > Methods > Design of the Human Experiment.
plain- Asserted: passes — The authors put it forward as true.
- Checkable: passes — It can be checked against evidence.
- Load-bearing: fails — The paper’s conclusions may not depend on it.
- Based: passes — The paper gives a reason why it holds.
Probably not a substantial claim. The paper’s conclusions may not depend on it.
What the paper did — it cites no source for this, so there is none to check. The quote shows it is in the paper.
In the paper
“This experiment was approved by The Institutional Review Board of Finance and Economics Experimental Laboratory in The Wang Yanan Institute of Studies in Economics, Xiamen University (FEEL230701), and all subjects provided informed consent before they started the experiment.”
§ The emergence of economic rationality of GPT > Methods > Design of the Human Experiment.
plain- Asserted: passes — The authors put it forward as true.
- Checkable: passes — It can be checked against evidence.
- Load-bearing: fails — The paper’s conclusions may not depend on it.
- Based: passes — The paper gives a reason why it holds.
Probably not a substantial claim. The paper’s conclusions may not depend on it. It may state two separate claims as one.
None of the sources cited for this claim have been checked yet.
In the paper
“In our discrete setting, (23) shows that a locally non-satiated, strictly monotonic, continuous, and concave utility may violate GARP and demonstrates the need to use the assumption of strong monotonicity (see also ref. 55 for discussions).”
§ The emergence of economic rationality of GPT > Methods > Revealed Preference Analysis.
What the sources say
- Not checked yetcites [23] W. T. Harbaugh, K. Krause, T. R. Berry, GARP for kids: On the development of rational choice behavior. Am. Econ. Rev. 91, 1539– 1545 (2001). source
- Not checked yetcites ref. 55
boostedconditional- Asserted: passes — The authors put it forward as true.
- Checkable: passes — It can be checked against evidence.
- Load-bearing: passes — The paper’s conclusions depend on it.
- Based: passes — The paper gives a reason why it holds.
It may state two separate claims as one.
What the paper did — it cites no source for this, so there is none to check. The quote shows it is in the paper.
In the paper
“We also compute these indices and report the results as robustness checks.”
§ The emergence of economic rationality of GPT > Methods > Revealed Preference Analysis.
plain- Asserted: passes — The authors put it forward as true.
- Checkable: passes — It can be checked against evidence.
- Load-bearing: fails — The paper’s conclusions may not depend on it.
- Based: passes — The paper gives a reason why it holds.
Probably not a substantial claim. The paper’s conclusions may not depend on it.
None of the sources cited for this claim have been checked yet.
In the paper
“SI Appendix, Fig. S1 plots CCEI values documented in prior studies, which range from 0.81 to 0.99 with an average of 0.918.”
§ The emergence of economic rationality of GPT > Results > Results from the Baseline Condition.
plain- Asserted: passes — The authors put it forward as true.
- Checkable: passes — It can be checked against evidence.
- Load-bearing: fails — The paper’s conclusions may not depend on it.
- Based: passes — The paper gives a reason why it holds.
Probably not a substantial claim. The paper’s conclusions may not depend on it.
What the paper did — it cites no source for this, so there is none to check. The quote shows it is in the paper.
In the paper
“We keep the experimental instructions between human subjects and GPT as similar as possible.”
§ The emergence of economic rationality of GPT > Methods > Design of the Human Experiment.
plain- Asserted: passes — The authors put it forward as true.
- Checkable: passes — It can be checked against evidence.
- Load-bearing: passes — The paper’s conclusions depend on it.
- Based: passes — The paper gives a reason why it holds.
Probably not a substantial claim.
In the paper
“Second, our work highlights the potential of large language models like GPT to streamline experimental research and yield new data and insights (10).”
§ The emergence of economic rationality of GPT > Discussion
What the sources say
- Not checked yetcites [10] J. J. Horton, Large language models as simulated economic agents: What can we learn from homo silicus? NBER Working Paper (2023). source
plainconditional- Asserted: passes — The authors put it forward as true.
- Checkable: fails — It may be too vague to check against evidence.
- Load-bearing: passes — The paper’s conclusions depend on it.
- Based: passes — The paper gives a reason why it holds.
Probably not a substantial claim. It may be too vague to check against evidence. It may state two separate claims as one.
A conclusion the paper draws from its own results — it cites no other source for it, so there is none to check. The quote shows it is in the paper.
In the paper
“These results suggest that GPT’s decision-making is more significantly affected by both the framing of prices and discrete choices than human subjects.”
§ The emergence of economic rationality of GPT > Results > Results from the Conditions with Variations.
hedgeddirect- Asserted: passes — The authors put it forward as true.
- Checkable: passes — It can be checked against evidence.
- Load-bearing: passes — The paper’s conclusions depend on it.
- Based: passes — The paper gives a reason why it holds.
It may state two separate claims as one.
In the paper
“For example, our understanding of how LLMs make decisions could help reveal general principles that govern both language intelligence and decision intelligence (70).”
§ The emergence of economic rationality of GPT > Discussion
What the sources say
- Not checked yetcites [70] T. J. Sejnowski, Large language models and the reverse turing test. Neural Comput. 35, 309– 342 (2023). 36746144 PMC10177005 source
hedgedconditional- Asserted: passes — The authors put it forward as true.
- Checkable: fails — It may be too vague to check against evidence.
- Load-bearing: fails — The paper’s conclusions may not depend on it.
- Based: passes — The paper gives a reason why it holds.
Probably not a substantial claim. It may be too vague to check against evidence. The paper’s conclusions may not depend on it.
A conclusion the paper draws from its own results — it cites no other source for it, so there is none to check. The quote shows it is in the paper.
In the paper
“Finally, studying the choice behavior of artificial intelligence can provide an important benchmark for understanding natural intelligence.”
§ The emergence of economic rationality of GPT > Discussion
plainconditional- Asserted: passes — The authors put it forward as true.
- Checkable: fails — It may be too vague to check against evidence.
- Load-bearing: fails — The paper’s conclusions may not depend on it.
- Based: fails — The paper may give no reason why it holds.
Probably not a substantial claim. It may be too vague to check against evidence. The paper’s conclusions may not depend on it. The paper may give no reason why it holds.
A conclusion the paper draws from its own results — it cites no other source for it, so there is none to check. The quote shows it is in the paper.
In the paper
“These findings suggest that randomness increases the stochasticity and creativity in language presentations of GPT, but not the rationality score.”
§ The emergence of economic rationality of GPT > Results > Results from the Conditions with Variations.
hedgeddirect- Asserted: passes — The authors put it forward as true.
- Checkable: passes — It can be checked against evidence.
- Load-bearing: passes — The paper’s conclusions depend on it.
- Based: passes — The paper gives a reason why it holds.
It may state two separate claims as one.
None of the sources cited for this claim have been checked yet.
In the paper
“Second, we focus on economic rationality as defined by revealed preference analysis, whereas rationality is often defined more broadly in the literature to include various decision rules and heuristics (40, 77, 78).”
§ The emergence of economic rationality of GPT > Discussion
What the sources say
- Not checked yetcites [40] D. Kahneman, Maps of bounded rationality: Psychology for behavioral economics. Am. Econ. Rev. 93, 1449– 1475 (2003). source
- Not checked yetcites [77] H. A. Simon, Rational decision making in business organizations. Am. Econ. Rev. 69, 493– 513 (1979).
- Not checked yetcites [78] R. H. Thaler, Behavioral economics: Past, present, and future. Am. Econ. Rev. 106, 1577– 1600 (2016). source
plain- Asserted: passes — The authors put it forward as true.
- Checkable: fails — It may be too vague to check against evidence.
- Load-bearing: fails — The paper’s conclusions may not depend on it.
- Based: passes — The paper gives a reason why it holds.
Probably not a substantial claim. It may be too vague to check against evidence. The paper’s conclusions may not depend on it.
The paper relies on this without support.
The economic rationality of GPT has not been explored in prior work.
“Nevertheless, the rationality of GPT remains unexplored.”
The authors state this as an assumption.
For risk and time preferences, the underlying utility function is U(x1,x2)=αu(x1)+(1−α)u(x2), where u(z)=1/ρ z^ρ for ρ≤1, ρ≠0, and ln(z) for ρ=0.
“For these two domains, we assume that the underlying utility function is given by:U(x1,x2)=αu(x1)+(1−α)u(x2), where the utility function u(z)=1ρzρ,ρ≤1(ρ≠0)ln(z),ρ=0 and α∈[0,1].”
The authors state this as an assumption.
The underlying utility functions commonly employed in prior literature capture risk, time, social, and food preferences.
“Our estimations will be made for each DM separately on the assumption of the underlying utility function commonly employed found in the prior literature to capture risk, time, social, and food preferences.”
The authors state this as an assumption.
Background income is zero.
“with the assumption that background income is zero”
The authors state this as an assumption.
Social preference utility is a member of the CES family.
“we assume that U(xA,xB) is a member of the CES family.”
The authors state this as an assumption.
Food preference utility is a member of the CES family.
“we assume that U(xA,xB) is a member of the CES family.”
The authors state this as an assumption.
Risk preference is estimated using a disappointment aversion (DA) functional form.
“We estimate the risk preference of the DM by a functional form of disappointment aversion (DA) introduced by ref. 57”
The authors state this as an assumption.
Time preference is estimated using a time separable period utility function.
“Following the method of ref. 19, we use a time separable period utility function to estimate the DM’s time preference from intertemporal decisions of the payoff between today and 1 mo later x:(xA,xB), with the assumption that background income is zero”
Claims other papers make about this one
Each is checked against this paper’s own text: does it say what the citing paper says it does?
The cited source doesn’t support the claim as written.
In the citing paper
“Interestingly, there is evidence from several studies showing that, while the previous generation of models frequently exhibited human-like heuristics and biases, they have largely disappeared in the latest generation of LLMs (Chen, Liu, et al., 2023;Hagendorff et al., 2023).”
From Machine Psychology (2023) · cites this paper as Chen, Liu, et al., 2023
Checked by a reasoning model — may be wrong.
Experimental — accuracy not yet measuredIn the citing paper
“In synthesis, these findings suggest that chatbots behavior is similar to human behavior, leading to the suggestion that “GPT could have the potential in assisting human decision-making” (147).”
From The impact of generative artificial intelligence on socioeconomic inequalities and policy making (2024) · cites this paper as [147]
In the citing paper
“One study, for example, suggests LLMs exhibit more rational behavior than humans (65).”
From Can Generative AI improve social science? (2024) · cites this paper as [65]
Self-check
Percentages, sums and reported differences re-computed from the paper’s own numbers.
Each contradiction between two passages listed here was confirmed by an independent check.
Rated minor: it would not touch a result — a value no result rests on, a p-value that stays on the same side of the significance level, or a conflict that is clerical, resolved elsewhere in the paper, or outside its own findings.
In the paper
§ The emergence of economic rationality of GPT > Methods > Structural Estimation for Preferences.
“When ρ→−∞, it approaches to the Leontief utility function min{αx1,(1−α)x2}, which implies that the two payments are perfectly complemented and the DM is equality orientated (18, 25).”
§ The emergence of economic rationality of GPT > Methods > Structural Estimation for Preferences.
“U(x1,x2)=[αx1ρ+(1−α)x2ρ]1ρ,”
Citations
Cites
Vaswani, A., Shazeer, N., Parmar, N., Uszkoreit, J., Jones, L., Gomez, A. N., Kaiser, L., & Polosukhin, I. (2017) · arXiv · doi:10.48550/arxiv.1706.03762 · Cited by 120,404 · cited 1×
“As one of the most representative examples of large language models (LLMs), GPT uses transformer architecture and deep learning techniques to learn from vast web-based text corpora that contain 175 billion parameters (Vaswani et al., 2017; Brown et al., 2020).”
Jakubův, J., Chvalovský, K., Goertzel, Z., et al. (2023) · DROPS (Schloss Dagstuhl – Leibniz Center for Informatics) · doi:10.4230/lipics.itp.2023.19 · Cited by 76,648
Language Models are Few-Shot Learners
Brown, T. B., Mann, B., Ryder, N., Subbiah, M., Kaplan, J., Dhariwal, P., Neelakantan, A., Shyam, P., Sastry, G., Askell, A., et al. (2020) · arXiv · doi:10.48550/arxiv.2005.14165 · Cited by 23,372 · cited 2×
“As one of the most representative examples of large language models (LLMs), GPT uses transformer architecture and deep learning techniques to learn from vast web-based text corpora that contain 175 billion parameters (Vaswani et al., 2017; Brown et al., 2020).”
BackgroundMaps of Bounded Rationality: Psychology for Behavioral Economics
Kahneman, D. (2003) · American Economic Review · doi:10.1257/000282803322655392 · Cited by 5,377 · cited 2×
“Moreover, we incorporate a series of variations in the randomness of GPT, the framing of decision tasks (Kahneman, 2003), the structure of the choice format (McFadden, 2001), and the demographic settings of GPT (Corbett-Davies and Goel, 2018).”
BackgroundMethodSemantics derived automatically from language corpora contain human-like biases
Caliskan, A., Bryson, J. J., & Narayanan, A. (2017) · Science · doi:10.1126/science.aal4230 · Cited by 2,887 · cited 1×
“This may be due to the reflection of biases presented in the existing data (Caliskan et al., 2017; Schramowski et al., 2022),the insufficient training of texts of the alternative contexts and frames (Chen et al.”
BackgroundRational Decision-Making in Business OrganizationsPreprint
Simon, H. A. (1979) · RePEc: Research Papers in Economics · Cited by 2,870
A Note on the Pure Theory of Consumer's Behaviour
Samuelson, P. A. (1938) · Economica · doi:10.2307/2548836 · Cited by 2,342 · cited 1×
“Here we use a classic notion of economic rationality in revealed preference analyses that captures the extent to which a decision maker maximizes some well-behaved utility function for the given budget constraints (Afriat, 1967, 1972; Samuelson, 1938; Varian, 1982, 1990).”
MethodGiving According to GARP: An Experimental Test of the Consistency of Preferences for Altruism
James Andreoni, A., & Miller, J. H. (2002) · Econometrica · doi:10.1111/1468-0262.00302 · Cited by 1,921 · cited 3×
“Prior studies have computed rationality scores based on choice data in risky, intertemporal, and social decision-making in laboratory environments (Andreoni and Miller, 2002; Andreoni and Sprenger, 2012; Ahn et al., 2014; Choi et al., 2007, 2014; Harbaugh et al., 2001; Halevy et al., 2018; Fisman…”
BackgroundMethodEvaluating Large Language Models Trained on Code
Chen, M., Tworek, J., Jun, H., Yuan, Q., Pinto, H. P. D. O., Kaplan, J., Edwards, H., Burda, Y., Joseph, N., Brockman, G., et al. (2021) · arXiv · doi:10.48550/arxiv.2107.03374 · Cited by 1,436 · cited 4×
“For instance, they can generate computer code (Chen et al., 2021), engage in human-like conversations on various topics (Lin et al.”
BackgroundInfluentialRahwan, I., Cebrian, M., Obradovich, N., Bongard, J., Bonnefon, J.-F., Breazeal, C., Crandall, J. W., Christakis, N. A., Couzin, I. D., Jackson, M. O., et al. (2019) · Nature · doi:10.1038/s41586-019-1138-y · Cited by 1,364 · cited 3×
“Our work aligns with recent calls to study machine behavior to “reap their benefits and minimize their harms” (Rahwan et al., 2019).”
BackgroundMethodResult
Research works printed but not linked: 2
- I. Goodfellow, Y. Bengio, A. Courville, Deep Learning (MIT Press, 2016).
- M. Houtman, J. Maks, Determining all maximal data subsets consistent with revealed preference. Kwantitatieve Methoden 19, 89–104 (1985).
Cited by
Sorted by citations
The impact of generative artificial intelligence on socioeconomic inequalities and policy making
Capraro, V., Lentsch, A., Acemoglu, D., Akgun, S., Akhmedova, A., Bilancini, E., Bonnefon, J.-F., Brañas-Garza, P., Butera, L., Douglas, K. M., et al. (2024) · PNAS Nexus · doi:10.1093/pnasnexus/pgae191 · Cited by 371
Can Generative AI improve social science?
Bail, C. A. (2024) · Proceedings of the National Academy of Sciences · doi:10.1073/pnas.2314021121 · Cited by 369
Large language models empowered agent-based modeling and simulation: a survey and perspectives
Gao, C., Lan, X., Li, N., Yuan, Y., Ding, J., Zhou, Z., Xu, F., & Li, Y. (2024) · Humanities and Social Sciences Communications · doi:10.1057/s41599-024-03611-3 · Cited by 294
“Chen et al. (2023e) have employed standard frameworks, revealed preference theory , to simulate the rationality in the economic decisions of GPTs. Results show that GPT performs largely rationally in risk, time, social, and food preferences domains in terms of budgetary decisions.”
A Turing Test of Whether AI Chatbots Are Behaviorally Similar to Humans
Mei, Q., Xie, Y., Yuan, W., & Jackson, M. O. (2024) · Proceedings of the National Academy of Sciences · doi:10.1073/pnas.2313925121 · Cited by 254
Artificial intelligence and consumer behavior: From predictive to generative AI
Hermann, E., & Puntoni, S. (2024) · Journal of Business Research · doi:10.1016/j.jbusres.2024.114720 · Cited by 316
Metadata
- Authors
- Chen, Y., Liu, T. X., Shan, Y., & Zhong, S.
- Affiliations
- Lingnan University (HK)
- Tsinghua University (CN)
- National University of Singapore (SG)
- Corresponding author
- Chen, Yiting
- Liu, Tracy Xiao
- Shan, You
- Zhong, Songfa
- Venue
- Proceedings of the National Academy of Sciences
- Publisher
- National Academy of Sciences
- Published
- 2023-12-12
- Volume
- 120
- Issue
- 51
- Pages
- e2316205120-e2316205120
- ISSN
- 0027-8424 (ISSN-L)
- 1091-6490
- PMC
- PMC10740389
- OpenAlex
- W4389611357
- Semantic Scholar
- de916e9e6f8841dbb73b35615f8d15eba2e9eaf7
- Cited by
- 164
- References
- 70
- Citations by year
- 2026: 48 · 2025: 67 · 2024: 40 · 2023: 8
- FWCI
- 34.05
- Type
- journal article
- Language
- en
- Open access
- hybrid
- doi.org
- Licence
- Locations
- Proceedings of the National Academy of Sciences (publishedVersion, cc-by-nc-nd)
- PubMed Central (publishedVersion, cc-by-nc-nd)
- PubMed (publishedVersion)
- RePEc: Research Papers in Economics (submittedVersion)
- arXiv (Cornell University) (submittedVersion)
- Rare & Special e-Zone (The Hong Kong University of Science and Technology) (submittedVersion)
- arXiv (Cornell University)
- Funders
- MOST | NSFC | National Outstanding Youth Foundation of China (72222005)
- Tsinghua University (2022Z04W01032)
- Hong Kong University of Science and Technology (00000)
- Topics
- Social Sciences › Decision Sciences › General Decision Sciences › Decision-Making and Behavioral Economics
- Social Sciences › Economics, Econometrics and Finance › Economics and Econometrics › Experimental Behavioral Economics Studies
- Social Sciences › Economics, Econometrics and Finance › Economics and Econometrics › Economic and Environmental Valuation
- Keywords
- GPT, large language models, economic rationality, budget decision-making, revealed preference, utility maximization, preference heterogeneity, preference estimation, risk preferences, time preference, social preferences, food preferences
- MeSH terms
- Decision Making, Humans
About these checks
Registry, retraction, Cites and statistics results are computed, not judged, with one exception: a printed reference that no index lists is read once by a model before it counts as a citation error. Claims are extracted by a model and kept only when their quote appears verbatim in the text; each cited source is then checked, with a model’s help, for whether it says what the claim relies on. Those verdicts can be wrong — read the claim’s quote and the cited source before relying on one.
A language model drew the claims from the paper on 2026-10-09, under version 3 of the claim definition (model deepseek-v4.1-flash, prompt extract-v3).
A second model labelled each claim on 2026-10-09 (model jev-1.13-20260917, definition revision gold-guideline-v0.2).
Statistics and arithmetic are recomputed, not judged.
Confidence bands are shown only for fields calibrated on our annotated test set. None is calibrated yet, so no band is shown.
What counts as a claim ›How we measure confidence ›How we check this ›
Are you an author, or do you see a problem with this page? Request a review
