

The DOI matches its Crossref record; 34 of the 34 references it cites were found in a registry or an index.
De Novo DNA Methylation Is Required to Restrict T Helper Lineage Plasticity
Abstract
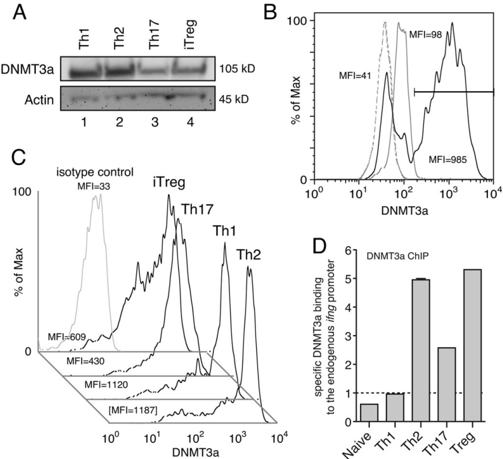
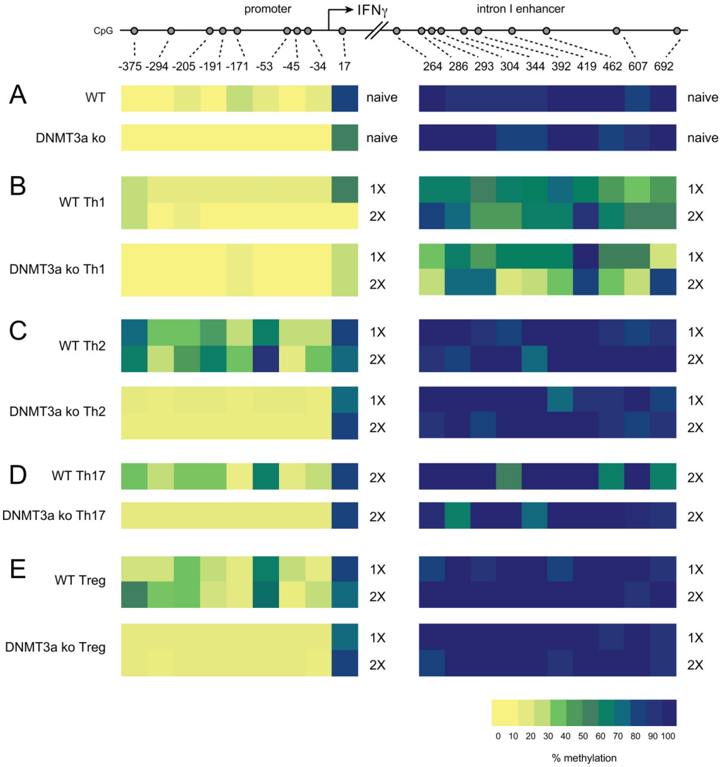
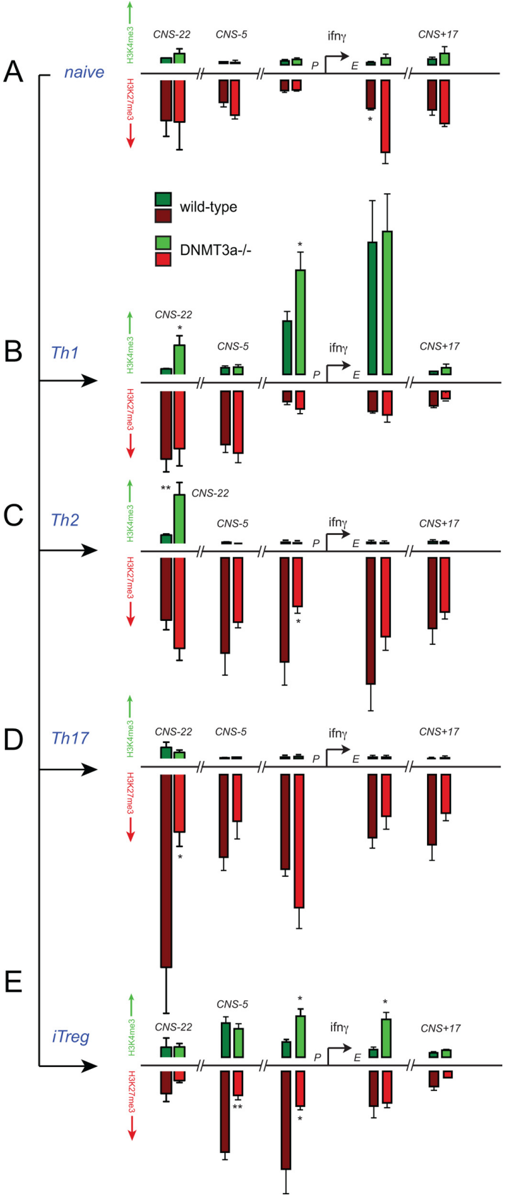
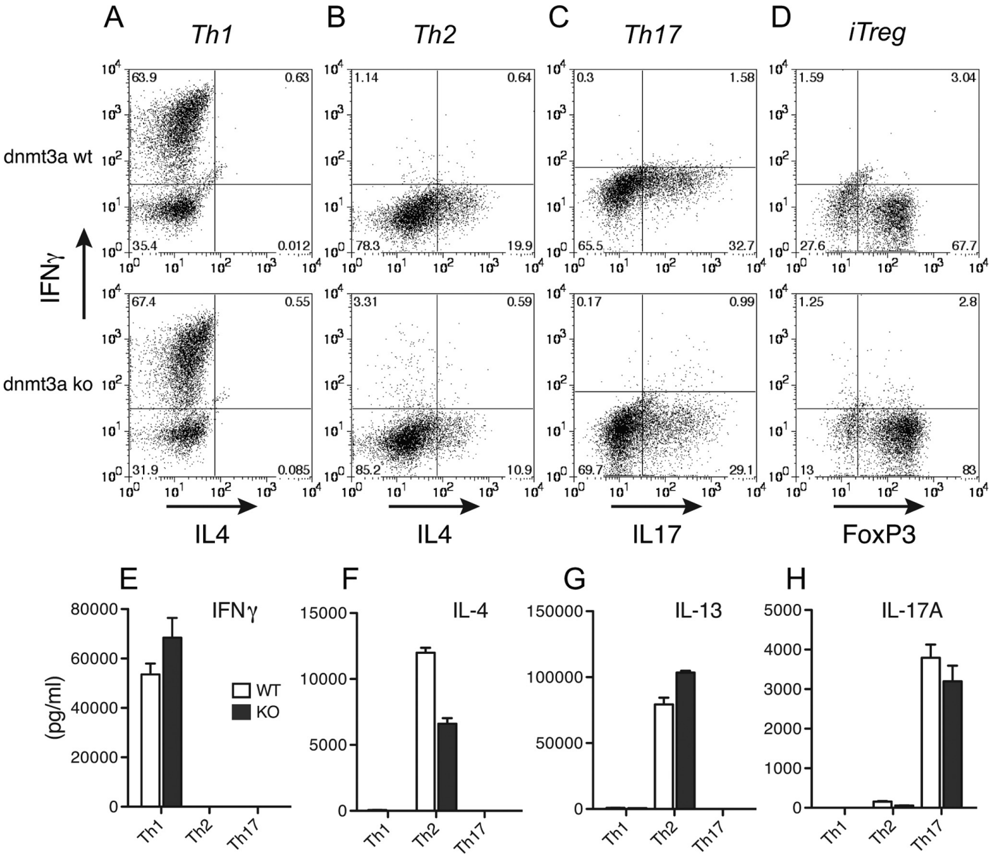
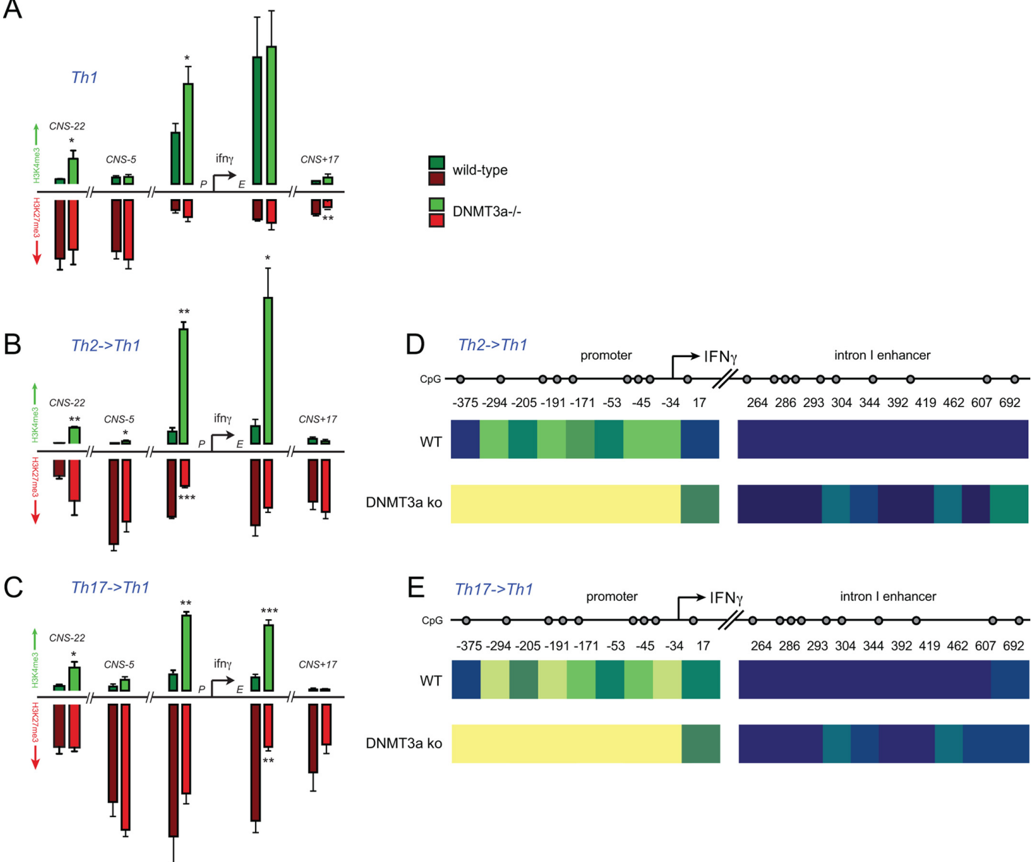
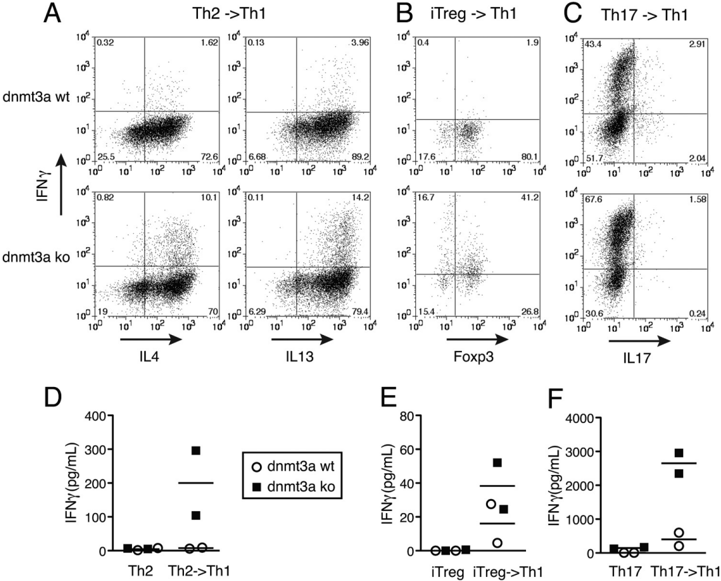
Naïve CD4+ T cells are highly plastic and can differentiate into discrete lineages with unique functions during an immune response. Once differentiated, helper T cells maintain a stable transcriptional memory of their initial lineage choice and resist redifferentiation. During embryogenesis, de novo DNA methylation operates on the hypomethylated genome of the blastocyst to achieve tissue-specific patterns of gene expression. Similarly, the ifn γ promoter is hypomethylated in naïve T cells, but Th2, Th17, and iTreg differentiation is accompanied by substantial de novo DNA methylation at this locus. To determine whether de novo DNA methylation is required to restrict T helper lineage plasticity, we used mice with T cell-specific deletion of the methyltransferase DNMT3a. Induction of lineage-specific cytokines occurred normally in the absence of DNMT3a, however, DNMT3a-deficient Th2, Th17, and iTreg completely failed to methylate the ifn γ promoter. This was accompanied by an increase in the transcriptionally permissive trimethyl H3K4 mark, and a reduction in inhibitory H3K27 methylation at the ifn γ locus. Failed de novo methylation resulted in failed silencing of the ifn γ gene, as DNMT3a-deficient Th2, Th17, and iTreg cells produced significant levels of IFNγ following restimulation in the presence of IL-12. Therefore, DNMT3a-mediated DNA methylation restricts T helper plasticity by establishing an epigenetically silent chromatin structure at regulatory regions of the ifn γ gene. Background: T cells undergo lineage commitment during an immune response and "remember" their lineage choice after the instructive signals cease. Results: T cells lacking a de novo DNA methyltransferase fail to silence the ifn γ gene. Conclusion: DNMT3a opposes T cell trans -differentiation by epigenetically silencing "off-lineage" genes. Significance: The proper control of inflammatory cytokine gene expression is crucial for immune homeostasis.
Overview
The claims and statistics of this paper haven’t been checked yet.
Run the check — free, no account needed. It reads the open-access text and checks the sources it cites.
Integrity signals
Registry
Cites
Statistics
Figures
Verification
Claims the paper makes
The claims and statistics of this paper haven’t been checked yet.
Run the check — free, no account needed. It reads the open-access text and checks the sources it cites.
Claims other papers make about this one
Each is checked against this paper’s own text: does it say what the citing paper says it does?
In the citing paper
“These phenotypic changes correlate with increased expression of the master transcription factors TCF1 (encoded by Tcf7) or EOMES in absence of DNMT3A or TET2, respectively[164][165][166]183,187.”
From Clonal haematopoiesis and dysregulation of the immune system (2023) · cites this paper as [166]
Self-check
Percentages, sums and reported differences re-computed from the paper’s own numbers.
The self-check needs the paper’s full text.
Citations
Cites
Okano, M., Bell, D. W., Haber, D. A., & Li, E. (1999) · Cell · doi:10.1016/s0092-8674(00)81656-6 · Cited by 6,143
A bivalent chromatin structure marks key developmental genes in embryonic stem cells
Bernstein, B. E., Mikkelsen, T. S., Xie, X., Kamal, M., Huebert, D. J., Cuff, J., Fry, B., Meissner, A., Wernig, M., Plath, K., et al. (2006) · Cell · doi:10.1016/j.cell.2006.02.041 · Cited by 5,361
Polycomb complexes repress developmental regulators in murine embryonic stem cells
Boyer, L., Plath, K., Zeitlinger, J., Brambrink, T., Medeiros, L. A., Lee, T., Levine, S., Wernig, M., Tajonar, A., Ray, M. K., et al. (2006) · Nature · doi:10.1038/nature04733 · Cited by 2,738
Genome-scale DNA methylation maps of pluripotent and differentiated cells
Meissner, A., Mikkelsen, T. S., Gu, H., Wernig, M., Hanna, J., Sivachenko, A., Zhang, X., Bernstein, B. E., Nusbaum, C., Jaffe, D. B., et al. (2008) · Nature · doi:10.1038/nature07107 · Cited by 2,536
Linking DNA methylation and histone modification: patterns and paradigms
Cedar, H., & Bergman, Y. (2009) · Nature Reviews Genetics · doi:10.1038/nrg2540 · Cited by 2,267
Cloning and characterization of a family of novel mammalian DNA (cytosine-5) methyltransferases
Okano, M., Xie, S., & Li, E. (1998) · Nature Genetics · doi:10.1038/890 · Cited by 1,719
A Critical Role for Dnmt1 and DNA Methylation in T Cell Development, Function, and Survival
Lee, P. P., Fitzpatrick, D. R., Beard, C., Jessup, H. K., Lehar, S., Makar, K. W., Pérez-Melgosa, M., Sweetser, M. T., Schlissel, M. S., Nguyen, S., et al. (2001) · Immunity · doi:10.1016/s1074-7613(01)00227-8 · Cited by 1,275
Fate mapping of IL-17-producing T cells in inflammatory responses
Hirota, K., Duarte, J. H., Veldhoen, M., Hornsby, E., Li, Y., Cua, D. J., Ahlfors, H., Wilhelm, C., Tolaini, M., Menzel, U., et al. (2011) · Nature Immunology · doi:10.1038/ni.1993 · Cited by 1,176
Wei, G., Wei, L., Zhu, J., Zang, C., Hu-Li, J., Yao, Z., Cui, K., Kanno, Y., Roh, T.-Y., Watford, W. T., et al. (2009) · Immunity · doi:10.1016/j.immuni.2008.12.009 · Cited by 1,152
Late Developmental Plasticity in the T Helper 17 Lineage
Lee, Y. K., Turner, H., Maynard, C. L., Oliver, J. R., Chen, D., Elson, C. O., & Weaver, C. T. (2009) · Immunity · doi:10.1016/j.immuni.2008.11.005 · Cited by 1,053
Bending, D., De La Peña, H., Veldhoen, M., Phillips, J. M., Uyttenhove, C., Stockinger, B., & Cooke, A. (2009) · Journal of Clinical Investigation · doi:10.1172/jci37865 · Cited by 558
Early Transcription and Silencing of Cytokine Genes Underlie Polarization of T Helper Cell Subsets
Grogan, J. L., Mohrs, M., Harmon, B., Lacy, D. A., Sedat, J. W., & Locksley, R. M. (2001) · Immunity · doi:10.1016/s1074-7613(01)00103-0 · Cited by 485
Reversibility of T helper 1 and 2 populations is lost after long-term stimulation.
Murphy, E., Shibuya, K., Hosken, N., Openshaw, P., Maino, V, Davis, K., Murphy, K., & O'Garra, A. (1996) · The Journal of experimental medicine · doi:10.1084/jem.183.3.901 · Cited by 435
An epigenetic view of helper T cell differentiation
Ansel, K. M., Lee, D. U., & Rao, A. (2003) · Nature Immunology · doi:10.1038/ni0703-616 · Cited by 420
Otani, J., Nankumo, T., Arita, K., Inamoto, S., Ariyoshi, M., & Shirakawa, M. (2009) · EMBO reports · doi:10.1038/embor.2009.218 · Cited by 414
Hegazy, A. N., Peine, M., Helmstetter, C., Panse, I., Fröhlich, A., Bergthaler, A., Flatz, L., Pinschewer, D. D., Radbruch, A., & Löhning, M. (2010) · Immunity · doi:10.1016/j.immuni.2009.12.004 · Cited by 340
Hlx is induced by and genetically interacts with T-bet to promote heritable TH1 gene induction
Mullen, A. C., Hutchins, A. S., High, F. A., Lee, H. W., Sykes, K. J., Chodosh, L. A., & Reiner, S. L. (2002) · Nature Immunology · doi:10.1038/ni807 · Cited by 306
Molecular Coupling of DNA Methylation and Histone Methylation
Hashimoto, H., Vertino, P. M., & Cheng, X. (2010) · Epigenomics · doi:10.2217/epi.10.44 · Cited by 286
Independent and Epigenetic Regulation of the Interleukin-4 Alleles in CD4 + T Cells
Bix, M., & Locksley, R. M. (1998) · Science · doi:10.1126/science.281.5381.1352 · Cited by 239
Inhibition of IFN‐γ transcription by site‐specific methylation during T helper cell development
Jones, B. T., & Chen, J. (2006) · The EMBO Journal · doi:10.1038/sj.emboj.7601148 · Cited by 213
Young, H. A., Ghosh, P., Ye, J., Lederer, J. A., Lichtman, A. H., Gerard, J. R., Penix, L. A., Wilson, C. B., Melvin, A. J., McGurn, M. E., et al. (1994) · The Journal of Immunology · doi:10.4049/jimmunol.153.8.3603 · Cited by 204
Penix, L. A., Sweetser, M. T., Weaver, W. M., Hoeffler, J. P., Kerppola, T. K., & Wilson, C. B. (1996) · Journal of Biological Chemistry · doi:10.1074/jbc.271.50.31964 · Cited by 187
Role of DNA Methylation in Stable Gene Repression
Lande‐Diner, L., Zhang, J., Ben‐Porath, I., Amariglio, N., Keshet, I., Hecht, M., Azuara, V., Fisher, A. G., Rechavi, G., & Cedar, H. (2007) · Journal of Biological Chemistry · doi:10.1074/jbc.m607838200 · Cited by 166
DNA Methylation Dictates Histone H3K4 Methylation
Okitsu, C. Y., & Hsieh, C. (2007) · Molecular and Cellular Biology · doi:10.1128/mcb.02291-06 · Cited by 161
Histone tails regulate DNA methylation by allosterically activating de novo methyltransferase
Li, B.-Z., Huang, Z., Cui, Q., Song, X., Du, L., Jeltsch, A., Chen, P., Li, G., Li, E., & Xu, G. (2011) · Cell Research · doi:10.1038/cr.2011.92 · Cited by 148
DNA Methylation Is a Nonredundant Repressor of the Th2 Effector Program
Makar, K. W., & Wilson, C. B. (2004) · The Journal of Immunology · doi:10.4049/jimmunol.173.7.4402 · Cited by 123
Signals from CD28 Induce Stable Epigenetic Modification of the IL-2 Promoter
Thomas, R. M., Gao, L., & Wells, A. D. (2005) · The Journal of Immunology · doi:10.4049/jimmunol.174.8.4639 · Cited by 122
Self-citationCohen, C. J., Crome, S. Q., MacDonald, K. G., Dai, E. L., Mager, D. L., & Levings, M. K. (2011) · The Journal of Immunology · doi:10.4049/jimmunol.1101058 · Cited by 112
Gamper, C. J., Agoston, A. T., Nelson, W. G., & Powell, J. D. (2009) · The Journal of Immunology · doi:10.4049/jimmunol.0802960 · Cited by 100
Self-citationWinders, B. R., Schwartz, R. H., & Bruniquel, D. (2004) · The Journal of Immunology · doi:10.4049/jimmunol.173.12.7377 · Cited by 88
Tong, Y., Aune, T. M., & Boothby, M. R. (2005) · Proceedings of the National Academy of Sciences · doi:10.1073/pnas.0409510102 · Cited by 64
Chang, S., Collins, P. L., & Aune, T. M. (2008) · The Journal of Immunology · doi:10.4049/jimmunol.181.12.8372 · Cited by 51
Long-range regulation of cytokine gene expression
Rowell, E. A., Merkenschlager, M., & Wilson, C. B. (2008) · Current Opinion in Immunology · doi:10.1016/j.coi.2008.03.012 · Cited by 28
Thomas, R. M., Saouaf, S. J., & Wells, A. D. (2007) · Genes and Immunity · doi:10.1038/sj.gene.6364415 · Cited by 20
Self-citation
Cited by
Clonal haematopoiesis and dysregulation of the immune system
Belizaire, R., Wong, W. J., Robinette, M. L., & Ebert, B. L. (2023) · Nature Reviews Immunology · doi:10.1038/s41577-023-00843-3 · Cited by 161
Ladle, B. H., Li, K.-P., Phillips, M. J., Pucsek, A. B., Haile, A., Powell, J. D., Jaffee, E. M., Hildeman, D. A., & Gamper, C. J. (2016) · Proceedings of the National Academy of Sciences · doi:10.1073/pnas.1524490113 · Cited by 152
Self-citation
Metadata
- Authors
- Thomas, R. M., Gamper, C. J., Ladle, B. H., Powell, J. D., & Wells, A. D.
- Venue
- Journal of Biological Chemistry
- Publisher
- Elsevier BV
- Published
- 2012-06
- Volume
- 287
- Issue
- 27
- Pages
- 22900-22909
- ISSN
- 0021-9258
- Cited by
- 79
- References
- 34
- Language
- en
- Licence
- www.elsevier.com/tdm/userlicense/1.0/ (tdm)
- creativecommons.org/licenses/by/4.0/ (vor, 3042 d)
About these checks
Registry, retraction, Cites and statistics results are computed, not judged, with one exception: a printed reference that no index lists is read once by a model before it counts as a citation error. Claims are extracted by a model and kept only when their quote appears verbatim in the text; each cited source is then checked, with a model’s help, for whether it says what the claim relies on. Those verdicts can be wrong — read the claim’s quote and the cited source before relying on one.
Statistics and arithmetic are recomputed, not judged.
Confidence bands are shown only for fields calibrated on our annotated test set. None is calibrated yet, so no band is shown.
What counts as a claim ›How we measure confidence ›How we check this ›
Are you an author, or do you see a problem with this page? Request a review
Data sources
Bibliographic data: Semantic Scholar, OpenAlex, Crossref.
Contains information from the Semantic Scholar Academic Graph Datasets, made available under the ODC Attribution License (ODC-BY 1.0).
Semantic Scholar’s data is described in: Kinney, R., et al. (2023). The Semantic Scholar Open Data Platform. arXiv:2301.10140.
