

The DOI matches its Crossref record; 10 of the 10 references it cites were found in a registry or an index.
Phosphorylation of p62 by AMP-activated protein kinase mediates autophagic cell death in adult hippocampal neural stem cells
Overview
The claims and statistics of this paper haven’t been checked yet.
Run the check — free, no account needed. It reads the open-access text and checks the sources it cites.
Integrity signals
Registry
Cites
Statistics
Figures
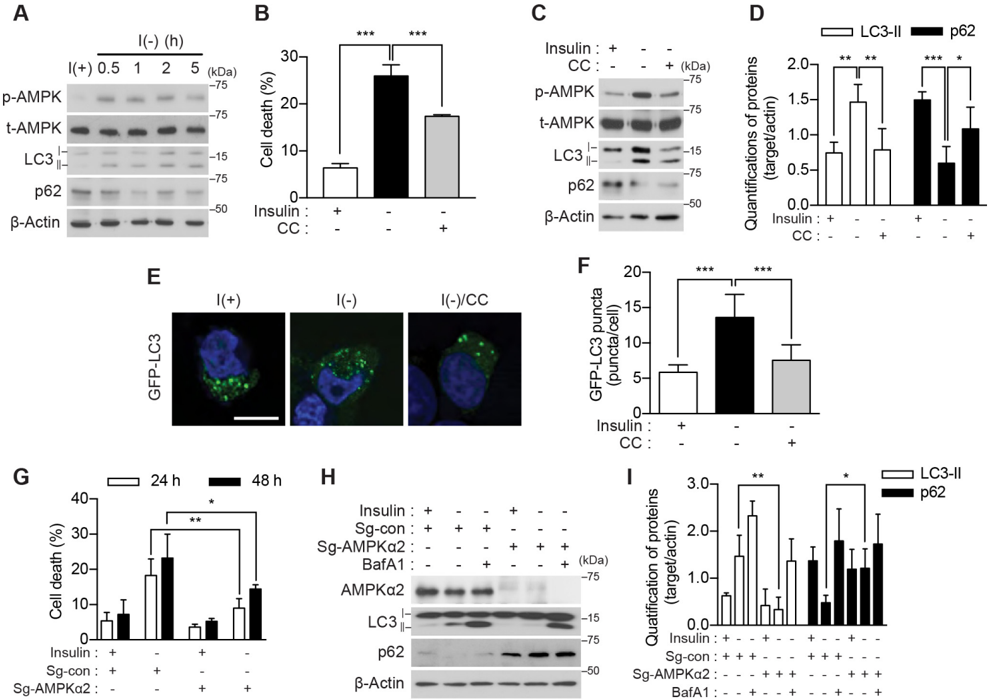
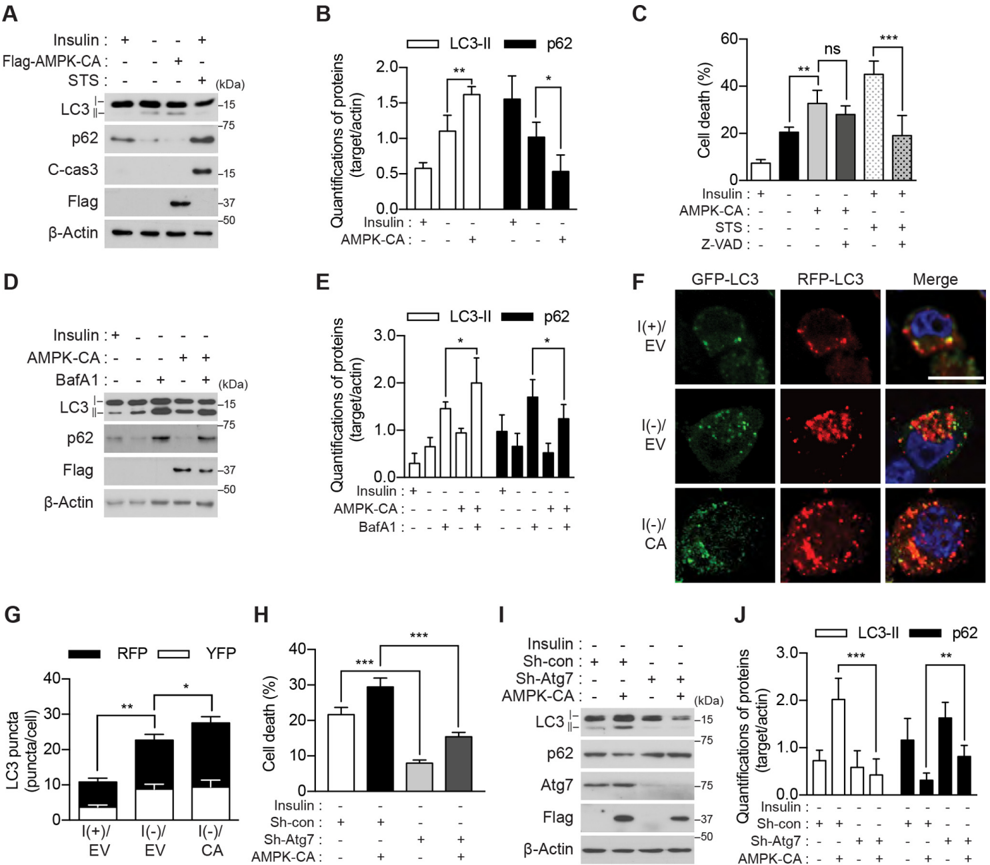
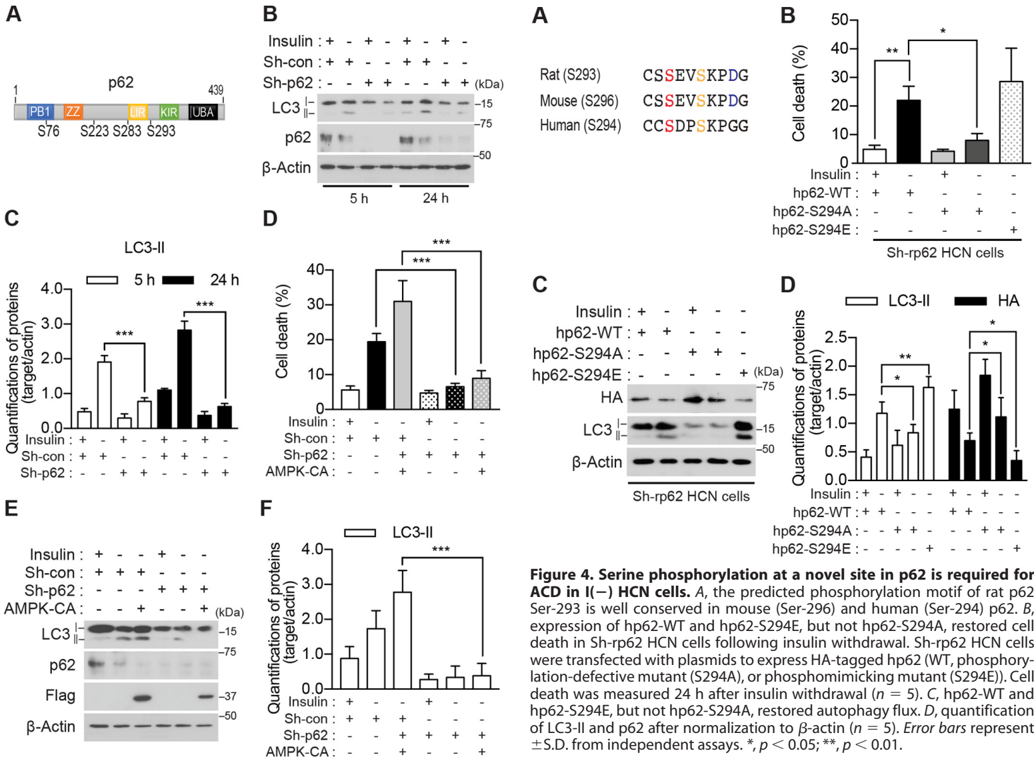
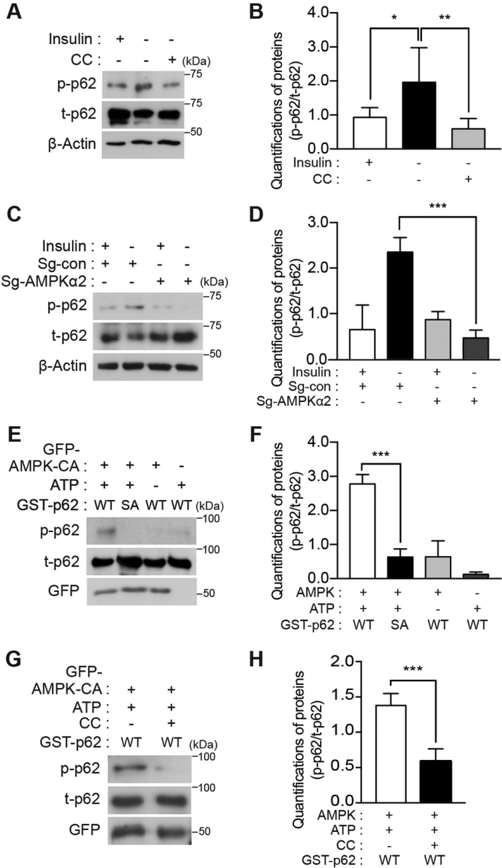
Verification
Claims the paper makes
The claims and statistics of this paper haven’t been checked yet.
Run the check — free, no account needed. It reads the open-access text and checks the sources it cites.
Claims other papers make about this one
Each is checked against this paper’s own text: does it say what the citing paper says it does?
The cited source doesn’t support the claim as written.
In the citing paper
“In liver cells, AMPK suppresses autophagy at the level of cargo sequestration, as indicated by the rapid sequestration-inhibitory effects of a variety of AMPK activators”
From Guidelines for the use and interpretation of assays for monitoring autophagy (4th edition) 1 (2021) · cites this paper as [657]
Checked by a reasoning model — may be wrong.
Experimental — accuracy not yet measuredThe source backs part of the claim, not all of it — or backs it for a different population, condition or comparison.
In the citing paper
“whereas it appears to stimulate autophagy in many other cell types, including fibroblasts, colon carcinoma cells and skeletal muscle [656-665]”
From Guidelines for the use and interpretation of assays for monitoring autophagy (4th edition) 1 (2021) · cites this paper as [657]
Experimental — accuracy not yet measured
Self-check
Percentages, sums and reported differences re-computed from the paper’s own numbers.
The self-check needs the paper’s full text.
Citations
Cites
The AMPK signalling pathway coordinates cell growth, autophagy and metabolism
Mihaylova, M. M., & Shaw, R. J. (2011) · Nature Cell Biology · doi:10.1038/ncb2329 · Cited by 2,923
The ubiquitin kinase PINK1 recruits autophagy receptors to induce mitophagy
Lazarou, M., Sliter, D. A., Kane, L. A., Sarraf, S. A., Wang, C., Burman, J. L., Sideris, D. P., Fogel, A. I., & Youle, R. J. (2015) · Nature · doi:10.1038/nature14893 · Cited by 2,774
Kimura, S., Noda, T., & Yoshimori, T. (2007) · Autophagy · doi:10.4161/auto.4451 · Cited by 2,278
Selective degradation of mitochondria by mitophagy
Kim, I., Rodriguez-Enriquez, S., & Lemasters, J. J. (2007) · Archives of Biochemistry and Biophysics · doi:10.1016/j.abb.2007.03.034 · Cited by 1,558
Autophagic cell death: the story of a misnomer
Kroemer, G., & Levine, B. (2008) · Nature Reviews Molecular Cell Biology · doi:10.1038/nrm2529 · Cited by 1,453
AMPK activators: mechanisms of action and physiological activities
Kim, J., Yang, G., Kim, Y., Kim, J., & Ha, J. (2016) · Experimental & Molecular Medicine · doi:10.1038/emm.2016.16 · Cited by 817
Hoffman, N. J., Parker, B. L., Chaudhuri, R., Fisher-Wellman, K. H., Kleinert, M., Humphrey, S. J., Yang, P., Holliday, M., Trefely, S., Fazakerley, D. J., et al. (2015) · Cell Metabolism · doi:10.1016/j.cmet.2015.09.001 · Cited by 426
Functional interaction between autophagy and ciliogenesis
Pampliega, O., Orhon, I., Patel, B., Sridhar, S., Díaz-Carretero, A., Beau, I., Codogno, P., Satir, B. H., Satir, P., & Cuervo, A. M. (2013) · Nature · doi:10.1038/nature12639 · Cited by 424
p62/SQSTM1 cooperates with Parkin for perinuclear clustering of depolarized mitochondria
Okatsu, K., Saisho, K., Shimanuki, M., Nakada, K., Shitara, H., Sou, Y., Kimura, M., Sato, S., Hattori, N., Komatsu, M., et al. (2010) · Genes to Cells · doi:10.1111/j.1365-2443.2010.01426.x · Cited by 397
Tal, R., Winter, G., Ecker, N., Klionsky, D. J., & Abeliovich, H. (2007) · Journal of Biological Chemistry · doi:10.1074/jbc.m605940200 · Cited by 268
Research works printed but not linked: 58
- Klionsky, 2000, Cell biology—autophagy as a regulated pathway of cellular degradation, Science, 290, 1717, 10.1126/science.290.5497.1717 · DOI
- Lum, 2005, Autophagy in metazoans: cell survival in the land of plenty, Nat. Rev. Mol. Cell Biol, 6, 439, 10.1038/nrm1660 · DOI
- Codogno, 2005, Autophagy and signaling: their role in cell survival and cell death, Cell Death Differ, 12, 1509, 10.1038/sj.cdd.4401751 · DOI
- Puyal, 2013, Multiple interacting cell death mechanisms in the mediation of excitotoxicity and ischemic brain damage: a challenge for neuroprotection, Prog. Neurobiol, 105, 24, 10.1016/j.pneurobio.2013.03.002 · DOI
- Kabeya, 2000, LC3, a mammalian homologue of yeast Apg8p, is localized in autophagosome membranes after processing, EMBO J, 19, 5720, 10.1093/emboj/19.21.5720 · DOI · Paper page
- Ichimura, 2000, A ubiquitin-like system mediates protein lipidation, Nature, 408, 488, 10.1038/35044114 · DOI
- Suzuki, 2001, The pre-autophagosomal structure organized by concerted functions of APG genes is essential for autophagosome formation, EMBO J, 20, 5971, 10.1093/emboj/20.21.5971 · DOI
- Mizushima, 2001, Dissection of autophagosome formation using Apg5-deficient mouse embryonic stem cells, J. Cell Biol, 152, 657, 10.1083/jcb.152.4.657 · DOI · Paper page
- Mizushima, 2004, In vivo analysis of autophagy in response to nutrient starvation using transgenic mice expressing a fluorescent autophagosome marker, Mol. Biol. Cell, 15, 1101, 10.1091/mbc.e03-09-0704 · DOI · Paper page
- Bjørkøy, 2005, p62/SQSTM1 forms protein aggregates degraded by autophagy and has a protective effect on huntingtin-induced cell death, J. Cell Biol, 171, 603, 10.1083/jcb.200507002 · DOI · Paper page
- Pankiv, 2007, p62/SQSTM1 binds directly to Atg8/LC3 to facilitate degradation of ubiquitinated protein aggregates by autophagy, J. Biol. Chem, 282, 24131, 10.1074/jbc.M702824200 · DOI · Paper page
- Ichimura, 2008, Selective turnover of p62/A170/SQSTM1 by autophagy, Autophagy, 4, 1063, 10.4161/auto.6826 · DOI
- Kourtis, 2009, Autophagy and cell death in model organisms, Cell Death Differ, 16, 21, 10.1038/cdd.2008.120 · DOI
- Kim, 2014, The pro-death role of autophagy and apoptosis in cell death induced by the BH3 mimetic gossypol, Animal Cells Syst, 18, 183, 10.1080/19768354.2014.923045 · DOI
- Shen, 2011, Autophagic cell death: Loch Ness monster or endangered species?, Autophagy, 7, 457, 10.4161/auto.7.5.14226 · DOI
- Yu, 2008, Autophagic death of adult hippocampal neural stem cells following insulin withdrawal, Stem Cells, 26, 2602, 10.1634/stemcells.2008-0153 · DOI
- Baek, 2009, Insulin withdrawal-induced cell death in adult hippocampal neural stem cells as a model of autophagic cell death, Autophagy, 5, 277, 10.4161/auto.5.2.7641 · DOI
- Ha, 2015, Regulation of autophagic cell death by glycogen synthase kinase-3β in adult hippocampal neural stem cells following insulin withdrawal, Mol. Brain, 8, 30, 10.1186/s13041-015-0119-9 · DOI
- Chung, 2015, Calpain determines the propensity of adult hippocampal neural stem cells to autophagic cell death following insulin withdrawal, Stem Cells, 33, 3052, 10.1002/stem.2082 · DOI
- Yeo, 2016, Valosin-containing protein is a key mediator between autophagic cell death and apoptosis in adult hippocampal neural stem cells following insulin withdrawal, Mol. Brain, 9, 31, 10.1186/s13041-016-0212-8 · DOI
- Hong, 2016, Autophagy for the quality control of adult hippocampal neural stem cells, Brain Res, 1649, 166, 10.1016/j.brainres.2016.02.048 · DOI
- Denton, 2012, Cell death by autophagy: facts and apparent artefacts, Cell Death Differ, 19, 87, 10.1038/cdd.2011.146 · DOI · Paper page
- Chung, 2013, Interplay between autophagy and programmed cell death in mammalian neural stem cells, BMB Rep, 46, 383, 10.5483/BMBRep.2013.46.8.164 · DOI
- Ryu, 2016, Control of adult neurogenesis by programmed cell death in the mammalian brain, Mol. Brain, 9, 43, 10.1186/s13041-016-0224-4 · DOI
- Clarke, 2012, Autophagic cell death exists, Autophagy, 8, 867, 10.4161/auto.20380 · DOI
- Chung, 2016, Mediation of autophagic cell death by type 3 ryanodine receptor (RyR3) in adult hippocampal neural stem cells, Front. Cell. Neurosci, 10, 116, 10.3389/fncel.2016.00116 · DOI
- Stapleton, 1996, Mammalian AMP-activated protein kinase subfamily, J. Biol. Chem, 271, 611, 10.1074/jbc.271.2.611 · DOI · Paper page
- Motoshima, 2006, AMPK and cell proliferation—AMPK as a therapeutic target for atherosclerosis and cancer, J. Physiol, 574, 63, 10.1113/jphysiol.2006.108324 · DOI
- Han, 2010, Activation of autophagy through modulation of 5′-AMP-activated protein kinase protects pancreatic β-cells from high glucose, Biochem. J, 425, 541, 10.1042/BJ20090429 · DOI
- Liang, 2007, The energy sensing LKB1–AMPK pathway regulates p27kip1 phosphorylation mediating the decision to enter autophagy or apoptosis, Nat. Cell Biol, 9, 218, 10.1038/ncb1537 · DOI
- Matsui, 2007, Distinct roles of autophagy in the heart during ischemia and reperfusion roles of AMP-activated protein kinase and beclin 1 in mediating autophagy, Circ. Res, 100, 914, 10.1161/01.RES.0000261924.76669.36 · DOI · Paper page
- Kim, 2011, AMPK and mTOR regulate autophagy through direct phosphorylation of Ulk1, Nat. Cell Biol, 13, 132, 10.1038/ncb2152 · DOI · Paper page
- Gwinn, 2008, AMPK phosphorylation of raptor mediates a metabolic checkpoint, Mol. Cell, 30, 214, 10.1016/j.molcel.2008.03.003 · DOI · Paper page
- Egan, 2011, Phosphorylation of ULK1 (hATG1) by AMP-activated protein kinase connects energy sensing to mitophagy, Science, 331, 456, 10.1126/science.1196371 · DOI · Paper page
- Kim, 2013, Differential regulation of distinct Vps34 complexes by AMPK in nutrient stress and autophagy, Cell, 152, 290, 10.1016/j.cell.2012.12.016 · DOI
- Hawley, 1996, Characterization of the AMP-activated protein kinase kinase from rat liver and identification of threonine 172 as the major site at which it phosphorylates AMP-activated protein kinase, J. Biol. Chem, 271, 27879, 10.1074/jbc.271.44.27879 · DOI · Paper page
- Stein, 2000, The regulation of AMP-activated protein kinase by phosphorylation, Biochem. J, 345, 437, 10.1042/bj3450437 · DOI
- Crute, 1998, Functional domains of the α1 catalytic subunit of the AMP-activated protein kinase, J. Biol. Chem, 273, 35347, 10.1074/jbc.273.52.35347 · DOI
- Woods, 2000, Characterization of the role of AMP-activated protein kinase in the regulation of glucose-activated gene expression using constitutively active and dominant negative forms of the kinase, Mol. Cell. Biol, 20, 6704, 10.1128/MCB.20.18.6704-6711.2000 · DOI
- Ichimura, 2013, Phosphorylation of p62 activates the Keap1-Nrf2 pathway during selective autophagy, Mol. Cell, 51, 618, 10.1016/j.molcel.2013.08.003 · DOI
- Linares, 2011, Phosphorylation of p62 by cdk1 controls the timely transit of cells through mitosis and tumor cell proliferation, Mol. Cell. Biol, 31, 105, 10.1128/MCB.00620-10 · DOI
- Lim, 2015, Proteotoxic stress induces phosphorylation of p62/SQSTM1 by ULK1 to regulate selective autophagic clearance of protein aggregates, PLoS Genet, 11, e1004987, 10.1371/journal.pgen.1004987 · DOI
- Xue, 2011, GPS 2.1: enhanced prediction of kinase-specific phosphorylation sites with an algorithm of motif length selection, Protein Eng. Des. Sel, 24, 255, 10.1093/protein/gzq094 · DOI
- Matsumoto, 2011, Serine 403 phosphorylation of p62/SQSTM1 regulates selective autophagic clearance of ubiquitinated proteins, Mol. Cell, 44, 279, 10.1016/j.molcel.2011.07.039 · DOI
- Kogure, 2006, A fluorescent variant of a protein from the stony coral Montipora facilitates dual-color single-laser fluorescence cross-correlation spectroscopy, Nat. Biotechnol, 24, 577, 10.1038/nbt1207 · DOI
- Katayama, 2011, A sensitive and quantitative technique for detecting autophagic events based on lysosomal delivery, Chem. Biol, 18, 1042, 10.1016/j.chembiol.2011.05.013 · DOI · Paper page
- Towler, 2007, AMP-activated protein kinase in metabolic control and insulin signaling, Circ. Res, 100, 328, 10.1161/01.RES.0000256090.42690.05 · DOI
- Wu, 2012, Investigation of receptor interacting protein (RIP3)-dependent protein phosphorylation by quantitative phosphoproteomics, Mol. Cell. Proteomics, 11, 1640, 10.1074/mcp.M112.019091 · DOI
- Kettenbach, 2011, Quantitative phosphoproteomics identifies substrates and functional modules of Aurora and Polo-like kinase activities in mitotic cells, Sci. Signal, 4, rs5, 10.1126/scisignal.2001497 · DOI
- Sinha, 2015, Thyroid hormone induction of mitochondrial activity is coupled to mitophagy via ROS-AMPK-ULK1 signaling, Autophagy, 11, 1341, 10.1080/15548627.2015.1061849 · DOI
- Mitani, 2015, Autophagic degradation of the androgen receptor mediated by increased phosphorylation of p62 suppresses apoptosis in hypoxia, Cell. Signal, 27, 1994, 10.1016/j.cellsig.2015.07.009 · DOI
- Narendra, 2010, p62/SQSTM1 is required for Parkin-induced mitochondrial clustering but not mitophagy; VDAC1 is dispensable for both, Autophagy, 6, 1090, 10.4161/auto.6.8.13426 · DOI
- Elmore, 2001, The mitochondrial permeability transition initiates autophagy in rat hepatocytes, FASEB J, 15, 2286, 10.1096/fj.01-0206fje · DOI
- Youle, 2011, Mechanisms of mitophagy, Nat. Rev. Mol. Cell Biol, 12, 9, 10.1038/nrm3028 · DOI · Paper page
- Dagda, 2008, Mitochondrially localized ERK2 regulates mitophagy and autophagic cell stress, Autophagy, 4, 770, 10.4161/auto.6458 · DOI
- Selinummi, 2005, Software for quantification of labeled bacteria from digital microscope images by automated image analysis, BioTechniques, 39, 859, 10.2144/000112018 · DOI
- Tiscornia, 2006, Production and purification of lentiviral vectors, Nat. Protoc, 1, 241, 10.1038/nprot.2006.37 · DOI
- Dimauro, 2012, A simple protocol for the subcellular fractionation of skeletal muscle cells and tissue, BMC Res. Notes, 5, 513, 10.1186/1756-0500-5-513 · DOI
Cited by
Sorted by citations
Guidelines for the use and interpretation of assays for monitoring autophagy (4th edition) 1
Klionsky, D. J., Abdel-Aziz, A. K., Abdelfatah, S., Abdellatif, M., Abdoli, A., Abel, S., Abeliovich, H., Abildgaard, M. H., Abudu, Y. P., Acevedo-Arozena, A., et al. (2021) · Autophagy · doi:10.1080/15548627.2020.1797280 · Cited by 2,897
Self-citationAutophagy-dependent cell death—where.; how and why a cell eats itself to death
Bialik, S., Dasari, S. K., & Kimchi, A. (2018) · Journal of Cell Science · doi:10.1242/jcs.215152 · Cited by 295
Jung, S., Choe, S., Woo, H., Jeong, H., An, H.-K., Moon, H., Ryu, H. Y., Yeo, B. K., Lee, Y. W., Choi, H., et al. (2020) · Autophagy · doi:10.1080/15548627.2019.1630222 · Cited by 183
Self-citationYang, Y., Ke, J., Cao, Y., Gao, Y., & Lin, C. (2024) · Biomedicine & Pharmacotherapy · doi:10.1016/j.biopha.2024.117092 · Cited by 17
Metadata
- Authors
- Ha, S., Jeong, S.-H., Yi, K., Chung, K. M., Hong, C. J., Kim, S. W., Kim, E.-K., & Yu, S.-W.
- Venue
- Journal of Biological Chemistry
- Publisher
- Elsevier BV
- Published
- 2017-08
- Volume
- 292
- Issue
- 33
- Pages
- 13795-13808
- ISSN
- 0021-9258
- Cited by
- 61
- References
- 10
- Language
- en
- Licence
- Funders
- National Research Foundation of Korea (2012M3A9C6049935, 2013M3C7A1056099)
- Ministry of Science ICT and Future Planning (17-BD-04)
- Ministry of Science, ICT and Future Planning (17-BR-04)
About these checks
Registry, retraction, Cites and statistics results are computed, not judged, with one exception: a printed reference that no index lists is read once by a model before it counts as a citation error. Claims are extracted by a model and kept only when their quote appears verbatim in the text; each cited source is then checked, with a model’s help, for whether it says what the claim relies on. Those verdicts can be wrong — read the claim’s quote and the cited source before relying on one.
Statistics and arithmetic are recomputed, not judged.
Confidence bands are shown only for fields calibrated on our annotated test set. None is calibrated yet, so no band is shown.
What counts as a claim ›How we measure confidence ›How we check this ›
Are you an author, or do you see a problem with this page? Request a review
