

Characterization of an RNA Granule from Developing Brain
Open accessThe DOI matches its Crossref record; 62 of the 62 references it cites were found in a registry or an index.
Abstract
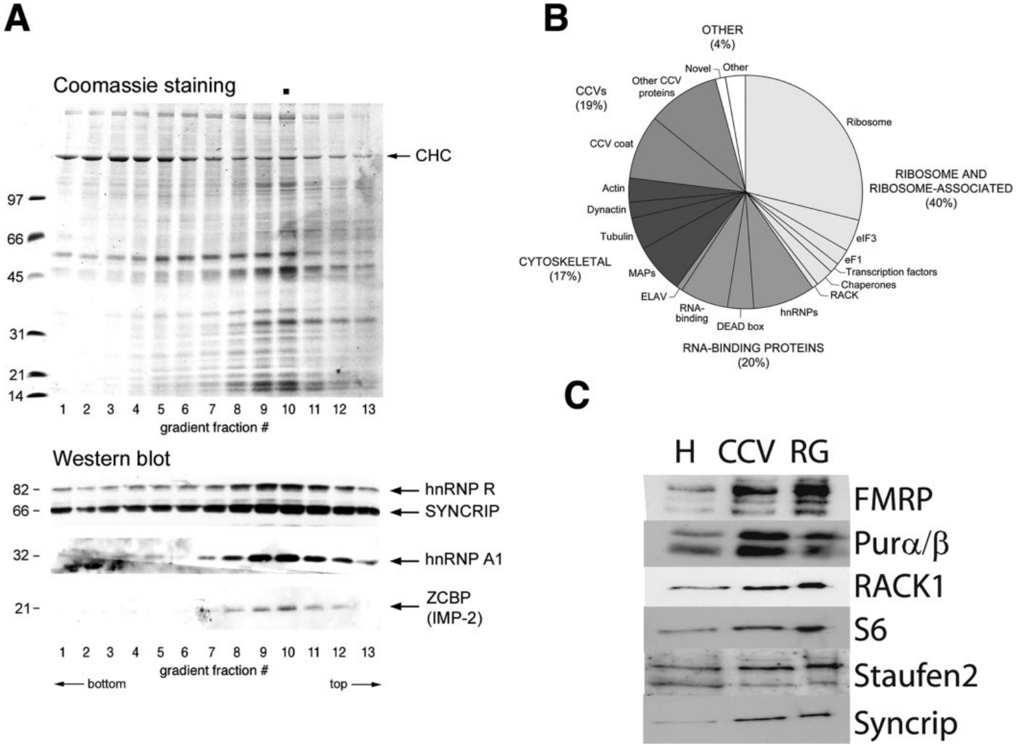
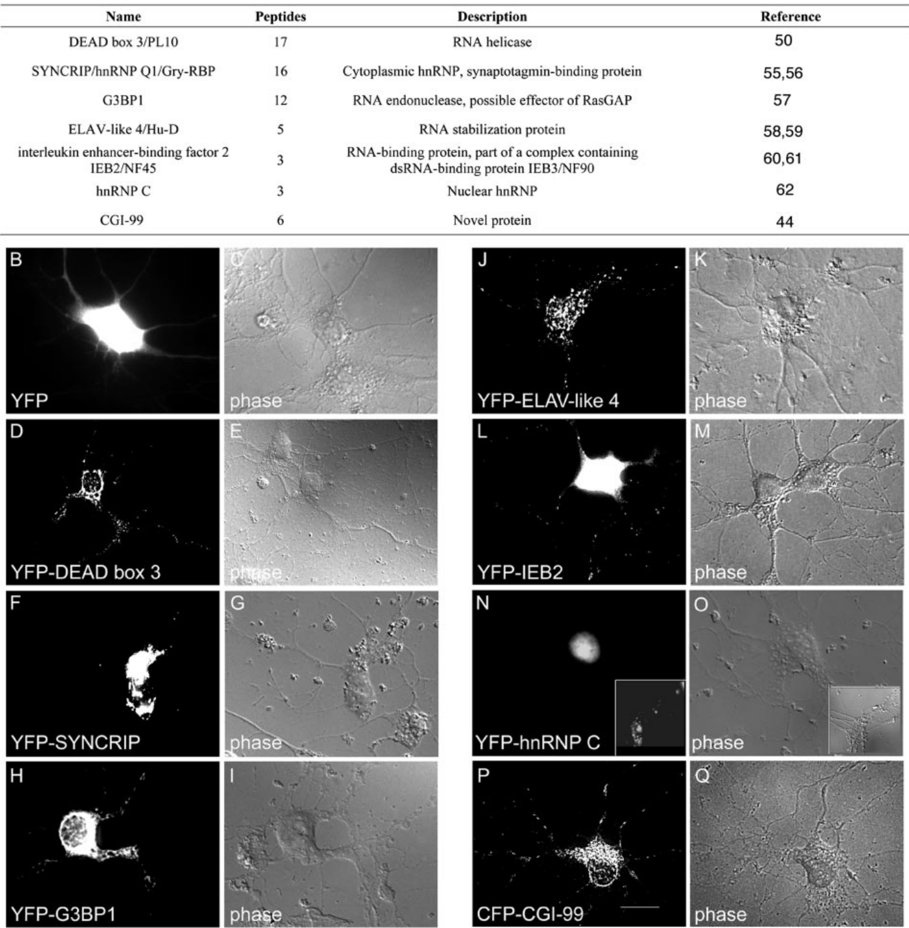
In brain, mRNAs are transported from the cell body to the processes, allowing for local protein translation at sites distant from the nucleus. Using subcellular fractionation, we isolated a fraction from rat embryonic day 18 brains enriched for structures that resemble amorphous collections of ribosomes. This fraction was enriched for the mRNA encoding beta-actin, an mRNA that is transported in dendrites and axons of developing neurons. Abundant protein components of this fraction, determined by tandem mass spectrometry, include ribosomal proteins, RNA-binding proteins, microtubule-associated proteins (including the motor protein dynein), and several proteins described only as potential open reading frames. The conjunction of RNA-binding proteins, transported mRNA, ribosomal machinery, and transporting motor proteins defines these structures as RNA granules. Expression of a subset of the identified proteins in cultured hippocampal neurons confirmed that proteins identified in the proteomics were present in neurites associated with ribosomes and mRNAs. Moreover many of the expressed proteins co-localized together. Time lapse video microscopy indicated that complexes containing one of these proteins, the DEAD box 3 helicase, migrated in dendrites of hippocampal neurons at the same speed as that reported for RNA granules. Although the speed of the granules was unchanged by activity or the neurotrophin brain-derived neurotrophic factor, brain-derived neurotrophic factor, but not activity, increased the proportion of moving granules. These studies define the isolation and composition of RNA granules expressed in developing brain.
Overview
The claims and statistics of this paper haven’t been checked yet.
Free: it reads the open-access text and checks the first 5 claims that cite a source we can check. Create a free account to check every claim.
Integrity signals
Registry
Cites
Statistics
Figures





Verification
Claims the paper makes
The claims and statistics of this paper haven’t been checked yet.
Free: it reads the open-access text and checks the first 5 claims that cite a source we can check. Create a free account to check every claim.
Claims other papers make about this one
Each is checked against this paper’s own text: does it say what the citing paper says it does?
The source backs part of the claim, not all of it — or backs it for a different population, condition or comparison.
In the citing paper
“Most efforts to combine transcriptomic and proteomic profiling have compared or validated the expression of genes via the abundance of their RNAs and proteins, including characterisation of abundance across healthy tissues45, changes due to neurological disorders46, and localised expression in neuronal processes47.”
From Decoding neuroproteomics: integrating the genome, translatome and functional anatomy (2014) · cites this paper as [47]
Experimental — accuracy not yet measured
Self-check
Percentages, sums and reported differences re-computed from the paper’s own numbers.
The self-check needs the paper’s full text.
Citations
Cites
eIF4 Initiation Factors: Effectors of mRNA Recruitment to Ribosomes and Regulators of Translation
Gingras, A.-C., Raught, B., & Sonenberg, N. (1999) · Annual Review of Biochemistry · doi:10.1146/annurev.biochem.68.1.913 · Cited by 2,121 · cited 1×
“ribosomes and translated in a non-localized manner in the cytoplasm (1).”
BackgroundKanai, Y., Dohmae, N., & Hirokawa, N. (2004) · Neuron · doi:10.1016/j.neuron.2004.07.022 · Cited by 1,108 · cited 5×
“CaMKII mRNA transport was blocked by RNA interference to a number of granule proteins including Pur and Staufen (16).”
BackgroundInfluentialSignal Sequence Recognition and Protein Targeting to the Endoplasmic Reticulum Membrane
Walter, P., & Johnson, A. E. (1994) · Annual Review of Cell Biology · doi:10.1146/annurev.cb.10.110194.000511 · Cited by 821
Steward, O., Wallace, C. S., Lyford, G. L., & Worley, P. F. (1998) · Neuron · doi:10.1016/s0896-6273(00)80591-7 · Cited by 810 · cited 1×
“Indeed there is evidence for specific targeting and translation of a newly synthesized mRNA to activated synapses (8).”
BackgroundRequirement of DDX3 DEAD Box RNA Helicase for HIV-1 Rev-RRE Export Function
Yedavalli, V. S. R. K., Neuveut, C., Chi, Y.-H., Kleiman, L., & Jeang, K.-T. (2004) · Cell · doi:10.1016/j.cell.2004.09.029 · Cited by 549
Krichevsky, A. M., & Kosik, K. S. (2001) · Neuron · doi:10.1016/s0896-6273(01)00508-6 · Cited by 536 · cited 3×
“The preparation from E18 brain contained a large number of structures that resembled amorphous collections of ribosomes, similar to what had earlier been described as RNA granules in brains (12, 14, 27) (Fig.”
BackgroundResultSorting of β-Actin mRNA and Protein to Neurites and Growth Cones in Culture
Bassell, G. J., Zhang, H., Byrd, A. L., Femino, A. M., Singer, R. H., Taneja, K. L., Lifshitz, L. M., Herman, I. M., & Kosik, K. S. (1998) · The Journal of Neuroscience · doi:10.1523/jneurosci.18-01-00251.1998 · Cited by 448
Translocation of RNA Granules in Living Neurons
Knowles, R. B., Sabry, J. H., Martone, M. E., Deerinck, T. J., Ellisman, M. H., Bassell, G. J., & Kosik, K. S. (1996) · The Journal of Neuroscience · doi:10.1523/jneurosci.16-24-07812.1996 · Cited by 438 · cited 3×
“The preparation from E18 brain contained a large number of structures that resembled amorphous collections of ribosomes, similar to what had earlier been described as RNA granules in brains (12, 14, 27) (Fig.”
BackgroundResultRelease of eIF6 (p27BBP) from the 60S subunit allows 80S ribosome assembly
Ceci, M., Gaviraghi, C., Gorrini, C., Sala, L. A., Offenhäuser, N., Carlo Marchisio, P., & Biffo, S. (2003) · Nature · doi:10.1038/nature02160 · Cited by 438 · cited 1×
“rons (31) and that RACK and its homologue in yeast are associated with ribosomes (32, 33).”
BackgroundmRNA localization: message on the move
Jansen, R.-P. (2001) · Nature Reviews Molecular Cell Biology · doi:10.1038/35067016 · Cited by 413
Cited by
Kato, M., Han, T. W., Xie, S., Shi, K., Du, X., Wu, L. C., Mirzaei, H., Goldsmith, E. J., Longgood, J., Pei, J., et al. (2012) · Cell · doi:10.1016/j.cell.2012.04.017 · Cited by 2,012
“After subtracting 54 ribosomal proteins, the remaining 106 proteins were compared with a data set of all proteins reported in the literature to be associated with stress granules, neuronal granules, processing bodies, and polar granules (Buchan and Parker, 2009; Elvira et al., 2006; Kanai et al., 2004).”
BackgroundMethodmRNA localization: Gene expression in the spatial dimension
Martin, K. C., & Ephrussi, A. (2009) · Cell · doi:10.1016/j.cell.2009.01.044 · Cited by 1,048
“In a separate study, Elvira et al. (2006) isolated RNA granules from developing rodent cortex and used proteomic analysis to identify their components.”
TDP-43 and FUS/TLS: emerging roles in RNA processing and neurodegeneration
Lagier-Tourenne, C., Polymenidou, M., & Cleveland, D. W. (2010) · Human Molecular Genetics · doi:10.1093/hmg/ddq137 · Cited by 1,021
Translational control of long-lasting synaptic plasticity and memory
Costa-Mattioli, M., Sossin, W. S., Klann, E., & Sonenberg, N. (2009) · Neuron · doi:10.1016/j.neuron.2008.10.055 · Cited by 944
“It should be stressed that at the present time the evidence that mRNA granules contain stalled polysomes, as opposed to coaggregations of mRNAs and ribosomes, is solely based on the molecular composition of these structures (Elvira et al., 2006; Krichevsky and Kosik, 2001).”
Self-citationDendritic Protein Synthesis, Synaptic Plasticity, and Memory
Sutton, M. A., & Schuman, E. M. (2006) · Cell · doi:10.1016/j.cell.2006.09.014 · Cited by 888
“Some of these factors, including the ribosomal protein S6 (Khan et al., 2001), CPEB (Si et al., 2003), and the elongation factors eEF1α (Giustetto et al., 2003; Huang et al., 2005) and eEF2 (Elvira et al., 2006), can”
Background
Metadata
- Authors
- Elvira, G., Wasiak, S., Blandford, V., Tong, X.-K., Serrano, A., Fan, X., del Rayo Sánchez-Carbente, M., Servant, F., Bell, A. W., Boismenu, D., Lacaille, J.-C., McPherson, P. S., DesGroseillers, L., & Sossin, W. S.
- Affiliations
- Université de Montréal (CA)
- Montreal Neurological Institute and Hospital (CA)
- McGill University (CA)
- Corresponding author
- Sossin, Wayne S.
- ORCID
- Venue
- Molecular & Cellular Proteomics
- Publisher
- Elsevier BV
- Published
- 2006-04
- Volume
- 5
- Issue
- 4
- Pages
- 635-651
- ISSN
- 1535-9476 (ISSN-L)
- OpenAlex
- W2169730497
- Cited by
- 287
- References
- 62
- Citations by year
- 2026: 6 · 2025: 11 · 2024: 8 · 2023: 7 · 2022: 9 · 2021: 13 · 2020: 13 · 2019: 16 · 2018: 17 · 2017: 11 · 2016: 17 · 2015: 5 · 2014: 23 · 2013: 17 · 2012: 22
- FWCI
- 4.36
- Type
- journal article
- Language
- en
- Open access
- hybrid
- doi.org
- Licence
- cc-by
- www.elsevier.com/tdm/userlicense/1.0/ (tdm)
- www.elsevier.com/legal/tdmrep-license (tdm)
- creativecommons.org/licenses/by/4.0/ (vor, 5261 d)
- Locations
- Molecular & Cellular Proteomics (publishedVersion, cc-by)
- PubMed (publishedVersion)
- Funders
- Canadian Institutes of Health Research (15121, 57079_1, MT-15121)
- Topics
- Life Sciences › Biochemistry, Genetics and Molecular Biology › Molecular Biology › RNA Research and Splicing
- Life Sciences › Biochemistry, Genetics and Molecular Biology › Molecular Biology › RNA and protein synthesis mechanisms
- Life Sciences › Neuroscience › Cellular and Molecular Neuroscience › Neuroscience and Neuropharmacology Research
- Keywords
- RNA granules, mRNA transport, dendritic transport, beta-actin mRNA, RNA-binding proteins, ribosomal proteins, dynein, microtubule-associated proteins, hippocampal neurons, neurites, brain development, brain-derived neurotrophic factor, neurotrophin signaling, subcellular fractionation
- MeSH terms
- Actins, Animals, Brain, Immunohistochemistry, Ribosomes, RNA, Messenger, Microscopy, Immunoelectron, Neurites, Brain-Derived Neurotrophic Factor, Reverse Transcriptase Polymerase Chain Reaction, Rats
About these checks
Registry, retraction, Cites and statistics results are computed, not judged, with one exception: a printed reference that no index lists is read once by a model before it counts as a citation error. Claims are extracted by a model and kept only when their quote appears verbatim in the text; each cited source is then checked, with a model’s help, for whether it says what the claim relies on. Those verdicts can be wrong — read the claim’s quote and the cited source before relying on one.
Statistics and arithmetic are recomputed, not judged.
Confidence bands are shown only for fields calibrated on our annotated test set. None is calibrated yet, so no band is shown.
What counts as a claim ›How we measure confidence ›How we check this ›
Are you an author, or do you see a problem with this page? Request a review
How to cite
Cite CoChat for the checks on this page, and the paper for its own findings.
- This page
- CoChat. (2026). Citation check: Characterization of an RNA Granule from Developing Brain. https://app.cochat.ai/papers/10.1074/mcp.m500255-mcp200
- The paper
- Elvira, G., Wasiak, S., Blandford, V., Tong, X.-K., Serrano, A., Fan, X., del Rayo Sánchez-Carbente, M., Servant, F., Bell, A. W., Boismenu, D., Lacaille, J.-C., McPherson, P. S., DesGroseillers, L., & Sossin, W. S. (2006). Characterization of an RNA Granule from Developing Brain. Molecular & Cellular Proteomics. https://doi.org/10.1074/mcp.m500255-mcp200
Data sources
Bibliographic data: Semantic Scholar, OpenAlex, Crossref.
Contains information from the Semantic Scholar Academic Graph Datasets, made available under the ODC Attribution License (ODC-BY 1.0).
Semantic Scholar’s data is described in: Kinney, R., et al. (2023). The Semantic Scholar Open Data Platform. arXiv:2301.10140.
