

The DOI matches its Crossref record; 96 of the 98 references it cites were found in a registry or an index.
Proteomic Profiling of Human Prostate Cancer-associated Fibroblasts (CAF) Reveals LOXL2-dependent Regulation of the Tumor Microenvironment
Open accessAbstract
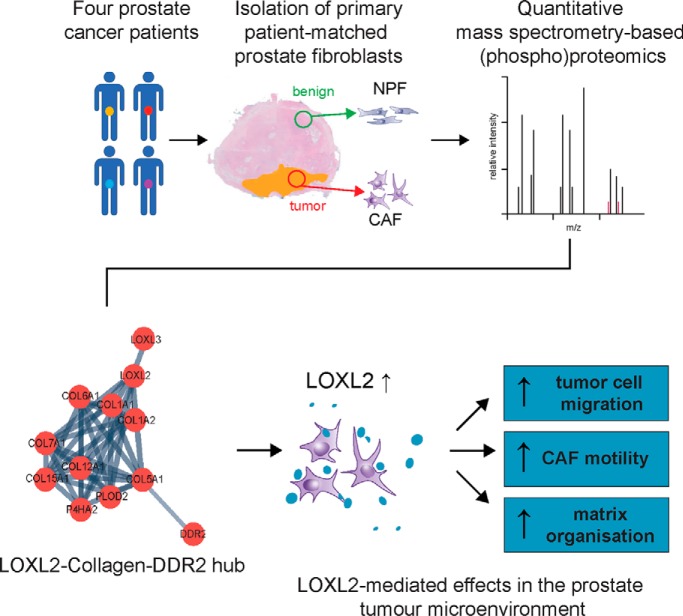
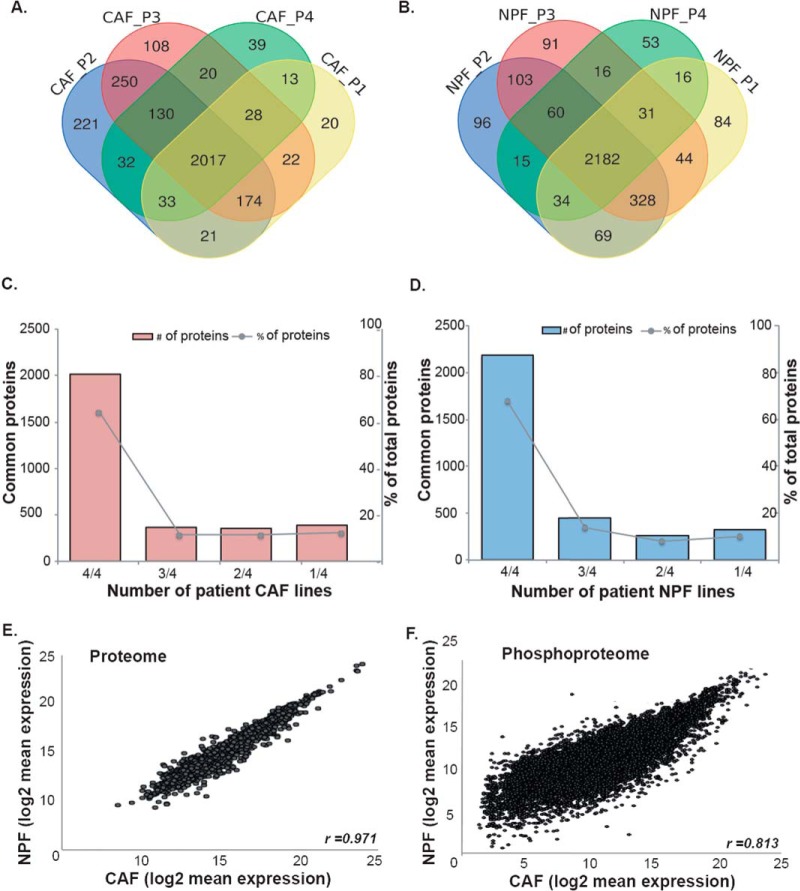
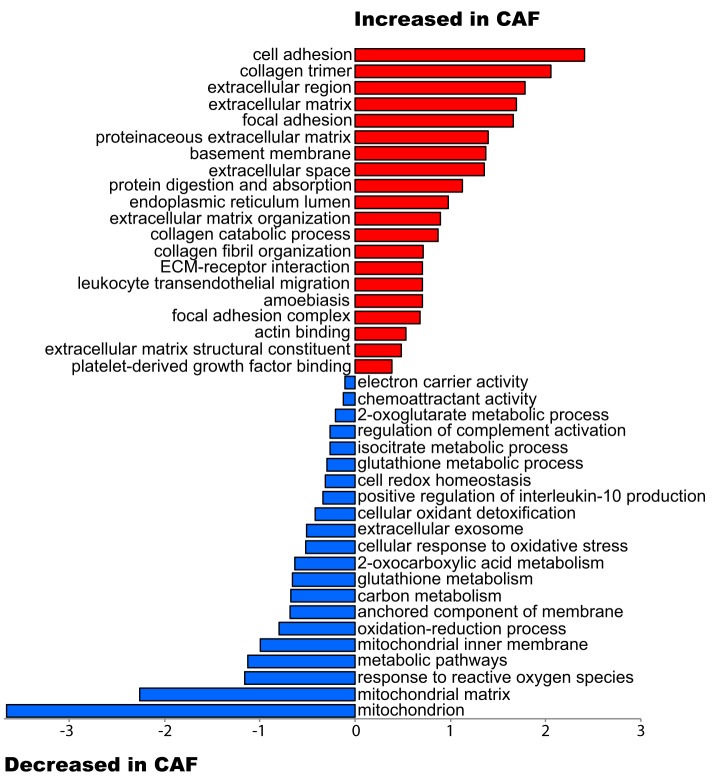
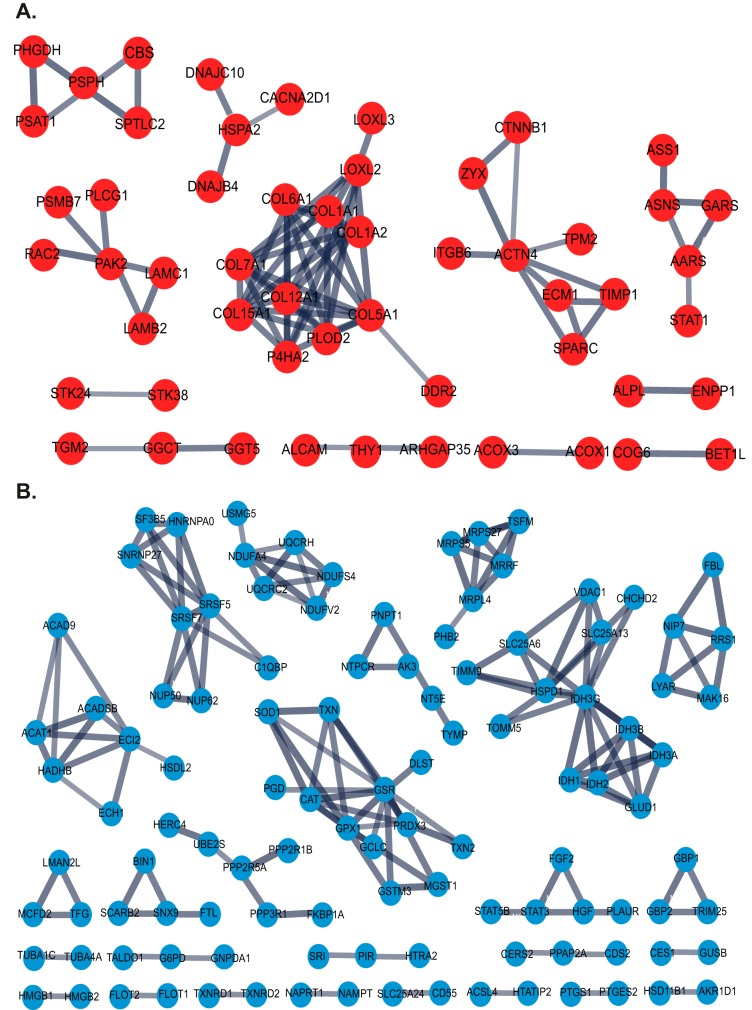
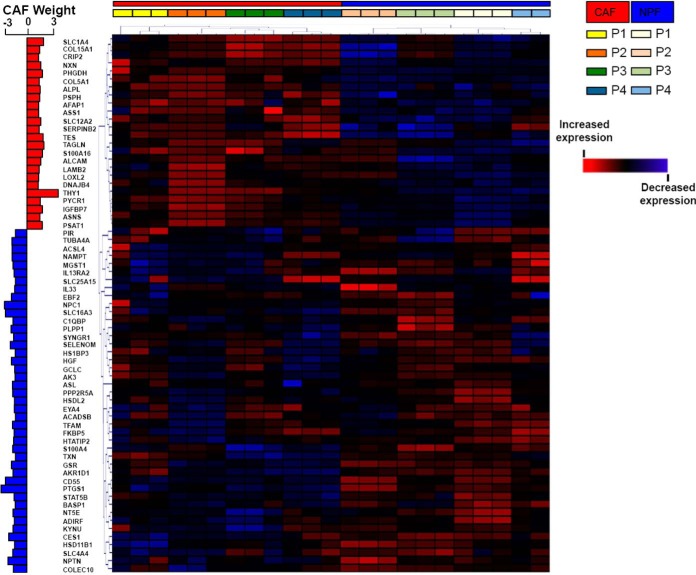
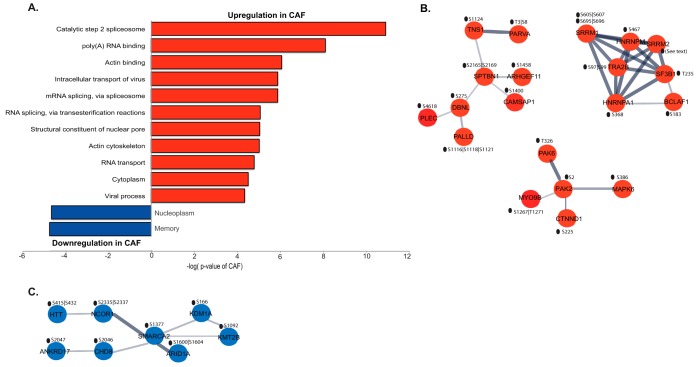
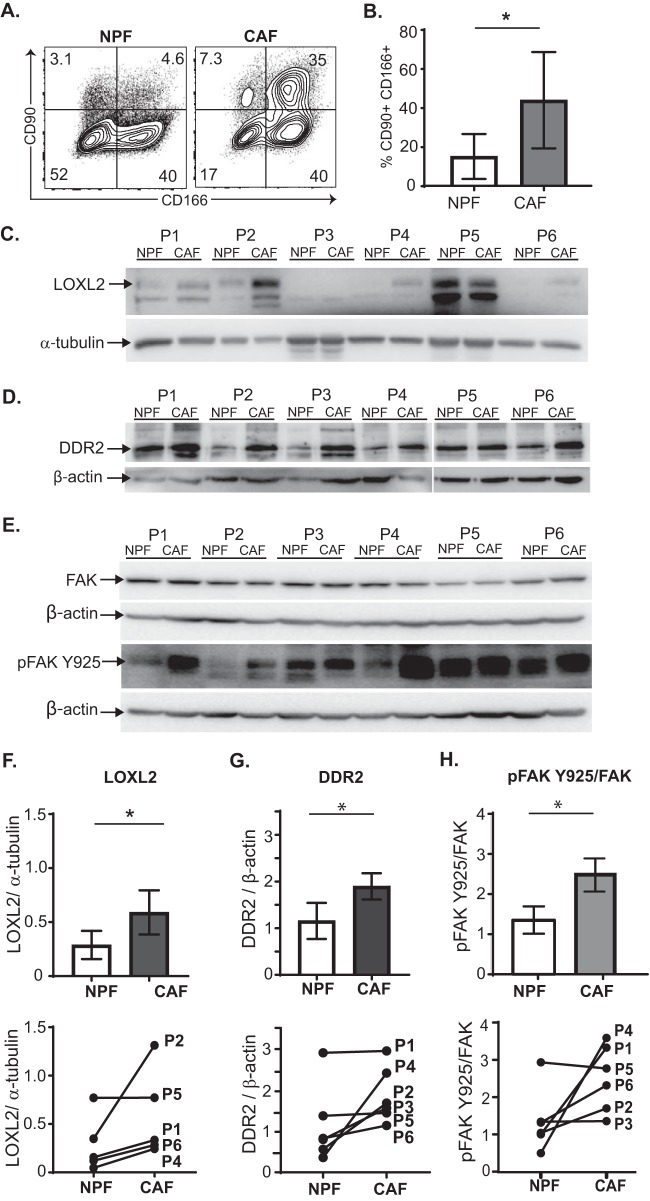
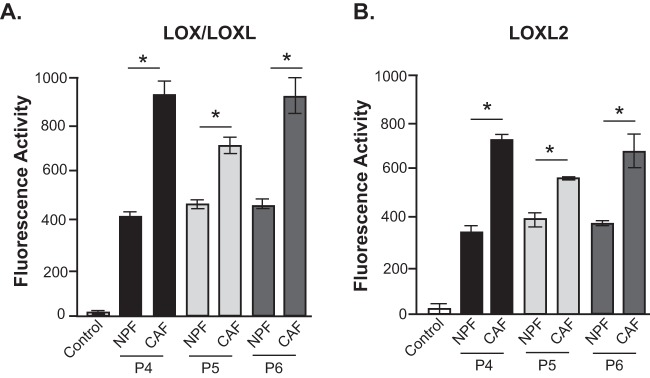
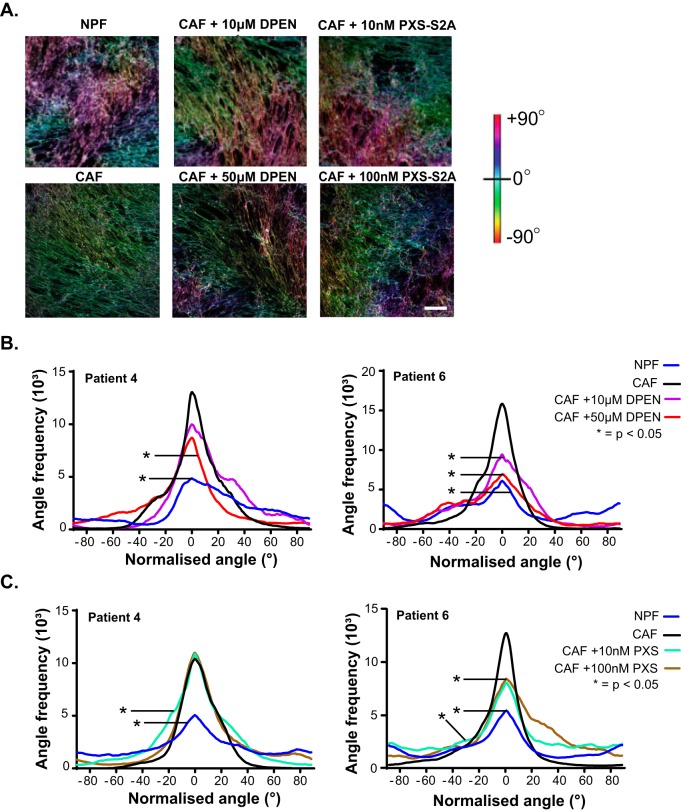
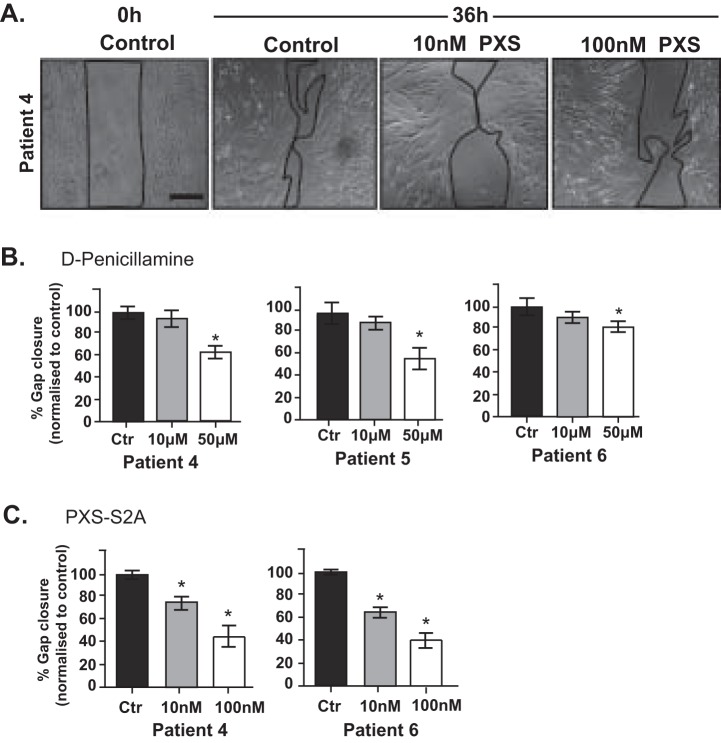
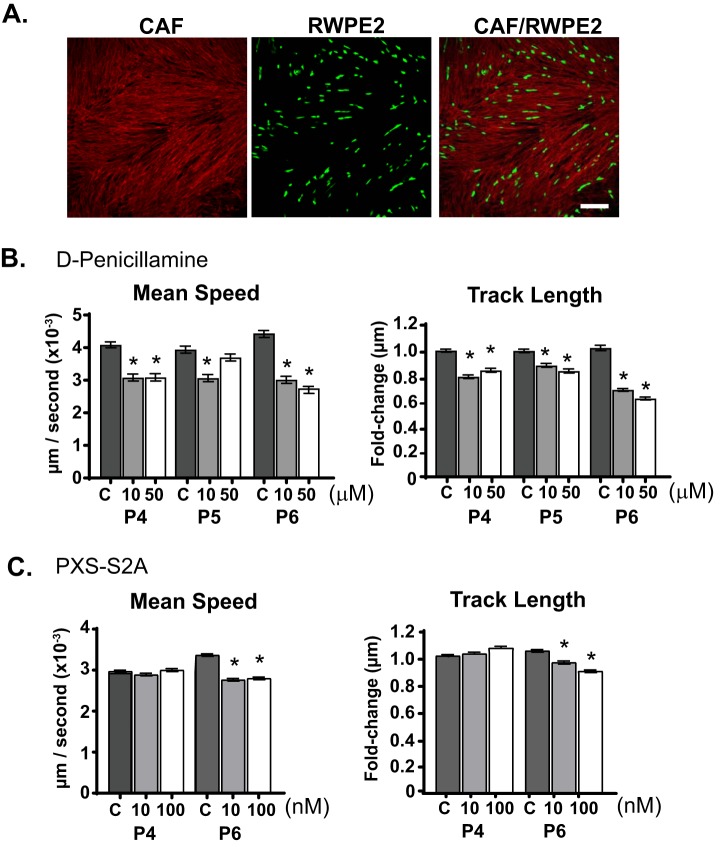
In prostate cancer, cancer-associated fibroblasts (CAF) exhibit contrasting biological properties to non-malignant prostate fibroblasts (NPF) and promote tumorigenesis.Resolving intercellular signaling pathways between CAF and prostate tumor epithelium may offer novel opportunities for research translation.To this end, the proteome and phosphoproteome of four pairs of patient-matched CAF and NPF were characterized to identify discriminating proteomic signatures.Samples were analyzed by liquid chromatography-tandem mass spectrometry (LC-MS/ MS) with a hyper reaction monitoring data-independent acquisition (HRM-DIA) workflow.Proteins that exhibited a significant increase in CAF versus NPF were enriched for the functional categories "cell adhesion" and the "extracellular matrix."The CAF phosphoproteome exhibited enhanced phosphorylation of proteins associated with the "spliceosome" and "actin binding."STRING analysis of the CAF proteome revealed a prominent interaction hub associated with collagen synthesis, modification, and signaling.It contained multiple collagens, including the fibrillar types COL1A1/2 and COL5A1; the receptor tyrosine kinase discoidin domain-containing receptor 2 (DDR2), a receptor for fibrillar collagens; and lysyl oxidase-like 2 (LOXL2), an enzyme that promotes collagen crosslinking.Increased activity and/or expression of LOXL2 and DDR2 in CAF were confirmed by enzymatic assays and Western blotting analyses.Pharmacological inhibition of CAF-derived LOXL2 perturbed extracellular matrix (ECM) organization and decreased CAF migration in a wound healing assay.Further, it significantly impaired the motility of cocultured RWPE-2 prostate tumor epithelial cells.These results indicate that CAF-derived LOXL2 is an important mediator of intercellular communication within the prostate tumor microenvironment and is a potential therapeutic target.
Overview
The claims and statistics of this paper haven’t been checked yet.
Run the check — free, no account needed. It reads the open-access text and checks the sources it cites.
Integrity signals
Registry
Cites
Statistics
Figures
Verification
Claims the paper makes
The claims and statistics of this paper haven’t been checked yet.
Run the check — free, no account needed. It reads the open-access text and checks the sources it cites.
Claims other papers make about this one
Each is checked against this paper’s own text: does it say what the citing paper says it does?
The cited source says what the claim attributes to it.
In the citing paper
“CAFs also produce matrix-crosslinking enzymes and, together with force-mediated ECM remodelling (reviewed in detail85,86), these contribute to the increased stiffness of tumour tissue87–89.”
From A framework for advancing our understanding of cancer-associated fibroblasts (2020) · cites this paper as [87]
Self-check
Percentages, sums and reported differences re-computed from the paper’s own numbers.
The self-check needs the paper’s full text.
Citations
Cites
DAVID: Database for Annotation, Visualization, and Integrated Discovery
Dennis, G., Sherman, B. T., Hosack, D. A., Yang, J., Gao, W., Lane, H. C., & Lempicki, R. A. (2003) · Genome Biology · doi:10.1186/gb-2003-4-5-p3 · Cited by 9,327
Molecular Mechanisms of Stress-Responsive Changes in Collagen and Elastin Networks in Skin
Aziz, J., Shezali, H., Radzi, Z., Yahya, N. A., Abu Kassim, N. H., Czernuszka, J., & Rahman, M. T. (2016) · Skin Pharmacology and Physiology · doi:10.1159/000447017 · Cited by 7,323
Microenvironmental regulation of metastasis
Joyce, J. A., & Pollard, J. W. (2009) · Nature Reviews Cancer · doi:10.1038/nrc2618 · Cited by 3,684
STRING 8--a global view on proteins and their functional interactions in 630 organisms
Jensen, L. J., Kuhn, M., Stark, M., Chaffron, S., Creevey, C. J., Muller, J., Doerks, T., Julien, P., Roth, A. C., Simonovic, M., et al. (2008) · Nucleic Acids Research · doi:10.1093/nar/gkn760 · Cited by 2,498
CD40 Agonists Alter Tumor Stroma and Show Efficacy Against Pancreatic Carcinoma in Mice and Humans
Beatty, G. L., Chiorean, E. G., Fishman, M. P., Saboury, B., Teitelbaum, U. R., Sun, W., Huhn, R. D., Song, W., Li, D., Sharp, L. L., et al. (2011) · Science · doi:10.1126/science.1198443 · Cited by 1,706
Carcinoma-associated fibroblasts stimulate tumor progression of initiated human epithelium
Olumi, A., Grossfeld, G., Hayward, S., Carroll, P., Cunha, G., Hein, P., & Tlsty, T. (2000) · Breast Cancer Research · doi:10.1186/bcr138 · Cited by 1,463
Naba, A., Clauser, K. R., Hoersch, S., Liu, H., Carr, S. A., & Hynes, R. O. (2012) · Molecular & Cellular Proteomics · doi:10.1074/mcp.m111.014647 · Cited by 1,354
Bruderer, R., Bernhardt, O. M., Gandhi, T., Miladinović, S. M., Cheng, L.-Y., Messner, S., Ehrenberger, T., Zanotelli, V., Butscheid, Y., Escher, C., et al. (2015) · Molecular & Cellular Proteomics · doi:10.1074/mcp.m114.044305 · Cited by 1,238
Rezakhaniha, R., Agianniotis, A., Schrauwen, J. T. C., Griffa, A., Sage, D., Bouten, C. V. C., van de Vosse, F. N., Unser, M. A., & Stergiopulos, N. (2011) · Biomechanics and Modeling in Mechanobiology · doi:10.1007/s10237-011-0325-z · Cited by 1,104
Choi, M., Chang, C.-Y., Clough, T., Broudy, D., Killeen, T., MacLean, B., & Olga Vitek, A. (2014) · Bioinformatics · doi:10.1093/bioinformatics/btu305 · Cited by 1,041
Research works printed but not linked: 1
- Bruderer, 2015, Extending the limits of quantitative proteome profiling with data-independent acquisition and application to acetaminophen-treated three-dimensional liver microtissues, Mol. Cell. Proteomics, 14, 1400, 10.1074/mcp.M114.044305 · DOI · Paper page
Cited by
Sorted by citations
Items 101–108 of 108
Zhang, Z., Rong, W., & Chen, L. (2026) · Journal of Nanobiotechnology · doi:10.1186/s12951-026-04567-z · Cited by 3
Zhang, Y., Luo, D., Li, R., Lv, F., Qahar, M., Yang, C., Qi, F., Gao, S., & Wei, Z. R. (2026) · The FASEB Journal · doi:10.1096/fj.202600478r
Kader, A., Mangarova, D. B., Gödde, H., Ranner-Hafferl, M.-L. H. H., Brangsch, J., Heyl, J. L., Möckel, J., Reuter, F. C., Marchand, J., Mein, J., et al. (2026) · Investigative Radiology · doi:10.1097/rli.0000000000001302
Senescent fibroblasts as drivers of malignant progression in gastric cancer
Luo, Y., Zhong, L., Mu, K., Li, Y., Li, K., Chen, Z., Yin, S., Deng, G., Huang, S., Chen, Z., et al. (2026) · Cancer Genetics · doi:10.1016/j.cancergen.2026.09.001
Mukherjee, A. G., Bharti, A. K., Mathew, D. M., Gopalakrishnan, A. V., & Nishu, S. (2026) · Mammalian Genome · doi:10.1007/s00335-026-10274-9
Zhang, S., Cai, X., 杨潇, Li, Y., & Jin, Y.-H. (2026) · Malignancy Spectrum · doi:10.15302/msp.2026.0018
Cancer-Associated Fibroblasts in Perineural Invasion: Biological Roles and Therapeutic Strategies
Cui, X., He, Y., Liu, Y., Lu, A., & Li, F. (2026) · Cells · doi:10.3390/cells15201857
毕妍娜, Zhao, Y., Ge, Y., 陳, 哲., Zhao, L., & Sun, G. (2026) · Cancer Letters · doi:10.1016/j.canlet.2026.218859
Metadata
- Authors
- Nguyen, E. V., Pereira, B. A., Lawrence, M. G., Ma, X., Rebello, R. J., Chan, H., Niranjan, B., Wu, Y., Ellem, S., Guan, X., Wu, J., Skhinas, J. N., Cox, T. R., Risbridger, G. P., Taylor, R. A., Lister, N. L., & Daly, R. J.
- Affiliations
- Peter MacCallum Cancer Centre (AU)
- University of Southern Queensland (AU)
- Peking University Cancer Hospital (CN)
- Garvan Institute of Medical Research (AU)
- The University of Melbourne (AU)
- Corresponding author
- Daly, Roger J.
- ORCID
- Venue
- Molecular & Cellular Proteomics
- Publisher
- Elsevier BV
- Published
- 2019-07
- Volume
- 18
- Issue
- 7
- Pages
- 1410-1427
- ISSN
- 1535-9476 (ISSN-L)
- PMC
- PMC6601211
- OpenAlex
- W2944168058
- Cited by
- 107
- References
- 98
- Citations by year
- 2026: 12 · 2025: 16 · 2024: 15 · 2023: 17 · 2022: 10 · 2021: 17 · 2020: 19 · 2019: 1
- FWCI
- 8.82
- Type
- journal article
- Language
- en
- Open access
- hybrid
- doi.org
- Licence
- Locations
- Molecular & Cellular Proteomics (publishedVersion, cc-by)
- Europe PMC (PubMed Central) (publishedVersion, cc-by)
- PubMed Central (publishedVersion, cc-by)
- PubMed (publishedVersion)
- University of Southern Queensland ePrints (University of Southern Queensland) (acceptedVersion)
- Monash University Research Portal (Monash University) (submittedVersion, other-oa)
- Minerva Access (University of Melbourne) (submittedVersion, cc-by)
- Funders
- Cancer Australia (ID NCG2616)
- Faculty of Medicine, Nursing and Health Sciences, Monash University (SGS16–0295)
- Department of Health | National Health and Medical Research Council (NHMRC) (1102752, 1058540)
- Victorian Cancer Agency (VCA) (15023)
- Topics
- Life Sciences › Biochemistry, Genetics and Molecular Biology › Cancer Research › Prostate Cancer Treatment and Research
- Life Sciences › Biochemistry, Genetics and Molecular Biology › Cancer Research › Protease and Inhibitor Mechanisms
- Life Sciences › Biochemistry, Genetics and Molecular Biology › Molecular Biology › TGF-β signaling in diseases
- Keywords
- prostate cancer, cancer-associated fibroblasts, LOXL2, DDR2, tumor microenvironment, extracellular matrix, collagen cross-linking, phosphoproteome, proteomic profiling, intercellular communication, therapeutic target
- MeSH terms
- Cancer-Associated Fibroblasts, Amino Acid Oxidoreductases, Cell Movement, Epithelial Cells, Extracellular Matrix, Humans, Male, Neoplasm Proteins, Phosphoproteins, Phosphorylation, Prostate, Prostatic Neoplasms, Reproducibility of Results, Signal Transduction, Autocrine Communication, Paracrine Communication, Proteome, Proteomics, Cell Line, Tumor, Tumor Microenvironment
About these checks
Registry, retraction, Cites and statistics results are computed, not judged, with one exception: a printed reference that no index lists is read once by a model before it counts as a citation error. Claims are extracted by a model and kept only when their quote appears verbatim in the text; each cited source is then checked, with a model’s help, for whether it says what the claim relies on. Those verdicts can be wrong — read the claim’s quote and the cited source before relying on one.
Statistics and arithmetic are recomputed, not judged.
Confidence bands are shown only for fields calibrated on our annotated test set. None is calibrated yet, so no band is shown.
What counts as a claim ›How we measure confidence ›How we check this ›
Are you an author, or do you see a problem with this page? Request a review
