

The DOI matches its Crossref record; 46 of the 46 references it cites were found in a registry or an index; none of the 16 sources its claims cite is checked for support yet.
Housing versus home sharing: the causal impact of short-term rental regulation on residential rents
Open accessAbstract
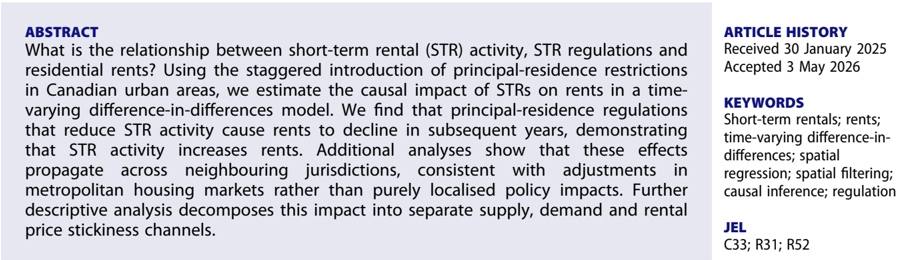
What is the relationship between short-term rental (STR) activity, STR regulations and residential rents? Using the staggered introduction of principal-residence restrictions in Canadian urban areas, we estimate the causal impact of STRs on rents in a time-varying difference-in-differences model. We find that principal-residence regulations that reduce STR activity cause rents to decline in subsequent years, demonstrating that STR activity increases rents. Additional analyses show that these effects propagate across neighbouring jurisdictions, consistent with adjustments in metropolitan housing markets rather than purely localised policy impacts. Further descriptive analysis decomposes this impact into separate supply, demand and rental price stickiness channels.
Overview
CoChat Summary
TL;DR
Using staggered municipal principal-residence restrictions across Canadian urban areas, this paper finds that short-term rental (STR) activity causally increases residential rents: regulations that reduce STR activity cause rents to decline. The effects operate mainly through commercial STR supply and rental price stickiness, with weaker evidence for a home-sharing demand channel.
Key findings
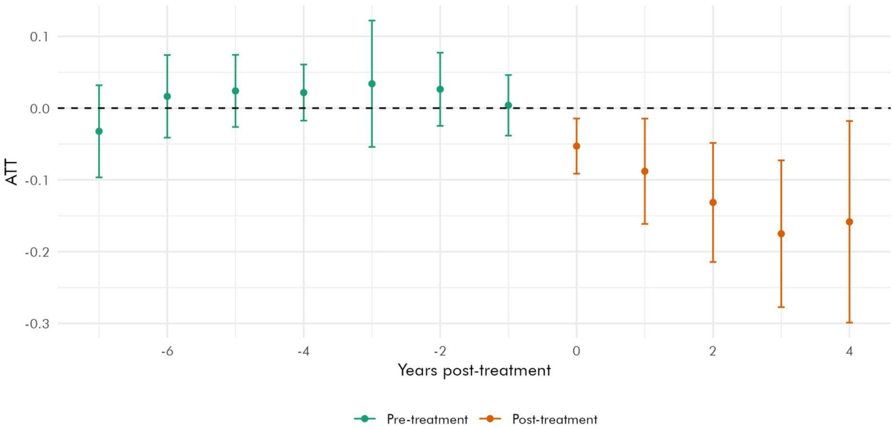
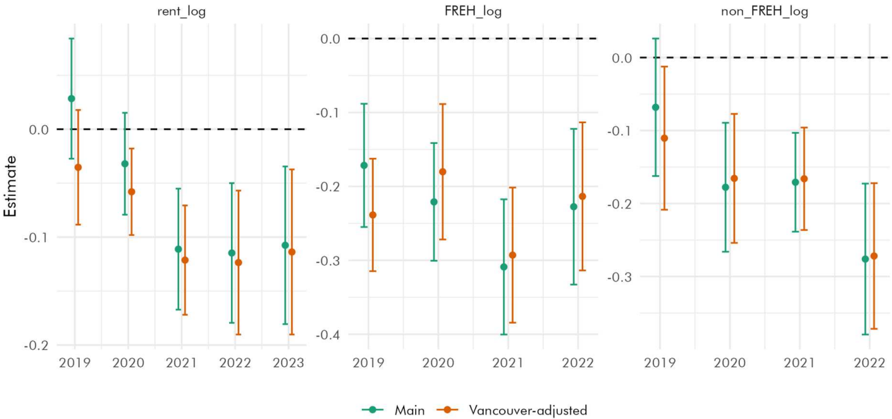
- Principal-residence restrictions reduce rents: treated neighbourhoods’ log average rents are 0.096 SD lower than the no-regulation counterfactual (ATT = −0.096, SE 0.021, p < 0.001). The same models show declines in FREH listings (−0.251 SD) and non-FREH listings (−0.207 SD), while STR prices are statistically indistinguishable from zero (−0.034, SE 0.035).
- Effects grow over time and spill over: in the year after regulations, rents were on average CA$24 lower (1.7%); by 2023, rents in regulated neighbourhoods were CA$55 (3.3%) lower, and rents in adjacent unregulated areas were CA$40 (3.0%) lower. The authors estimate this saved Canadian renters CA$192.4 million in monthly rent payments in 2023.
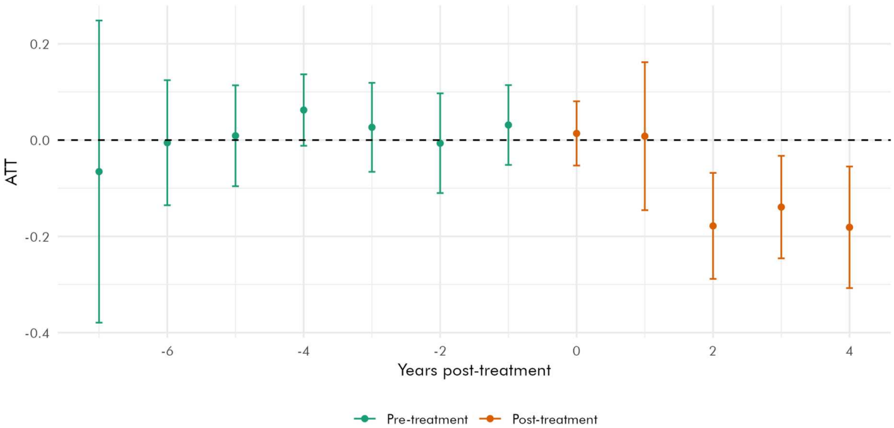
- Spillover and residualisation analyses support metropolitan-scale adjustment: untreated neighbourhoods adjacent to treated areas show negative rent effects after about two years (ATT = −0.060, p < 0.1) and declines in STR listings; after removing region-by-year variation, the rent ATT remains negative and significant (ATT = −0.019, SE 0.003, p < 0.001).
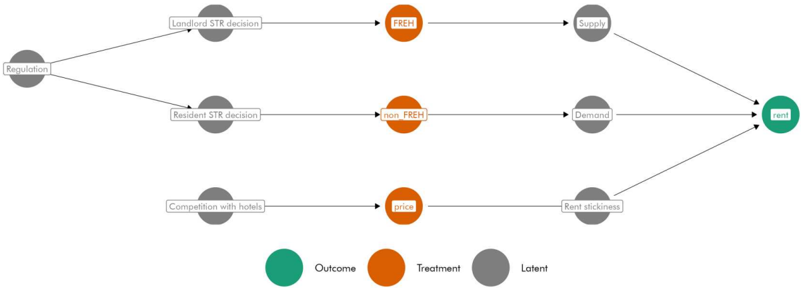
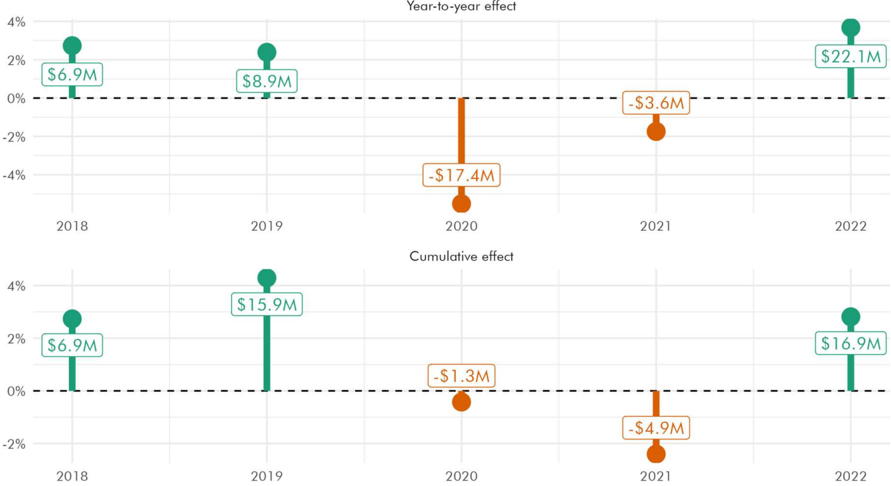
- The RE-ESF decomposition finds strong support for the supply channel (FREH_change, p < 0.01) and weak support for the price-stickiness channel (price_change, p < 0.1); the demand channel (non_FREH_change) has the hypothesised direction but a 90% confidence interval crossing zero. Pre-pandemic, STR variation accounted for an average 2.6% of the annual increase in total rent paid; in 2020 this dropped to −5.5%.
Methods
- Time-varying difference-in-differences using Callaway and Sant’Anna’s (2021) group-time ATT estimator, with staggered municipal STR principal-residence restrictions as treatment. Treatment is assigned if a restriction was in place by 1 January of the year; rents are measured in October and STR variables in September.
- Data cover Canadian urban areas: CMHC Rental Market Survey rents and vacancy rates (2015–2023), AirDNA STR listings and nightly prices (2017–2022), Canadian Census controls, and a hand-compiled STR regulation database. The main dataset includes 798 neighbourhoods in British Columbia, Ontario, New Brunswick and Quebec; 38 cities implemented restrictions, covering 309 neighbourhoods.
- Supplementary random-effects eigenvector spatial filtering (RE-ESF) regression decomposes effects into supply (FREH listings), demand (non-FREH listings) and price-stickiness (nightly STR price) channels. Parallel trends are tested via exposure-length ATTs; spatial spillovers and residualised rent models are used as robustness checks.
Limitations
- The paper states that no single clustering level is unambiguously correct because treatment arises from municipal, sub-municipal and partial-jurisdiction regulations; robustness checks use unclustered and municipality-clustered standard errors.
- The RE-ESF pathway analysis is described as exploratory and vulnerable to endogeneity on its own; the authors rely on the DiD for the overall causal claim. The non-FREH demand channel is not statistically significant, and STR prices are treated as exogenously determined by tourism demand, hotel competition and housing quality—a simplifying assumption the authors defend but note is not strictly true.
- Evident from the text: the analysis uses only Airbnb/AirDNA data, excluding other STR platforms, so STR revenue is underestimated; rent data cover purpose-built rentals only, and the CA$8.8 billion total rent figure assumes all tenants’ average rent equals that of purpose-built rental tenants. The authors also note that long-run effects through new residential investment are not captured in the short-run model.
Model-written summary. Check it against the paper before relying on it.
Integrity signals
Registry
Cites
Statistics
Figures


Verification
Claims the paper makes
0 Valid · 2 Not valid · 10 Not checked · 103 Own results and interpretations
A result the paper reports from its own data — it cites no other source for it, so there is none to check. The quote shows it is in the paper.
In the paper
“We similarly find that untreated neighbourhoods adjacent to treated municipalities experience declines in STR listings following neighbouring adoption.”
§ Housing versus home sharing: the causal impact of short-term rental regulation on residential rents > 7.1. Spatial spillovers and regional treatment effects
plainstates a cause- Asserted: passes — The authors put it forward as true.
- Checkable: passes — It can be checked against evidence.
- Load-bearing: passes — The paper’s conclusions depend on it.
- Based: passes — The paper gives a reason why it holds.
A result the paper reports from its own data — it cites no other source for it, so there is none to check. The quote shows it is in the paper.
In the paper
“Additional analyses show that these effects propagate across neighbouring jurisdictions, consistent with adjustments in metropolitan housing markets rather than purely localised policy impacts.”
- Also stated in: § 1. Introduction · plain
“Additional analyses show that these effects propagate across neighbouring jurisdictions, consistent with adjustments in metropolitan housing markets rather than purely localised policy impacts.”
§ Housing versus home sharing: the causal impact of short-term rental regulation on residential rents > Abstract
plainstates an association- Asserted: passes — The authors put it forward as true.
- Checkable: passes — It can be checked against evidence.
- Load-bearing: unclear — It is unclear whether the paper’s conclusions depend on it.
- Based: passes — The paper gives a reason why it holds.
- Rests on an assumption not shown here.
- Also stated in: § 1. Introduction · plain
A result the paper reports from its own data — it cites no other source for it, so there is none to check. The quote shows it is in the paper.
In the paper
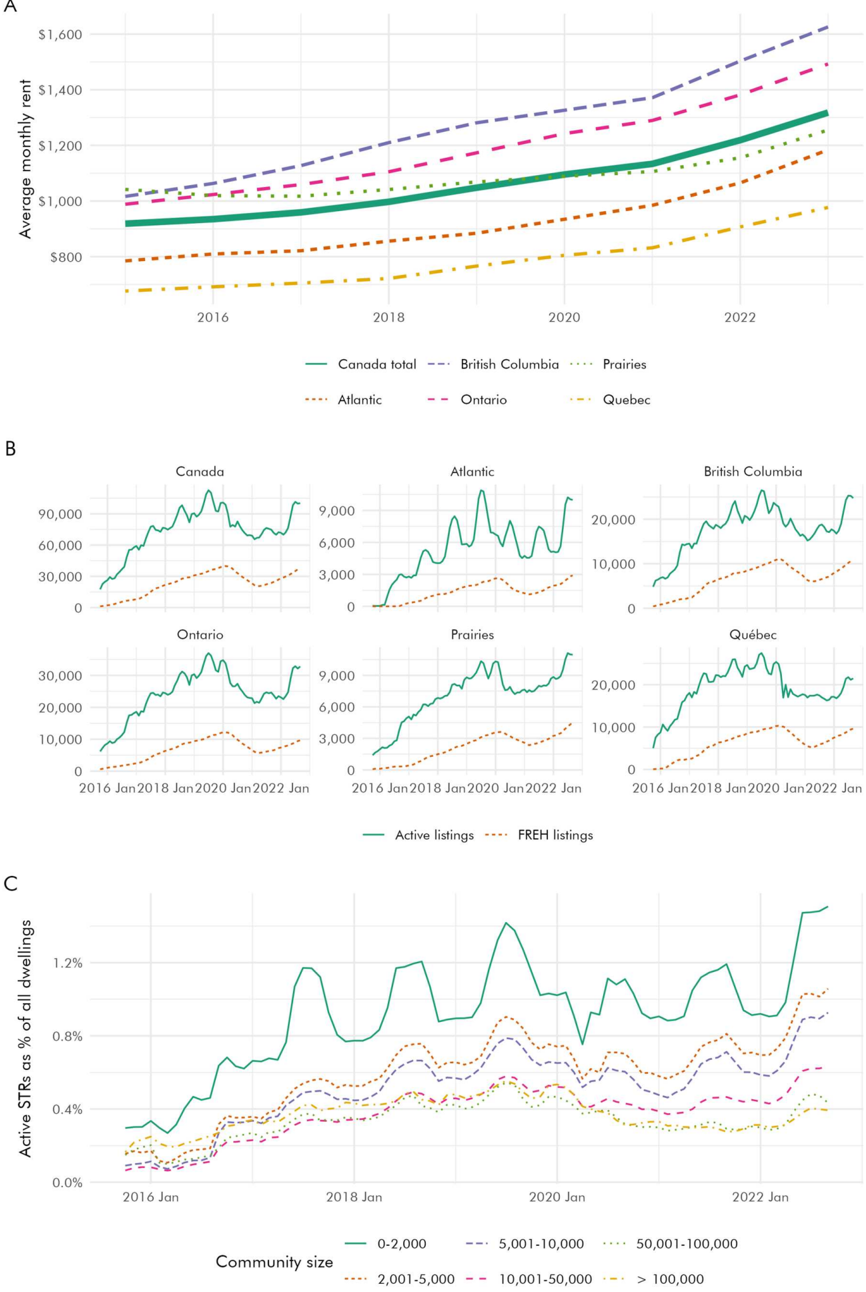
“It first demonstrates that smaller communities have, on average, a higher concentration of STRs than larger communities”
§ Housing versus home sharing: the causal impact of short-term rental regulation on residential rents > 3. Overview of STRs and LTRs in Canada
boostedstates an association- Asserted: passes — The authors put it forward as true.
- Checkable: passes — It can be checked against evidence.
- Load-bearing: unclear — It is unclear whether the paper’s conclusions depend on it.
- Based: passes — The paper gives a reason why it holds.
A result the paper reports from its own data — it cites no other source for it, so there is none to check. The quote shows it is in the paper.
In the paper
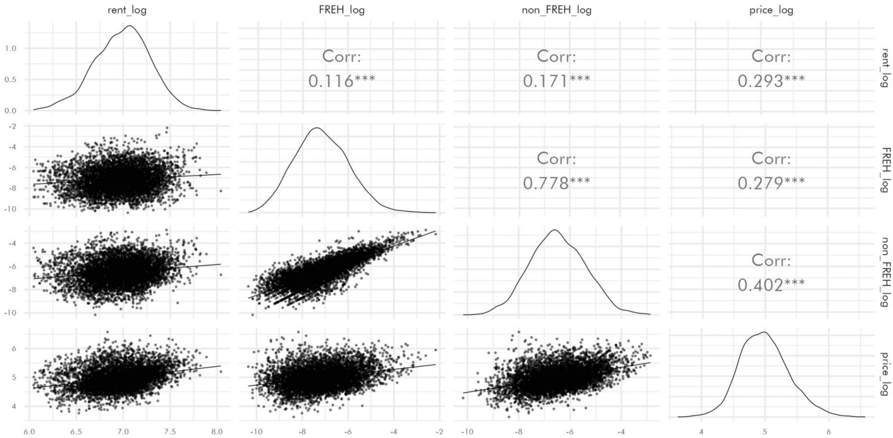
“Table 5 presents the regression results.The model demonstrates independent, positive effects of the FREH, non-FREH and STR price treatment variables on the outcome variable rent_change.”
§ Housing versus home sharing: the causal impact of short-term rental regulation on residential rents > 8. Descriptive exploration of causal pathways with the RE-ESF model
boostedstates a cause- Asserted: passes — The authors put it forward as true.
- Checkable: passes — It can be checked against evidence.
- Load-bearing: passes — The paper’s conclusions depend on it.
- Based: passes — The paper gives a reason why it holds.
A result the paper reports from its own data — it cites no other source for it, so there is none to check. The quote shows it is in the paper.
In the paper
“These results therefore show no evidence of displacement of STR activity into neighbouring jurisdictions.”
§ Housing versus home sharing: the causal impact of short-term rental regulation on residential rents > 7.1. Spatial spillovers and regional treatment effects
plain- Asserted: passes — The authors put it forward as true.
- Checkable: passes — It can be checked against evidence.
- Load-bearing: passes — The paper’s conclusions depend on it.
- Based: passes — The paper gives a reason why it holds.
59 more claims
Create a free account to see all 115 claims and to verify the 12 references still open.
- It may state two separate claims as one. 34
- Probably not a substantial claim. 24
Self-check
Percentages, sums and reported differences re-computed from the paper’s own numbers.
Each contradiction between two passages listed here was confirmed by an independent check.
Rated minor: it would not touch a result — a value no result rests on, a p-value that stays on the same side of the significance level, or a conflict that is clerical, resolved elsewhere in the paper, or outside its own findings.
In the paper
§ Housing versus home sharing: the causal impact of short-term rental regulation on residential rents > 10. Conclusions
“| treated | Was a principal-residence restriction in effect on 1 January of the year? Authors 7182 | 0.387 | - | - | | |”
§ Housing versus home sharing: the causal impact of short-term rental regulation on residential rents > 5. Data
“A total of 38 cities implemented STR principal-residence requirements on or before 1 January 2023, and they collectively account for 309 of the 798 neighbourhoods in the dataset.”
Citations
Cites
Difference-in-Differences with multiple time periods
Callaway, B., & Sant’Anna, P. H. C. (2021) · Journal of Econometrics · doi:10.1016/j.jeconom.2020.12.001 · Cited by 9,126
Estimating dynamic treatment effects in event studies with heterogeneous treatment effects
Sun, L., & Abraham, S. (2021) · Journal of Econometrics · doi:10.1016/j.jeconom.2020.09.006 · Cited by 5,518
The Rise of the Sharing Economy: Estimating the Impact of Airbnb on the Hotel Industry
Zervas, G., Proserpio, D., & Byers, J. W. (2017) · Journal of Marketing Research · doi:10.1509/jmr.15.0204 · Cited by 2,376
Airbnb: disruptive innovation and the rise of an informal tourism accommodation sector
Guttentag, D. (2015) · Current Issues in Tourism · doi:10.1080/13683500.2013.827159 · Cited by 1,848
Airbnb and the rent gap: Gentrification through the sharing economy
Wachsmuth, D., & Weisler, A. (2018) · Environment and Planning A: Economy and Space · doi:10.1177/0308518x18778038 · Cited by 720
Self-citationWhen Tourists Move In: How Should Urban Planners Respond to Airbnb?
Gurran, N., & Phibbs, P. (2017) · Journal of the American Planning Association · doi:10.1080/01944363.2016.1249011 · Cited by 538
MOSTLY POINTLESS SPATIAL ECONOMETRICS?*
Gibbons, S., & Overman, H. G. (2012) · Journal of Regional Science · doi:10.1111/j.1467-9787.2012.00760.x · Cited by 501
Airbnb, buy-to-let investment and tourism-driven displacement: A case study in Lisbon
Cocola-Gant, A., & Gago, A. (2021) · Environment and Planning A: Economy and Space · doi:10.1177/0308518x19869012 · Cited by 499
Is home sharing driving up rents? Evidence from Airbnb in Boston
Horn, K., & Merante, M. (2017) · Journal of Housing Economics · doi:10.1016/j.jhe.2017.08.002 · Cited by 412
Regulating Airbnb: how cities deal with perceived negative externalities of short-term rentals
Nieuwland, S., & van Melik, R. (2020) · Current Issues in Tourism · doi:10.1080/13683500.2018.1504899 · Cited by 403
Do short-term rental platforms affect housing markets? Evidence from Airbnb in Barcelona
Garcia-López, M.-À., Jofre-Monseny, J., Martínez-Mazza, R., & Segú, M. (2020) · Journal of Urban Economics · doi:10.1016/j.jue.2020.103278 · Cited by 367
The Effect of Home-Sharing on House Prices and Rents: Evidence from Airbnb
Barron, K., Kung, E., & Proserpio, D. (2021) · Marketing Science · doi:10.1287/mksc.2020.1227 · Cited by 326
Imbens, G. W. (2020) · Journal of Economic Literature · doi:10.1257/jel.20191597 · Cited by 243
Overtourism and online short-term rental platforms in Italian cities
Celata, F., & Romano, A. (2020) · Journal of Sustainable Tourism · doi:10.1080/09669582.2020.1788568 · Cited by 190
Short-term rentals and the housing market: Quasi-experimental evidence from Airbnb in Los Angeles
Koster, H., van Ommeren, J. V., & Volkhausen, N. (2018) · Journal of Urban Economics · doi:10.1016/j.jue.2021.103356 · Cited by 160
The Effect of Home-Sharing on House Prices and Rents: Evidence from AirbnbPreprint
Barron, K., Kung, E., & Proserpio, D. (2017) · SSRN Electronic Journal · doi:10.2139/ssrn.3006832 · Cited by 157
The Nominal Rigidity of Apartment Rents
Genesove, D. (2003) · Review of Economics and Statistics · doi:10.1162/003465303772815763 · Cited by 119
Does Airbnb Disrupt the Private Rental Market? An Empirical Analysis for French Cities
Ayouba, K., Breuillé, M.-L., Grivault, C., & le Gallo, J. (2020) · International regional science review · doi:10.1177/0160017618821428 · Cited by 101
Local fit evaluation of structural equation models using graphical criteria.
Thoemmes, F. J., Rosseel, Y., & Textor, J. C. (2017) · Psychological Methods · doi:10.1037/met0000147 · Cited by 82
What Airbnb does to the housing market
Benítez-Aurioles, B., & Tussyadiah, I. P. (2020) · Annals of Tourism Research · doi:10.1016/j.annals.2020.103108 · Cited by 75
Airbnb and rental markets: Evidence from Berlin
Duso, T., Michelsen, C., Schaefer, M., & Tran, K. D. (2024) · Regional Science and Urban Economics · doi:10.1016/j.regsciurbeco.2024.104007 · Cited by 73
The design and effects of short-term rental regulation
Furukawa, N., & Onuki, M. (2019) · Current Issues in Tourism · doi:10.1080/13683500.2019.1638892 · Cited by 61
Airbnb’s contribution to socio-spatial inequalities and geographies of resistance in Barcelona
Morales-Pérez, S., Garay, L., & Wilson, J. (2020) · Tourism Geographies · doi:10.1080/14616688.2020.1795712 · Cited by 55
The Effect of Short-Term Rentals on Residential Investment
Bekkerman, R., Cohen, M. C., Kung, E., Maiden, J., & Proserpio, D. (2021) · Marketing Science · doi:10.1287/mksc.2022.1409 · Cited by 54
de Arenaza, D. R.-P., Hierro, L., & Patiño, D. (2019) · Current Issues in Tourism · doi:10.1080/13683500.2019.1705768 · Cited by 52
Airbnb and its potential impact on the London housing market
Shabrina, Z., Arcaute, E., & Batty, M. (2021) · Urban studies · doi:10.1177/0042098020970865 · Cited by 48
The impact of Airbnb on housing affordability: Evidence from Hong Kong
Liang, C., Yeung, M. C. H., & Au, A. (2021) · Environment and Planning B Urban Analytics and City Science · doi:10.1177/23998083211043123 · Cited by 42
“Airbnb in the City”: assessing short-term rental regulation in Bordeaux
Robertson, C., Déjean, S., & Suire, R. (2023) · The Annals of Regional Science · doi:10.1007/s00168-023-01215-4 · Cited by 38
A theory of sticky rents: Search and bargaining with incomplete information
Gallin, J., & Verbrugge, R. J. (2019) · Journal of Economic Theory · doi:10.1016/j.jet.2019.06.003 · Cited by 36
The impact of Airbnb on residential property values and rents: Evidence from Portugal
Franco, S. F., & Santos, C. (2021) · Regional Science and Urban Economics · doi:10.1016/j.regsciurbeco.2021.103667 · Cited by 32
Does the room sharing business model disrupt housing markets? Empirical evidence of Airbnb in Taiwan
Chang, H.-H. (2020) · Journal of Housing Economics · doi:10.1016/j.jhe.2020.101706 · Cited by 32
Garay-Tamajón, L., Lladós-Masllorens, J., Meseguer-Artola, A., & Morales-Pérez, S. (2022) · Tourism and Hospitality Research · doi:10.1177/14673584211057568 · Cited by 32
Assessing the impacts of Airbnb listings on London house prices
Todd, J. A., Musah, A., & Cheshire, J. (2021) · Environment and Planning B Urban Analytics and City Science · doi:10.1177/23998083211001836 · Cited by 31
Smigiel, C. (2020) · Geographica Helvetica · doi:10.5194/gh-75-253-2020 · Cited by 30
Lee, S., & Kim, H. (2023) · Tourism Management Perspectives · doi:10.1016/j.tmp.2023.101192 · Cited by 27
Data sharing and tax enforcement: Evidence from short-term rentals in Denmark
Garz, M., & Schneider, A. K. (2023) · Regional Science and Urban Economics · doi:10.1016/j.regsciurbeco.2023.103912 · Cited by 19
Ram, Y., & Tchetchik, A. (2021) · Current Issues in Tourism · doi:10.1080/13683500.2021.1978954 · Cited by 18
Short-term rentals in Canada: Uneven growth, uneven impacts
Combs, J., Kerrigan, D., & Wachsmuth, D. (2020) · Canadian journal of urban research · doi:10.36939/cjur/vol29no1/art274 · Cited by 17
Self-citationPerforming a peer-to-peer economy: how Airbnb hosts navigate socio-institutional frameworks
Christensen, M. (2020) · Journal of Sustainable Tourism · doi:10.1080/09669582.2020.1849231 · Cited by 16
Neither housing nor hotel: The emergence of “medium-term rentals” in post-Covid Canadian cities
Wachsmuth, D., & Buglioni, B. (2024) · Canadian Planning and Policy / Aménagement et politique au Canada · doi:10.24908/cpp-apc.v2024i1.16935 · Cited by 15
Self-citationHome or hotel? A contemporary challenge in the use of housing stock
Simcock, T. (2019) · Housing Studies · doi:10.1080/02673037.2021.1988063 · Cited by 14
Wang, Y., Livingston, M., McArthur, D. P., & Bailey, N. (2023) · Housing Studies · doi:10.1080/02673037.2023.2176829 · Cited by 14
The Airbnb rent premium and the crowding-out of long-term rentals
Hill, R., Pfeifer, N., & Steurer, M. (2020) · Journal of Housing Economics · doi:10.1016/j.jhe.2023.101935 · Cited by 13
Verdouw, J., & Eccleston, R. (2022) · Urban Policy and Research · doi:10.1080/08111146.2022.2076213 · Cited by 13
Graham, P., & Pritchard, B. (2024) · Australian Planner · doi:10.1080/07293682.2024.2397998 · Cited by 2
The Effect of Short-Term Rentals on Residential Investment
Bekkerman, R., Cohen, M. C., Kung, E., Maiden, J., & Proserpio, D. (2022) · Proceedings of the 23rd ACM Conference on Economics and Computation · doi:10.1145/3490486.3538368
Research works printed but not linked: 1
- Sheppard, S., & Udell, A. (2016). Do Airbnb properties affect house prices? Williams College Department of Economics Working Papers, 3(1), 43.
Cited by
Epistemic engulfment by proptech and finance in Canadian housing
St-Hilaire, C. (2026) · City · doi:10.1080/13604813.2026.2700087
Self-citationDid New York City's Airbnb Ban Lower Rents? Evidence from Local Law 18Preprint
Marsella, A. (2026) · SSRN Electronic Journal · doi:10.2139/ssrn.7341298
Metadata
- Authors
- Wachsmuth, D., & St-Hilaire, C.
- Affiliations
- McGill University (CA)
- University of Waterloo (CA)
- Corresponding author
- Wachsmuth, David
- Venue
- Regional Studies
- Publisher
- Informa UK Limited
- Published
- 2026-06-10
- Volume
- 60
- Issue
- 1
- ISSN
- 0034-3404 (ISSN-L)
- 1360-0591
- OpenAlex
- W7164149651
- Cited by
- 2
- References
- 44
- Citations by year
- 2026: 2
- FWCI
- 8.53
- Type
- journal article
- Language
- en
- Open access
- hybrid
- doi.org
- Licence
- Locations
- Regional Studies (publishedVersion, cc-by-nc-nd)
- Funders
- Social Sciences and Humanities Research Council (435-2019-0720)
- Topics
- Social Sciences › Economics, Econometrics and Finance › Economics and Econometrics › Housing Market and Economics
- Social Sciences › Business, Management and Accounting › Marketing › Sharing Economy and Platforms
- Social Sciences › Economics, Econometrics and Finance › Finance › Housing, Finance, and Neoliberalism
- Keywords
- short-term rentals, home sharing, residential rents, rent regulation, housing market, metropolitan housing markets, Canadian cities
About these checks
Registry, retraction, Cites and statistics results are computed, not judged, with one exception: a printed reference that no index lists is read once by a model before it counts as a citation error. Claims are extracted by a model and kept only when their quote appears verbatim in the text; each cited source is then checked, with a model’s help, for whether it says what the claim relies on. Those verdicts can be wrong — read the claim’s quote and the cited source before relying on one.
A language model drew the claims from the paper on 2026-11-13, under version 3 of the claim definition (model deepseek-v4.1-flash, prompt extract-v3).
A second model labelled each claim on 2026-11-13 (model jev-1.13-20260917, definition revision gold-guideline-v0.2).
Statistics and arithmetic are recomputed, not judged.
Confidence bands are shown only for fields calibrated on our annotated test set. None is calibrated yet, so no band is shown.
What counts as a claim ›How we measure confidence ›How we check this ›
Are you an author, or do you see a problem with this page? Request a review
Data sources
Bibliographic data: Semantic Scholar, OpenAlex, Crossref.
Contains information from the Semantic Scholar Academic Graph Datasets, made available under the ODC Attribution License (ODC-BY 1.0).
Semantic Scholar’s data is described in: Kinney, R., et al. (2023). The Semantic Scholar Open Data Platform. arXiv:2301.10140.
