

The DOI matches its Crossref record; 24 of the 24 references it cites were found in a registry or an index.
Coming together or coming apart? Changes in social cohesion during the Covid-19 pandemic in England
Open accessAbstract
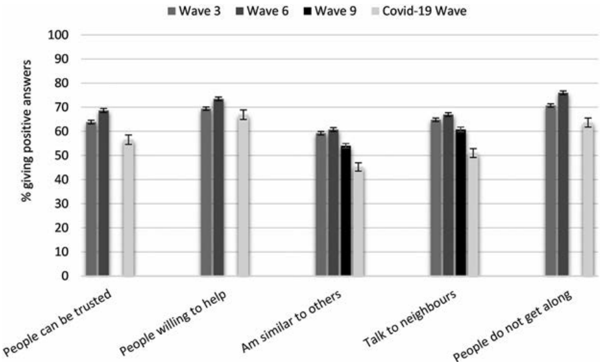
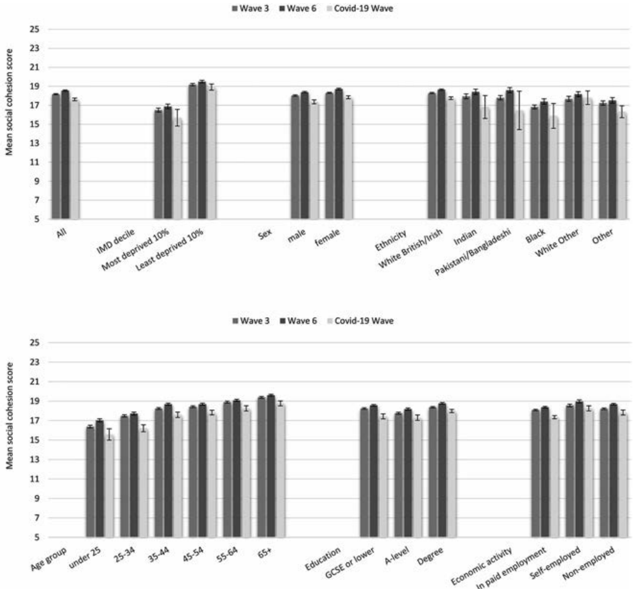
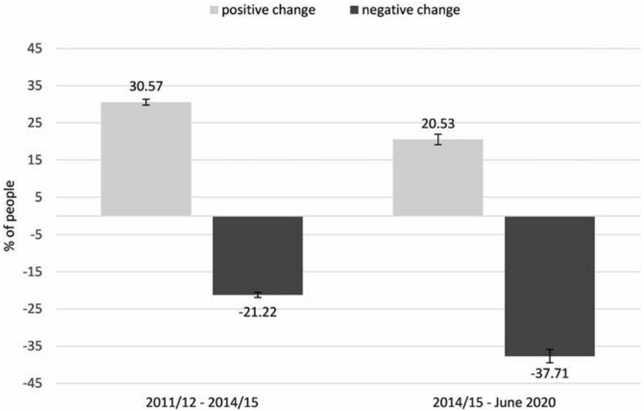
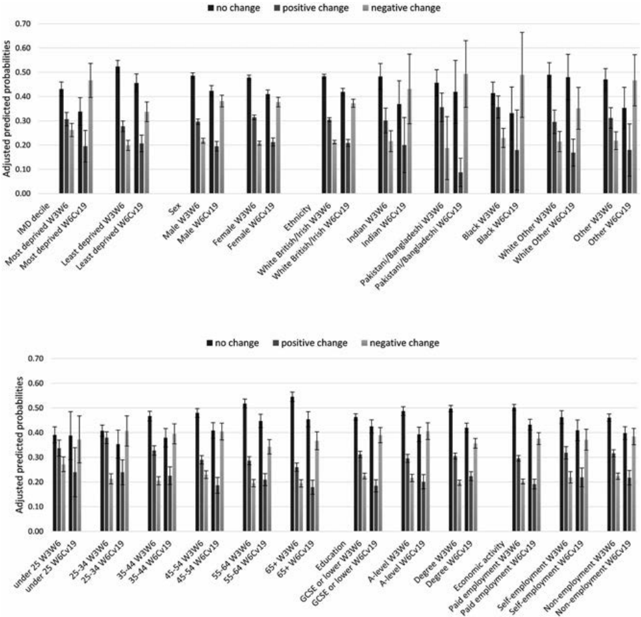
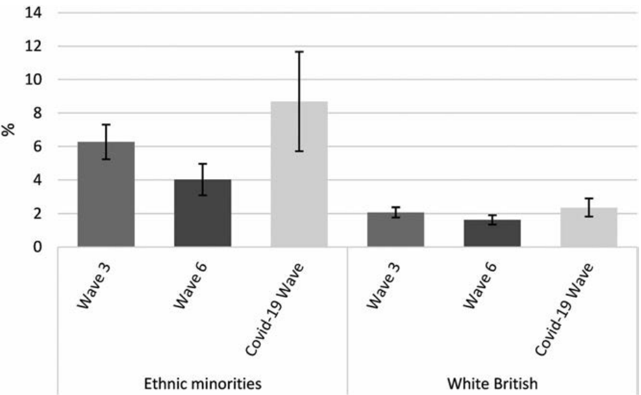
This paper explores the potential impact of the Covid-19 pandemic on people’s perceptions of cohesion in their local communities; particularly for vulnerable groups/communities, such as ethnic minorities or those living in highly deprived neighbourhoods. To this end, we examine both trends over time in overall levels of cohesion as well as patterns of positive and negative changes experienced by individuals using nationally representative data from Understanding Society Study. We test whether rates of positive-/negative-change in cohesion over the pandemic-period differed across socio-demographic groups and neighbourhood characteristics. These trends are then compared to patterns of positive-/negative-change over time experienced in earlier periods to test whether the pandemic was uniquely harmful. We show that the overall levels of social cohesion are lower in June 2020 compared to all of the examined pre-pandemic periods. The decline of perceived-cohesion is particularly high in the most deprived communities, among certain ethnic minority groups and among the lower-skilled. Our findings suggest that the pandemic put higher strain on social-resources among vulnerable groups and communities, who also experienced more negative changes in other areas of life.
Overview
The claims and statistics of this paper haven’t been checked yet.
Run the check — free, no account needed. It reads the open-access text and checks the sources it cites.
Integrity signals
Registry
Cites
Statistics
Figures



Verification
Claims the paper makes
The claims and statistics of this paper haven’t been checked yet.
Run the check — free, no account needed. It reads the open-access text and checks the sources it cites.
Claims other papers make about this one
Each is checked against this paper’s own text: does it say what the citing paper says it does?
In the citing paper
“and the haves will be targeted by the have-nots and the barely surviving [116][117][118].”
From Exploring Psychosocial Stressors and Coping Strategies During the COVID‐19 Lockdown: A Study of Two Low‐Income Communities in South Africa (2025) · cites this paper as [118]
In the citing paper
“If these issues go unaddressed, then it is likely that there will be intense civil unrest (i.e., July civil unrest and looting)”
From Exploring Psychosocial Stressors and Coping Strategies During the COVID‐19 Lockdown: A Study of Two Low‐Income Communities in South Africa (2025) · cites this paper as [118]
Self-check
Percentages, sums and reported differences re-computed from the paper’s own numbers.
The self-check needs the paper’s full text.
Citations
Cites
Bowling alone: the collapse and revival of American community
(2000) · Choice Reviews Online · doi:10.5860/choice.38-2454 · Cited by 28,723
Putnam, R. (2000) · doi:10.1145/358916.361990 · Cited by 17,114
Community Resilience as a Metaphor, Theory, Set of Capacities, and Strategy for Disaster Readiness
Norris, F. H., Stevens, S. P., Pfefferbaum, B., Wyche, K. F., & Pfefferbaum, R. L. (2008) · American Journal of Community Psychology · doi:10.1007/s10464-007-9156-6 · Cited by 5,476
Anti-Asian Hate Crime During the COVID-19 Pandemic: Exploring the Reproduction of Inequality
Gover, A. R., Harper, S. B., & Langton, L. L. (2020) · American Journal of Criminal Justice · doi:10.1007/s12103-020-09545-1 · Cited by 954
Loneliness: A signature mental health concern in the era of COVID-19
Killgore, W. D. S., Cloonan, S. A., Taylor, E. C., & Dailey, N. S. (2020) · Psychiatry Research · doi:10.1016/j.psychres.2020.113117 · Cited by 915
Sibley, C. G., Greaves, L. M., Satherley, N., Wilson, M., Overall, N. C., Lee, C. H. J., Milojev, P., Bulbulia, J. A., Osborne, D., Milfont, T. L., et al. (2020) · American Psychologist · doi:10.1037/amp0000662 · Cited by 866
Impact of 2008 global economic crisis on suicide: time trend study in 54 countries.
Chang, S.-S., Stuckler, D., Yip, P., & Gunnell, D. (2013) · BMJ · doi:10.1136/bmj.f5239 · Cited by 799
Effects of the 2008 recession on health: a first look at European data
Stückler, D., Basu, S., Suhrcke, M., Coutts, A. P., & McKee, M. (2011) · The Lancet · doi:10.1016/s0140-6736(11)61079-9 · Cited by 480
Civil Society Reconsidered: The Durable Nature and Community Structure of Collective Civic Action
Sampson, R. J., McAdam, D., MacIndoe, H., & Weffer, S. E. (2005) · American Journal of Sociology · doi:10.1086/497351 · Cited by 463
The Social Dimension of Stress Reactivity
von Dawans, B., Fischbacher, U., Kirschbaum, C., Fehr, E., & Heinrichs, M. (2012) · Psychological Science · doi:10.1177/0956797611431576 · Cited by 443
Research works printed but not linked: 2
- Jung J. Y., 2019, International Journal of Communication, 13, 21
- Kim H., 2020, Journal of Public Health, 1
Cited by
Sorted by citations
Prati, G., & Mancini, A. D. (2021) · Psychological Medicine · doi:10.1017/s0033291721000015 · Cited by 890
Understanding the Relationship between Urban Public Space and Social Cohesion: A Systematic Review
Qi, J., Suvodeep Mazumdar, A., & Vasconcelos, A. C. (2024) · International Journal of Community Well-Being · doi:10.1007/s42413-024-00204-5 · Cited by 278
Identity Leadership in a Crisis: A 5R Framework for Learning from Responses to COVID‐19
Haslam, S. A., Steffens, N. K., Reicher, S. D., & Bentley, S. V. (2021) · Social Issues and Policy Review · doi:10.1111/sipr.12075 · Cited by 113
Grasso, M. T., Klicperová‐Baker, M., Koos, S., Kosyakova, Y., Petrillo, A., & Vlase, I. (2021) · European Societies · doi:10.1080/14616696.2020.1869283 · Cited by 90
Schleimer, J. P., Buggs, S. A., McCort, C. D., Pear, V. A., Biasi, A. D., Tomsich, E., Shev, A. B., Laqueur, H. S., & Wintemute, G. J. (2021) · American Journal of Public Health · doi:10.2105/ajph.2021.306540 · Cited by 87
Okely, J. A., Corley, J., Welstead, M., Taylor, A. M., Page, D., Skarabela, B., Redmond, P. H., Cox, S. R., & Russ, T. C. (2020) · International Journal of Environmental Research and Public Health · doi:10.3390/ijerph18010210 · Cited by 71
Silveira, S., Hecht, M., Matthaeus, H., Adli, M., Voelkle, M. C., & Singer, T. (2022) · International Journal of Environmental Research and Public Health · doi:10.3390/ijerph19063290 · Cited by 60
Laurence, J., & Kim, H. H. (2021) · Social Science & Medicine · doi:10.1016/j.socscimed.2021.114361 · Cited by 60
Self-citationLi, H., Browning, M. H. E. M., Dzhambov, A. M., Zhang, G., & Cao, Y. (2022) · Land · doi:10.3390/land11081128 · Cited by 55
Volunteering in the United Kingdom During the COVID-19 Pandemic: Who Started and Who Quit?
Dederichs, K. (2022) · Nonprofit and Voluntary Sector Quarterly · doi:10.1177/08997640221122814 · Cited by 45
Salir Adelante: Social capital and resilience during the Covid-19 pandemic in Argentina
Carter, E., & Cordero, M. L. (2022) · Health & Place · doi:10.1016/j.healthplace.2022.102870 · Cited by 43
Social cohesion and loneliness are associated with the antibody response to COVID-19 vaccination
Gallagher, S. M., Howard, S., Muldoon, O. T., & Whittaker, A. C. (2022) · Brain Behavior and Immunity · doi:10.1016/j.bbi.2022.04.017 · Cited by 42
Svensson, S. J., & Elntib, S. (2021) · Journal of Applied Social Psychology · doi:10.1111/jasp.12800 · Cited by 36
Godara, M., Silveira, S., Matthäus, H., Heim, C., Voelkle, M., Hecht, M., Binder, E. B., & Singer, T. (2021) · PLOS ONE · doi:10.1371/journal.pone.0256323 · Cited by 38
COVID-19 vulnerability and perceived norm violations predict loss of social trust: A pre-post study
Iacono, S. L., Przepiorka, W., Buskens, V., Corten, R., & van de Rijt, A. (2021) · Social Science & Medicine · doi:10.1016/j.socscimed.2021.114513 · Cited by 38
Ntontis, E., Fernandes‐Jesus, M., Mao, G., Dines, T., Kane, J., Karakaya, J., Perach, R., Cocking, C., McTague, M., Schwarz, A. M., et al. (2022) · International Journal of Disaster Risk Reduction · doi:10.1016/j.ijdrr.2022.103043 · Cited by 36
Bezzo, F. B., Silva, L., & van Ham, M. (2021) · PLoS ONE · doi:10.1371/journal.pone.0255156 · Cited by 35
Godara, M., Silveira, S., Matthaeus, H., & Singer, T. (2022) · Adversity and Resilience Science · doi:10.1007/s42844-022-00069-7 · Cited by 29
Residents’ perceptions of policing and safety during the COVID-19 pandemic
Nouri, S., & Kochel, T. R. (2021) · Policing An International Journal · doi:10.1108/pijpsm-05-2021-0067 · Cited by 26
Novaković, I. Z., Lueger‐Schuster, B., Verginer, L., Bakić, H., Ajduković, D., Borges, C., Figueiredo‐Braga, M., Javakhishvili, J. D., Tsiskarishvili, L., Dragan, M., et al. (2022) · European Journal of Psychotraumatology · doi:10.1080/20008198.2022.2065431 · Cited by 25
COVID-19 stressors, wellbeing and health behaviours: a cross-sectional study
Bell, L., Smith, R., van de Venter, E. C., Shuttleworth, C., Wilson, K. S., & Lycett, D. (2021) · Journal of Public Health · doi:10.1093/pubmed/fdab241 · Cited by 23
Socioeconomic stratification and trajectories of social trust during COVID-19
Wu, C., Bierman, A., & Schieman, S. (2022) · Social Science Research · doi:10.1016/j.ssresearch.2022.102750 · Cited by 26
Gavriluță, C., Dalban, C. M., & Ioan, B. G. (2022) · International Journal of Environmental Research and Public Health · doi:10.3390/ijerph19073990 · Cited by 21
Shelef, L., Schiff, M., Pat‐Horenczyk, R., & Dekel, R. (2022) · Journal of Psychiatric Research · doi:10.1016/j.jpsychires.2022.01.023 · Cited by 23
Prochnow, T. M., Curran, L. S., Amo, C., & Patterson, M. S. (2023) · Journal of Physical Activity and Health · doi:10.1123/jpah.2022-0403 · Cited by 21
Moss, J. L., Hearn, M., Cuffee, Y., Wardecker, B. M., Kitt-Lewis, E. A., & Pinto, C. N. (2023) · Preventive Medicine · doi:10.1016/j.ypmed.2023.107588 · Cited by 30
The burdens of poverty during the COVID-19 pandemic
Petersen, J., Hettich, N., Baumkötter, R., Wild, P. S., Pfeiffer, N., Münzel, T. F., König, J., Lackner, K. J., & Beutel, M. E. (2022) · Frontiers in Sociology · doi:10.3389/fsoc.2022.995318 · Cited by 19
Existential insecurity and trust during the COVID-19 pandemic: The case of Germany
Delhey, J., Steckermeier, L. C., Boehnke, K., Deutsch, F., Eichhorn, J., Kühnen, U., & Welzel, C. (2023) · Journal of Trust Research · doi:10.1080/21515581.2023.2223184 · Cited by 21
Transformations in tourism following COVID-19? A longitudinal study on the perceptions of tourists
Aschauer, W., & Egger, R. (2023) · Journal of Tourism Futures · doi:10.1108/jtf-08-2022-0215 · Cited by 18
Chan, V. K. Y., Chai, Y., Chan, S. S. M., Luo, H., Jit, M., Knapp, M. R. J., Bishai, D. M., Ni, M. Y., Wong, I. C. K., & Li, X. (2024) · BMC Medicine · doi:10.1186/s12916-024-03386-z · Cited by 17
Social Cohesion and Community Resilience during the COVID-19 Pandemic in Northern Romania
Saghin, D., Lupchian, M., & Lucheș, D. (2022) · International Journal of Environmental Research and Public Health · doi:10.3390/ijerph19084587 · Cited by 17
Hillenbrand, C. (2023) · Religion and Development · doi:10.30965/27507955-20230003 · Cited by 16
Social Protection and Social Cohesion in Times of the COVID-19 Pandemic: Evidence from Kenya
Strupat, C. (2022) · European Journal of Development Research · doi:10.1057/s41287-022-00541-1 · Cited by 15
Bertogg, A., & Koos, S. (2022) · Frontiers in Sociology · doi:10.3389/fsoc.2022.837968 · Cited by 15
Karami, R., & Keshavarz, M. (2023) · Current Psychology · doi:10.1007/s12144-023-05167-y · Cited by 15
‘You can’t be careful enough’: Measuring interpersonal trust during a pandemic
Wollebæk, D., Fladmoe, A., & Steen‐Johnsen, K. (2021) · Journal of Trust Research · doi:10.1080/21515581.2022.2066539 · Cited by 14
Community-Engaged Regenerative Mapping in an Age of Displacement and COVID-19
Muñoz, S., Walsh, E. A., Cooper, J. A., & Auerbach, J. (2021) · Annals of the American Association of Geographers · doi:10.1080/24694452.2021.1978838 · Cited by 13
COVID-19, Inequality and Older People: Developing Community-Centred Interventions
Phillipson, C., Yarker, S., Lang, L., Doran, P., Goff, M., & Buffel, T. (2021) · International Journal of Environmental Research and Public Health · doi:10.3390/ijerph18158064 · Cited by 13
Heizmann, B., & Huth-Stöckle, N. (2022) · Journal of Ethnic and Migration Studies · doi:10.1080/1369183x.2022.2114889 · Cited by 12
Laurence, J., Russell, H., & Smyth, E. (2023) · European Sociological Review · doi:10.1093/esr/jcad017 · Cited by 12
Self-citationVriens, E., Székely, Á., Lipari, F., Antonioni, A., Sánchez, Á., Tummolini, L., & Andrighetto, G. (2024) · Scientific Reports · doi:10.1038/s41598-024-53427-z · Cited by 12
Goodwin, R. B., Luu, L. A. N., Wiwattanapantuwong, J., Kovács, M. E., Suttiwan, P., & Levin, Y. (2022) · Vaccines · doi:10.3390/vaccines10050789 · Cited by 12
Laurence, J. (2024) · Journal of Affective Disorders · doi:10.1016/j.jad.2024.12.110 · Cited by 11
Self-citationKarantzas, G. C., Toumbourou, J. W., Knox, L., Greenwood, C. J., & Westrupp, E. M. (2023) · Prevention Science · doi:10.1007/s11121-023-01498-1 · Cited by 13
Ramirez, M. D., & Wood, R. M. (2023) · Political Research Quarterly · doi:10.1177/10659129231204234 · Cited by 10
The Role of Psychologists in Healthcare During the COVID-19 Pandemic
Karekla, M., Höfer, S., Plantade-Gipch, A., Neto, D. D., Schjödt, B., David, D., Christopher, S., Eleftheriou, A., Pappová, P. K., Lowet, K., et al. (2021) · European Journal of Psychology Open · doi:10.1024/2673-8627/a000003 · Cited by 10
Negură, P., Gașper, L., & Potoroacă, M. (2021) · Comparative Southeast European Studies · doi:10.1515/soeu-2021-0034 · Cited by 10
When alienated from society, conspiracy theory belief gives meaning to life
Schnell, T., Viviani, R., Lenz, C., & Krampe, H. (2024) · Heliyon · doi:10.1016/j.heliyon.2024.e34557 · Cited by 11
Maximising the (unequal) benefits of foreign direct investment: addressing the two-speed problem
Driffield, N. L., Harrington, L., Surdu, I. M., & Yuan, X. (2024) · Contemporary Social Science · doi:10.1080/21582041.2024.2433670 · Cited by 14
COVID-19 and Gender Differences in Social Trust: Causal Evidence from the First Wave of the Pandemic
Collischon, M., & Patzina, A. (2022) · Socius Sociological Research for a Dynamic World · doi:10.1177/23780231221117910 · Cited by 9
Silva, L., Bezzo, F. B., & van Ham, M. (2023) · Social Science & Medicine · doi:10.1016/j.socscimed.2023.115917 · Cited by 10
Bello, P., Novi, C. D., Martini, G., & Sturaro, C. (2024) · Socio-Economic Planning Sciences · doi:10.1016/j.seps.2024.101913 · Cited by 11
Tuitjer, A. L., Tuitjer, G., & Müller, A. (2022) · Social & Cultural Geography · doi:10.1080/14649365.2022.2115537 · Cited by 8
Braybrooke, K., Janes, S., & Sato, C. (2021) · International Conference on Communities and Technologies (C&T) · doi:10.1145/3461564.3461583 · Cited by 9
Editorial: The COVID-19 pandemic and social cohesion across the globe
Larsen, M. M., Dragolov, G., & Delhey, J. (2023) · Frontiers in Sociology · doi:10.3389/fsoc.2023.1182452 · Cited by 8
Zeng, D., Wu, X., & Miao, J. (2025) · Social Forces · doi:10.1093/sf/soaf067 · Cited by 7
Klokgieters, S. S., Penninx, B. W. J. H., Ottenheim, N. R., Giltay, E. J., Rhebergen, D., & Kok, A. A. L. (2022) · Journal of Psychosomatic Research · doi:10.1016/j.jpsychores.2022.111138 · Cited by 8
Ramaekers, M. J. M., Verbakel, E., & Kraaykamp, G. (2023) · European Societies · doi:10.1080/14616696.2023.2200503 · Cited by 7
Gavriel‐Fried, B., Loewenthal, A., & Vana, N. (2023) · Frontiers in Public Health · doi:10.3389/fpubh.2023.1233301 · Cited by 7
Authoritarianism, perceptions of security threats, and the COVID-19 pandemic: A new perspective
Stevens, D. P., BANDUCCI, S. A., & Horváth, L. (2023) · Politics and the Life Sciences · doi:10.1017/pls.2023.12 · Cited by 8
Disciplinary Neo-Liberalisation and the New Politics of Inequality
Nunn, A., & Tepe-Belfrage, D. (2022) · The British Journal of Criminology · doi:10.1093/bjc/azac034 · Cited by 7
Social Cohesion and COVID-19: Integrative Review
Ware, P. (2024) · Interactive Journal of Medical Research · doi:10.2196/51214 · Cited by 6
König, M., Smith, A., Moreno-López, L., Davidson, E., Dauvermann, M. R., Orellana, S. C., McCormick, E. M., Peris, T. S., Kaşer, M., Ioannidis, K., et al. (2025) · Development and Psychopathology · doi:10.1017/s0954579424001986 · Cited by 8
Bergmann, M., Hecher, M. V., & Sommer, E. (2022) · Frontiers in Sociology · doi:10.3389/fsoc.2022.1007107 · Cited by 6
Governmentality Versus Community: The Impact of the COVID Lockdowns
Wallace, C., Kureková, L. M., León, M., O’Reilly, J., Blome, C., Bussi, M., Faith, B., Finney, M. L., Leschke, J., Ruffa, C., et al. (2023) · International Journal of Community Well-Being · doi:10.1007/s42413-023-00189-7 · Cited by 6
Dierckx, K., Hiel, A. V., Valcke, B., & van den Bos, K. (2023) · Frontiers in Psychology · doi:10.3389/fpsyg.2023.1025153 · Cited by 6
Silveira, S., Hecht, M., Voelkle, M. C., & Singer, T. (2023) · European Journal of Social Psychology · doi:10.1002/ejsp.2974 · Cited by 6
Time use, work and leisure in the UK before, during, between and following the Covid-19 lockdowns
Roberts, K. (2022) · Leisure Studies · doi:10.1080/02614367.2022.2138512 · Cited by 6
Socio-Emotional Skills For The Reduction Of Social Anxiety In University Students
Paola, J., Garay, P., Fuster-Guillén, D., & Marianella, J. (2022) · Journal of Pharmaceutical Negative Results · doi:10.47750/pnr.2022.13.s02.64 · Cited by 7
Li, M., Wu, T., Joerin, J., & Schubert, R. (2024) · Natural Hazards Review · doi:10.1061/nhrefo.nheng-2034 · Cited by 5
How can Covid Mutual Aid Groups be Sustained Over Time? The UK Experience
Drury, J., Fernandes‐Jesus, M., Mao, G., Ntontis, E., Perach, R., & Miranda, D. (2022) · Routledge eBooks · doi:10.4324/9781003301905-8 · Cited by 5
Quinn, K. G., Hunt, B. R., Jacobs, J., Valencia, J., Hirschtick, J. L., & Walsh, J. L. (2023) · Journal of Racial and Ethnic Health Disparities · doi:10.1007/s40615-023-01837-6 · Cited by 8
Shah, R., Flemming, J., Chinnery, J., & Heaner, G. (2024) · Frontiers in Education · doi:10.3389/feduc.2024.1089422 · Cited by 8
The impact of religious identity on intergroup encounters
Leder, D., van der Vaart, W., & Machielse, A. (2025) · Archive for the Psychology of Religion · doi:10.1177/00846724251329350 · Cited by 9
Mountifield, C. (2025) · International Journal of the Sociology of Leisure · doi:10.1007/s41978-025-00190-8 · Cited by 4
Social Cohesion: A New Definition and a Proposal for Its Measurement in Africa
Burchi, F., Fiedler, C., Leininger, J., Mroß, K., Nowack, D., von Schiller, A., Sommer, C., Strupat, C., & Wingens, C. (2025) · Social Indicators Research · doi:10.1007/s11205-025-03764-x · Cited by 4
Impact of perceived neighborhood social cohesion on vaccination intentions in the post-pandemic era
Chupak, A. L., Rudisill, C., Harrison, S. E., Linvill, K., Costa‐Font, J., Hung, P., & Li, X. (2024) · Preventive Medicine · doi:10.1016/j.ypmed.2024.108158 · Cited by 4
Harding-White, M. F., Carson, J. F., & Mojtahedi, D. (2025) · Psychiatry International · doi:10.3390/psychiatryint6020055 · Cited by 5
Laurence, J. (2025) · Journal of Health and Social Behavior · doi:10.1177/00221465251368341 · Cited by 4
Self-citationClapping the nation, or, from a global pandemic to national imaginaries via local solidarities
Fox, J. (2024) · Nations and Nationalism · doi:10.1111/nana.13052 · Cited by 3
Galaitsi, S., Wells, E., Zemba, V., Blue, S., Cato, C., Wood, M. D., Trump, B. D., & Linkov, I. (2024) · International Journal of Disaster Risk Reduction · doi:10.1016/j.ijdrr.2024.104597 · Cited by 3
How violence among consumers alters the expected benefits of participation in a consumer collective
Dessart, L., Covà, B., & Davignon, N. (2024) · Journal of Consumer Affairs · doi:10.1111/joca.12594 · Cited by 3
Hailey, V., Bloomberg, M., Hamer, M., & Fisher, A. (2023) · Preventive Medicine Reports · doi:10.1016/j.pmedr.2023.102392 · Cited by 3
Klokgieters, S. S., Ungar, M. T., Penninx, B. W. J. H., Glas, L., Rhebergen, D., & Kok, A. A. L. (2024) · Aging & Mental Health · doi:10.1080/13607863.2024.2326890 · Cited by 3
Fears, Pandemic, and the Shaping of Social Trust: A Three‐Wave Panel Study in Sweden
Abdelzadeh, A., & Sedelius, T. (2025) · Scandinavian Political Studies · doi:10.1111/1467-9477.70007 · Cited by 3
IMPACT OF COVID-19 ON SOCIAL COHESION AND ROLE OF MUSLIM COMMUNITIES TO TACKLE THE CHALLENGE
Abbasi, M. U. R., Ejaz, T., & Akhtar, S. (2021) · Humanities & Social Sciences Reviews · doi:10.18510/hssr.2021.9239 · Cited by 3
Gwadiso, X. A., Taliep, N., Ismail, G., James (née Louw), S., & Swart, L.-A. (2025) · Journal of Theoretical Social Psychology · doi:10.1155/jts5/8167323 · Cited by 2
Social Trust During the Pandemic: Evidence from COVID-19 Crisis in South Korea
Kim, S. H. (2025) · Social Indicators Research · doi:10.1007/s11205-025-03624-8 · Cited by 2
Oberwittler, D., Gerstner, D., & Natter, L. (2025) · International Criminology · doi:10.1007/s43576-025-00186-0 · Cited by 2
Cai, H., Ji, L., Bao, H., Yang, Z., Xie, Y. D., Xiaoou, W. A. N. G., Zhang, M., Huijun, Z. H. U., Su, Z., Wan, Z. H. O. U., et al. (2026) · Journal of Cross-Cultural Psychology · doi:10.1177/00220221261418017 · Cited by 2
Police Social Capital and the Effectiveness of Emergency Policing in China During COVID-19
Lin, H., Wu, T. S., Liu, H., & Kaunert, C. (2023) · Policing A Journal of Policy and Practice · doi:10.1093/police/paac112 · Cited by 2
From polarity to plurality: Perceptions of COVID‐19 and policy measures in England and Scotland
Rendall, J., McHugh, N., Baker, R. M., Mason, H., & Biosca, O. (2024) · Health Expectations · doi:10.1111/hex.14069 · Cited by 2
Mann, E., Wilson, E., Heys, M., Cameron, C., Rosenthal, D. M., Whitaker, L., Hauari, H., Hollingworth, K., & O'Toole, S. E. (2024) · Discover Social Science and Health · doi:10.1007/s44155-024-00082-4 · Cited by 2
Stay Home, Sustain Lives: Pandemic Support Networks and Social Reproduction
Read, R. (2024) · Sociology · doi:10.1177/00380385241266043 · Cited by 2
Rivas, C. A., Moore, A. P., Thomson, A., Anand, K., Lal, Z. Z., Wu, A. F.-W., & Aksoy, O. (2025) · Health and Social Care Delivery Research · doi:10.3310/kytf4381 · Cited by 3
Social Cohesion and Covid-19: an integrative reviewPreprint
Ware, P. (2023) · medRxiv · doi:10.1101/2023.07.19.23292904 · Cited by 2
Changing social and political attitudes in Ireland and Northern Ireland
ESRI, Laurence, J., Sprong, S. L., McGinnity, F., Russell, H., & Hingre, G. (2023) · doi:10.26504/rs170 · Cited by 2
Self-citationSozialer Zusammenhalt in der Krise
(2023) · transcript Verlag eBooks · doi:10.1515/9783839462065 · Cited by 1
Perceived Discrimination in Australia During the COVID-19 Pandemic: a Longitudinal Study
Sood, L., Gurvich, C., Lavale, A., Thomas, N., Kulkarni, J., & Thomas, E. H. X. (2023) · Journal of Racial and Ethnic Health Disparities · doi:10.1007/s40615-023-01798-w · Cited by 1
Metadata
- Authors
- Borkowska, M., & Laurence, J.
- Affiliations
- University of Essex (GB)
- University of Manchester (GB)
- Corresponding author
- Borkowska, Magda
- Venue
- European Societies
- Publisher
- MIT Press
- Published
- 2020-10-22
- Volume
- 23
- Issue
- sup1
- Pages
- S618-S636
- ISSN
- 1461-6696 (ISSN-L)
- 1469-8307
- OpenAlex
- W3093794251
- Cited by
- 144
- References
- 24
- Citations by year
- 2026: 10 · 2025: 26 · 2024: 24 · 2023: 30 · 2022: 30 · 2021: 23 · 2020: 1
- FWCI
- 28.09
- Type
- journal article
- Language
- en
- Open access
- hybrid
- doi.org
- Licence
- Locations
- European Societies (publishedVersion, cc-by-nc-nd)
- Research Explorer (The University of Manchester) (publishedVersion, other-oa)
- Open Access at Essex (University of Essex) (acceptedVersion)
- Funders
- Economic and Social Research Council (ES/N00812X/1,ES/S013121/1)
- Topics
- Social Sciences › Sociology and Political Science › Social Capital and Networks
- Social Sciences › Sociology and Political Science › Social impacts of COVID-19
- Social Sciences › Health › Health disparities and outcomes
- Keywords
- social cohesion, COVID-19 pandemic, community cohesion, ethnic minorities, neighborhood disadvantage, vulnerable populations, social resources, sociodemographic disparities, Understanding Society, England
About these checks
Registry, retraction, Cites and statistics results are computed, not judged, with one exception: a printed reference that no index lists is read once by a model before it counts as a citation error. Claims are extracted by a model and kept only when their quote appears verbatim in the text; each cited source is then checked, with a model’s help, for whether it says what the claim relies on. Those verdicts can be wrong — read the claim’s quote and the cited source before relying on one.
Statistics and arithmetic are recomputed, not judged.
Confidence bands are shown only for fields calibrated on our annotated test set. None is calibrated yet, so no band is shown.
What counts as a claim ›How we measure confidence ›How we check this ›
Are you an author, or do you see a problem with this page? Request a review
