

The DOI matches its Crossref record; 65 of the 65 references it cites were found in a registry or an index.
Age- and disease-dependent increase of the mitophagy marker phospho-ubiquitin in normal aging and Lewy body disease
Open accessAbstract
Although exact causes of Parkinson disease (PD) remain enigmatic, mitochondrial dysfunction is increasingly appreciated as a key determinant of dopaminergic neuron susceptibility in both familial and sporadic PD. Two genes associated with recessive, early-onset PD encode the ubiquitin (Ub) kinase PINK1 and the E3 Ub ligase PRKN/PARK2/Parkin, which together orchestrate a protective mitochondrial quality control (mitoQC) pathway. Upon stress, both enzymes cooperatively identify and decorate damaged mitochondria with phosphorylated poly-Ub (p-S65-Ub) chains. This specific label is subsequently recognized by autophagy receptors that further facilitate mitochondrial degradation in lysosomes (mitophagy). Here, we analyzed human post-mortem brain specimens and identified distinct pools of p-S65-Ub-positive structures that partially colocalized with markers of mitochondria, autophagy, lysosomes and/or granulovacuolar degeneration bodies. We further quantified levels and distribution of the 'mitophagy tag' in 2 large cohorts of brain samples from normal aging and Lewy body disease (LBD) cases using unbiased digital pathology. Somatic p-S65-Ub structures independently increased with age and disease in distinct brain regions and enhanced levels in LBD brain were age- and Braak tangle stage-dependent. Additionally, we observed significant correlations of p-S65-Ub with LBs and neurofibrillary tangle levels in disease. The degree of co-existing p-S65-Ub signals and pathological PD hallmarks increased in the pre-mature stage, but decreased in the late stage of LB or tangle aggregation. Altogether, our study provides further evidence for a potential pathogenic overlap among different forms of PD and suggests that p-S65-Ub can serve as a biomarker for mitochondrial damage in aging and disease. ABBREVIATIONS: BLBD: brainstem predominant Lewy body disease; CCCP: carbonyl cyanide m-chlorophenyl hydrazone; DLB: dementia with Lewy bodies; DLBD: diffuse neocortical Lewy body disease; EOPD: early-onset Parkinson disease; GVB: granulovacuolar degeneration body; LB: Lewy body; LBD: Lewy body disease; mitoQC: mitochondrial quality control; nbM: nucleus basalis of Meynert; PD: Parkinson disease; PDD: Parkinson disease with dementia; p-S65-Ub: PINK1-phosphorylated serine 65 ubiquitin; SN: substantia nigra; TLBD: transitional Lewy body disease; Ub: ubiquitin.
Overview
The claims and statistics of this paper haven’t been checked yet.
Run the check — free, no account needed. It reads the open-access text and checks the sources it cites.
Integrity signals
Registry
Cites
Statistics
Figures
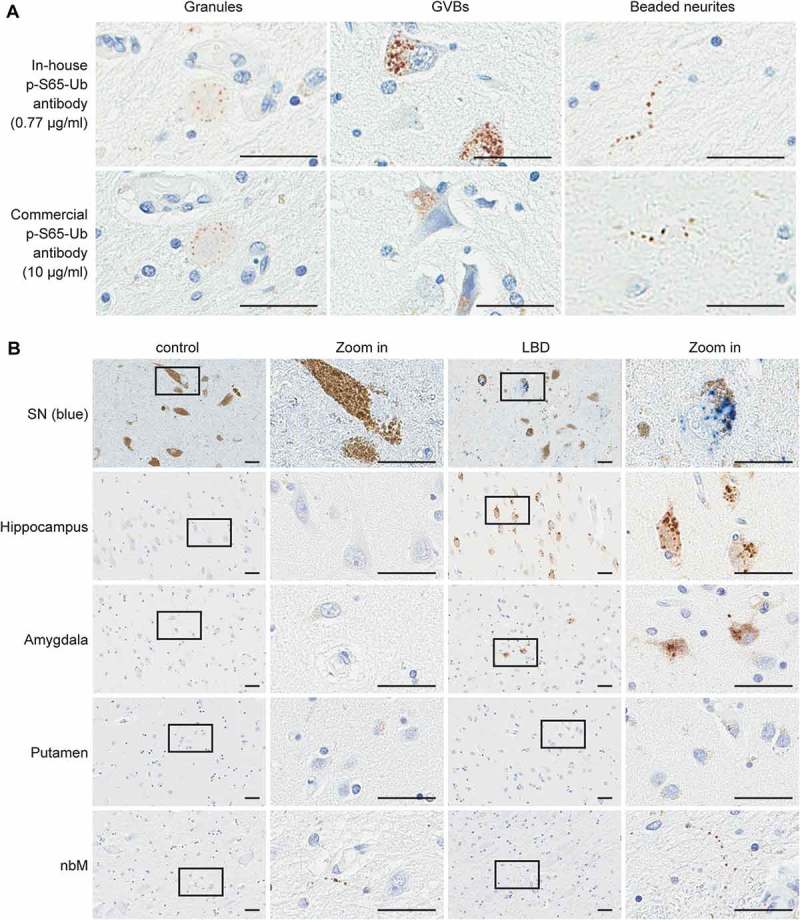
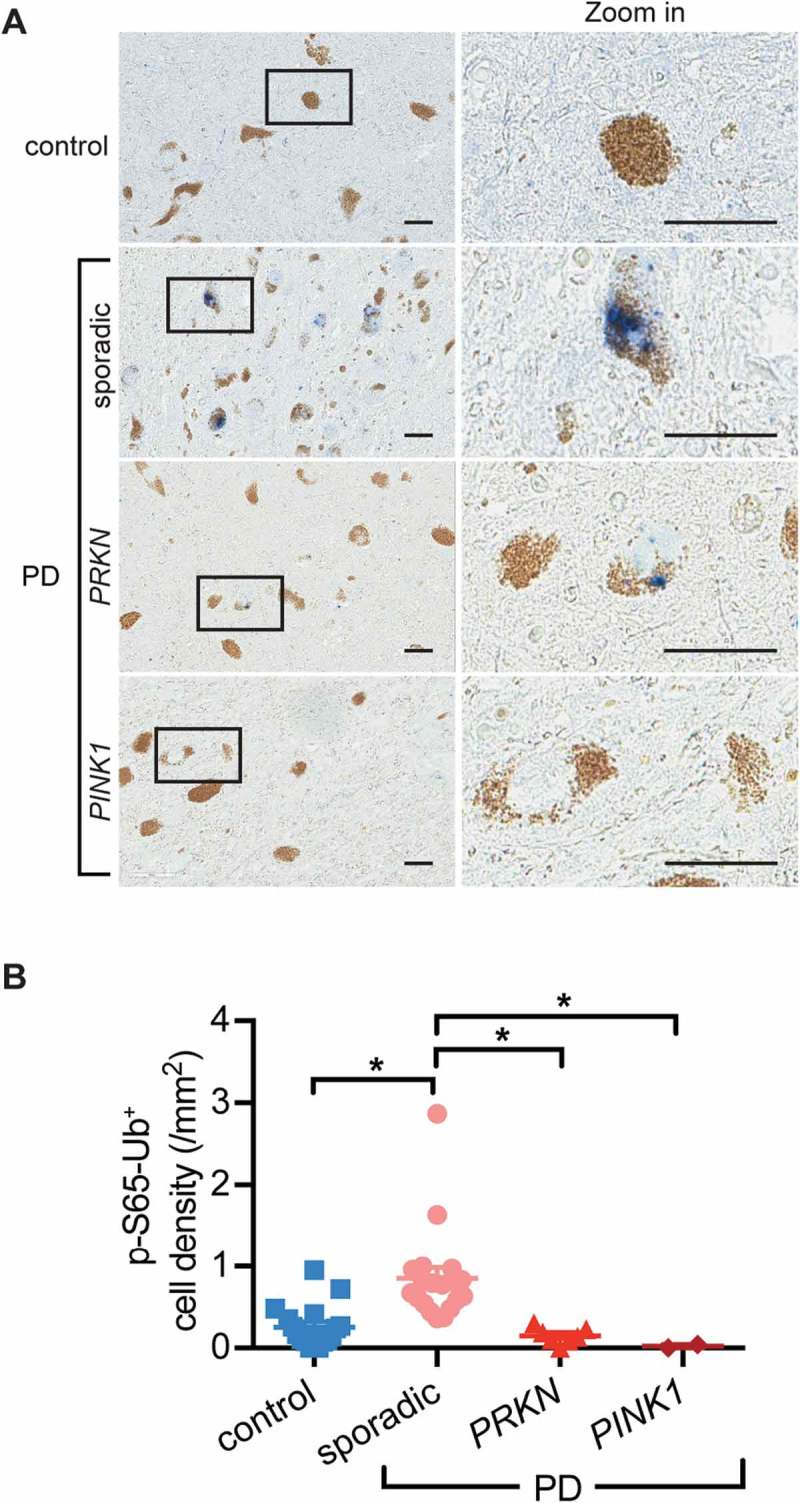
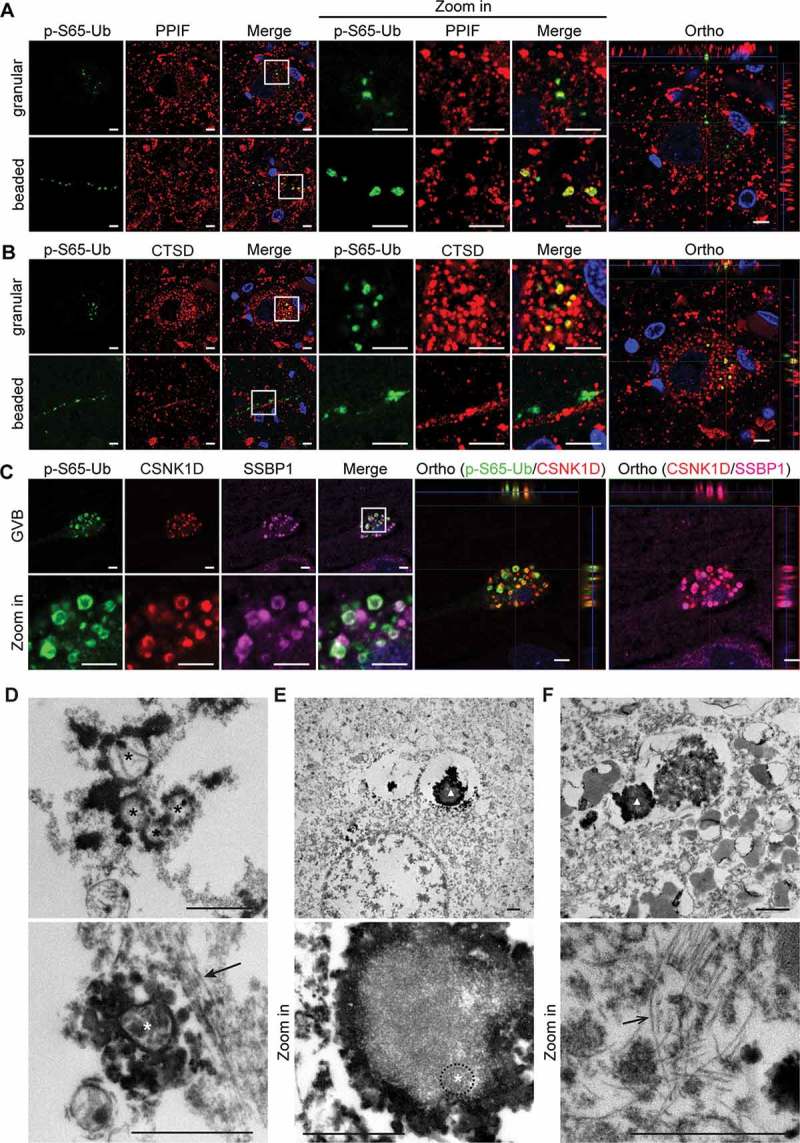
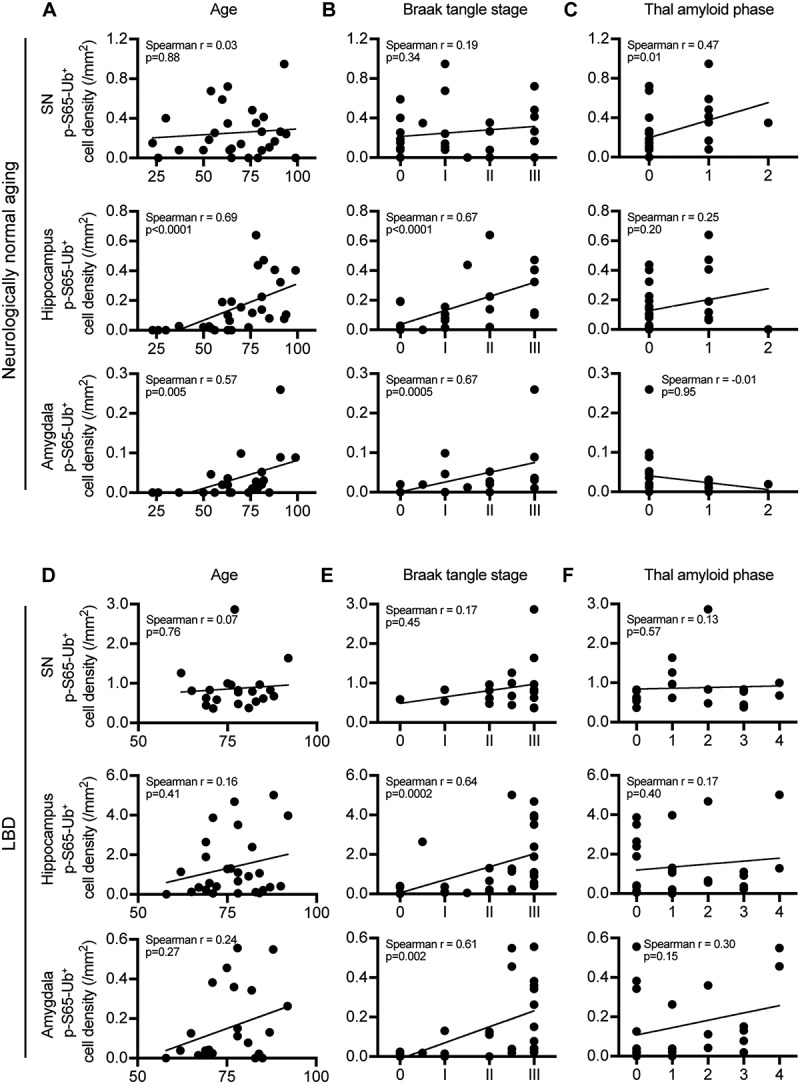
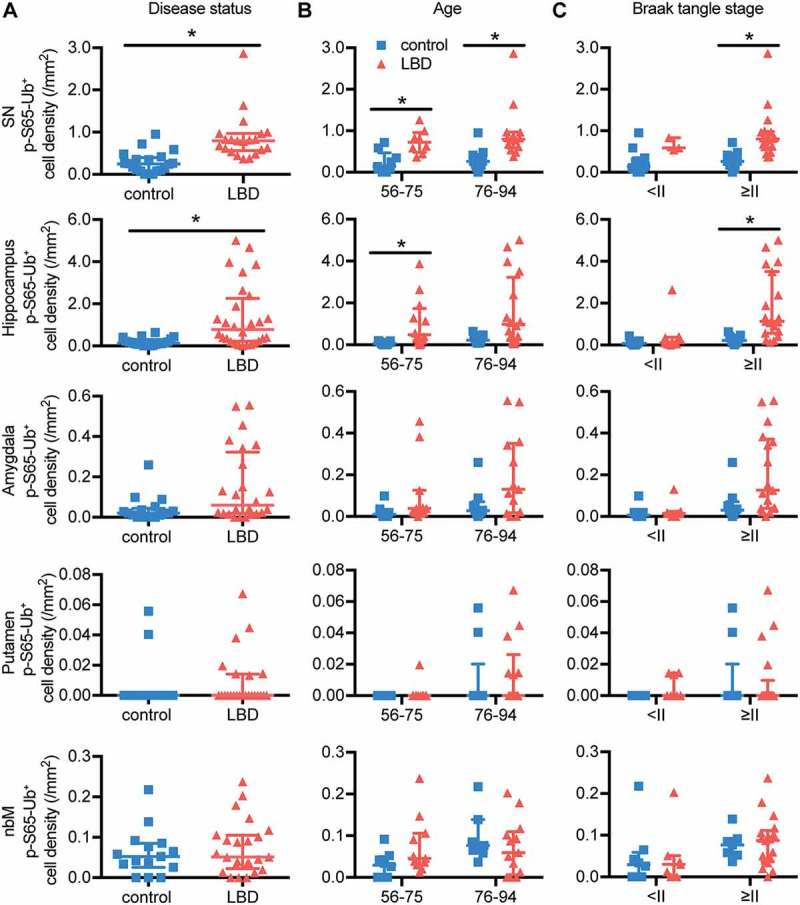
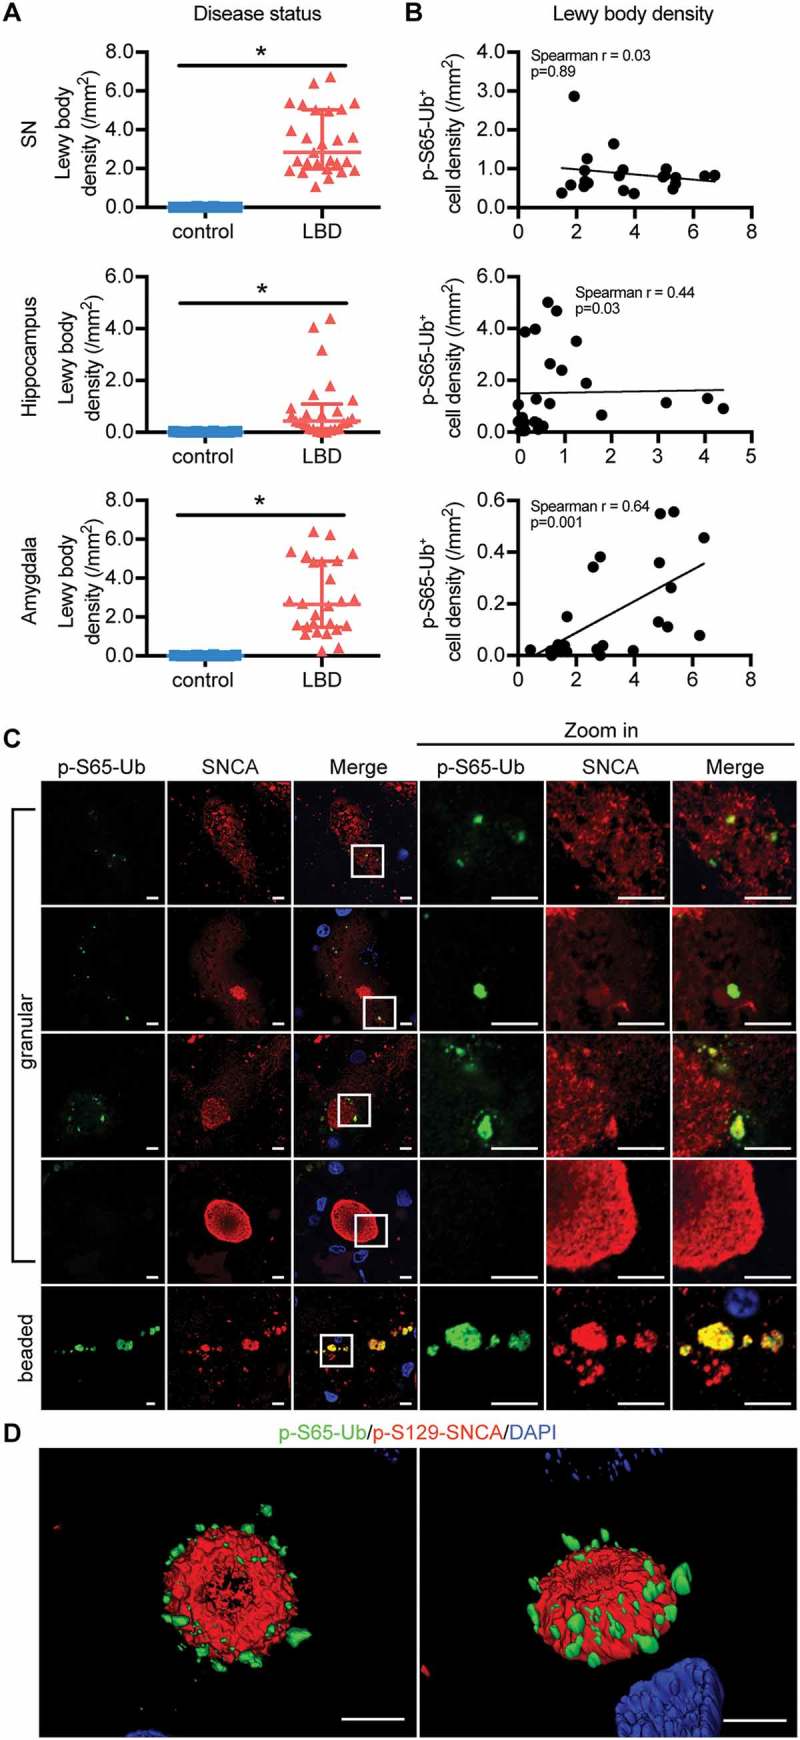
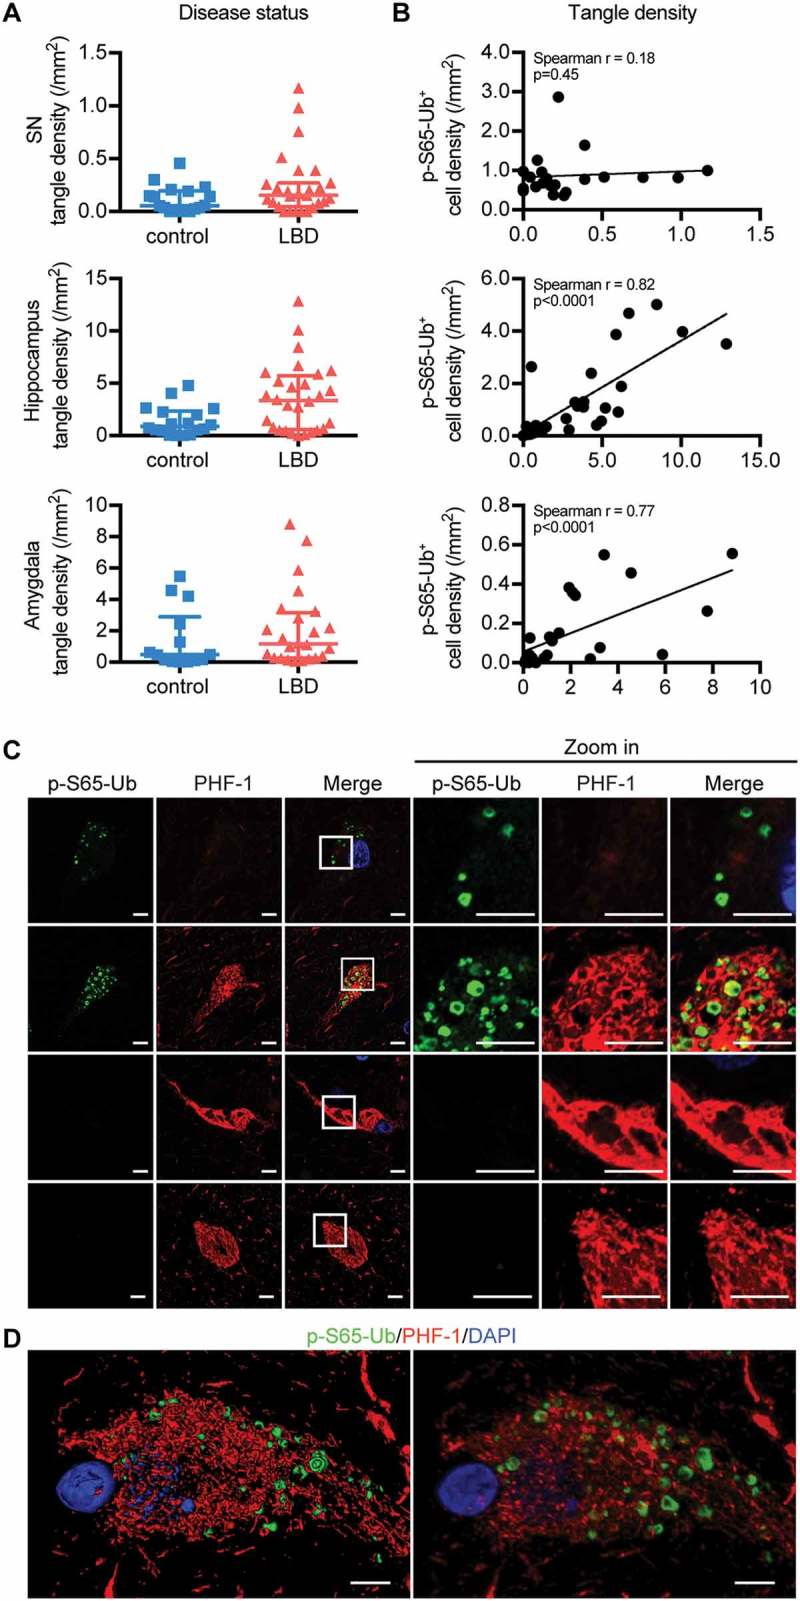
Verification
Claims the paper makes
The claims and statistics of this paper haven’t been checked yet.
Run the check — free, no account needed. It reads the open-access text and checks the sources it cites.
Claims other papers make about this one
Each is checked against this paper’s own text: does it say what the citing paper says it does?
The cited source says what the claim attributes to it.
In the citing paper
“Most recently, phospho-ubiquitin mitophagy markers label granulovacuolar bodies and their abundance has been shown to correlate with neurofibrillary tangle density, suggesting they may be a cellular response to damage in the neurons [80].”
From The neuropathological diagnosis of Alzheimer's disease (2019) · cites this paper as [80]
The cited source says what the claim attributes to it.
In the citing paper
“pS65-Ub has been shown to accumulate during aging, stress, and disease [13, 14]”
From miRNA family miR-29 inhibits PINK1-PRKN signaling via ATG9A (2026) · cites this paper as [14]
Self-check
Percentages, sums and reported differences re-computed from the paper’s own numbers.
The self-check needs the paper’s full text.
Citations
Cites
Staging of brain pathology related to sporadic Parkinson’s disease
Braak, H., Tredici, K. D., Rüb, U., de Vos, R. A. I., Jansen Steur, E. N. H., & Braak, E. (2003) · Neurobiology of Aging · doi:10.1016/s0197-4580(02)00065-9 · Cited by 10,777
Amyloid oligomers exacerbate tau pathology in a mouse model of tauopathy
Selenica, M.-L. B., Brownlow, M., Jimenez, J. P., Lee, D. C., Pena, G., Dickey, C. A., Gordon, M. N., & Morgan, D. (2013) · Neurodegenerative Diseases · doi:10.1159/000337230 · Cited by 10,359
Diagnosis and management of dementia with Lewy bodies: Fourth consensus report of the DLB Consortium
McKeith, I. G., Boeve, B. F., Dickson, D. W., Halliday, G., Taylor, J.-P., Weintraub, D., Aarsland, D., Galvin, J., Attems, J., Ballard, C. G., et al. (2017) · Neurology · doi:10.1212/wnl.0000000000004058 · Cited by 4,476
Self-citationClinical diagnostic criteria for dementia associated with Parkinson’s disease
Emre, M., Aarsland, D., Brown, R., Burn, D. J., Duyckaerts, C., Mizuno, Y., Broe, G. A., Cummings, J., Dickson, D. W., Gauthier, S., et al. (2007) · Movement Disorders · doi:10.1002/mds.21507 · Cited by 3,027
Self-citationPINK1 Is Selectively Stabilized on Impaired Mitochondria to Activate Parkin
Narendra, D. P., Jin, S. M., Tanaka, A., Suen, D.-F., Gautier, C. A., Shen, J., Cookson, M. R., & Youle, R. J. (2010) · PLoS Biology · doi:10.1371/journal.pbio.1000298 · Cited by 2,944
PINK1/Parkin-mediated mitophagy is dependent on VDAC1 and p62/SQSTM1
Geisler, S., Holmström, K. M., Skujat, D., Fiesel, F. C., Rothfuss, O. C., Kahle, P. J., & Springer, W. (2010) · Nature Cell Biology · doi:10.1038/ncb2012 · Cited by 2,835
Self-citationThe ubiquitin kinase PINK1 recruits autophagy receptors to induce mitophagy
Lazarou, M., Sliter, D. A., Kane, L. A., Sarraf, S. A., Wang, C., Burman, J. L., Sideris, D. P., Fogel, A. I., & Youle, R. J. (2015) · Nature · doi:10.1038/nature14893 · Cited by 2,774
Stages of the Pathologic Process in Alzheimer Disease: Age Categories From 1 to 100 Years
Braak, H., Thal, D. R., Ghebremedhin, E., & Del Tredici, K. (2011) · Journal of Neuropathology & Experimental Neurology · doi:10.1097/nen.0b013e318232a379 · Cited by 2,194
Matsuda, N., Sato, S., Shiba, K., Okatsu, K., Saisho, K., Gautier, C. A., Sou, Y.-S., Saiki, S., Kawajiri, S., Sato, F., et al. (2010) · Journal of Cell Biology · doi:10.1083/jcb.200910140 · Cited by 1,969
Lees, A. J., Hardy, J., & Revesz, T. (2009) · The Lancet · doi:10.1016/s0140-6736(09)60492-x · Cited by 1,956
Research works printed but not linked: 2
- Kosaka K, 1984, Clin Neuropathol, 3, 185
- van Elteren PH, 1960, Bull Inst Int Stat, 37, 351
Cited by
Sorted by citations
The neuropathological diagnosis of Alzheimer's disease
DeTure, M. A., & Dickson, D. W. (2019) · Molecular Neurodegeneration · doi:10.1186/s13024-019-0333-5 · Cited by 3,329
“Most recently, phospho-ubiquitin mitophagy markers label granulovacuolar bodies and their abundance has been shown to correlate with neurofibrillary tangle density, suggesting they may be a cellular response to damage in the neurons [80].”
BackgroundSelf-citationPINK1/PARKIN signalling in neurodegeneration and neuroinflammation
Quinn, P. M. J., Moreira, P. I., Ambrósio, A. F., & Alves, C. H. (2020) · Acta Neuropathologica Communications · doi:10.1186/s40478-020-01062-w · Cited by 503
Mitochondrial dysfunction and mitophagy in parkinson’s disease: from mechanism to therapy
Malpartida, A. B., Williamson, M., Narendra, D. P., Wade-Martins, R., & Ryan, B. J. (2021) · Trends in Biochemical Sciences · doi:10.1016/j.tibs.2020.11.007 · Cited by 482
PINK1/Parkin-mediated mitophagy in neurodegenerative diseases
Li, J., Yang, D., Li, Z., Zhao, M., Wang, D., Sun, Z., Wen, P., Dai, Y., Gou, F., Ji, Y., et al. (2022) · Ageing Research Reviews · doi:10.1016/j.arr.2022.101817 · Cited by 406
Mitophagy curtails cytosolic mtDNA-dependent activation of cGAS/STING inflammation during aging
Jiménez‐Loygorri, J. I., Villarejo‐Zori, B., Viedma-Poyatos, Á., Zapata‐Muñoz, J., Benítez‐Fernández, R., Frutos-Lisón, M. D., Tomás-Barberán, F. A., Espı́n, J. C., Área-Gómez, E., Gómez-Durán, A., et al. (2024) · Nature Communications · doi:10.1038/s41467-024-45044-1 · Cited by 394
Metadata
- Authors
- Hou, X., Fiesel, F. C., Truban, D., Castanedes Casey, M., Lin, W.-L., Soto, A. I., Tacik, P., Rousseau, L. G., Diehl, N. N., Heckman, M. G., Lorenzo-Betancor, O., Ferrer, I., Arbelo, J. M., Steele, J. C., Farrer, M. J., Cornejo-Olivas, M., Torres, L., Mata, I. F., Graff-Radford, N. R., Wszolek, Z. K., Ross, O. A., Murray, M. E., Dickson, D. W., & Springer, W.
- Affiliations
- Mayo Clinic in Florida (US)
- Mayo Clinic (US)
- Department of Neuroscience, Mayo Clinic, Jacksonville, FL, USA
- Institut de Neuropatologia, Servei d’Anatomia Patològica, Hospital Universitari de Bellvitge, Hospitalet del Llobregat, Barcelona, Spain
- Hospital Universitario Insular de Gran Canaria (ES)
- Micronesian Health Study II, Tamuning, Guam
- University of British Columbia (CA)
- Northern Pacific Global Health Research Fellows Training Consortium, Bethesda, MD, USA
- Instituto Nacional de Ciencias Neurológicas (PE)
- University of Washington (US)
- Department of Neurology, Mayo Clinic, Jacksonville, FL, USA
- Corresponding author
- Springer, Wolfdieter
- ORCID
- Venue
- Autophagy
- Publisher
- Informa UK Limited
- Published
- 2018-07-28
- Volume
- 14
- Issue
- 8
- Pages
- 1404-1418
- ISSN
- 1554-8627 (ISSN-L)
- 1554-8635
- PMC
- PMC6372017
- OpenAlex
- W2810603360
- Cited by
- 147
- References
- 65
- Citations by year
- 2026: 18 · 2025: 28 · 2024: 16 · 2023: 19 · 2022: 17 · 2021: 13 · 2020: 25 · 2019: 10 · 2018: 1
- FWCI
- 8.32
- Type
- journal article
- Language
- en
- Open access
- hybrid
- doi.org
- Licence
- cc-by-nc-nd
- Locations
- Autophagy (publishedVersion, cc-by-nc-nd)
- Europe PMC (PubMed Central) (publishedVersion, cc-by-nc-nd)
- PubMed Central (publishedVersion, cc-by-nc-nd)
- PubMed (publishedVersion)
- Dipòsit Digital de la Universitat de Barcelona (Universitat de Barcelona) (acceptedVersion)
- Acceda (Universidad de Las Palmas de Gran Canaria) (submittedVersion)
- RECERCAT (Consorci de Serveis Universitaris de Catalunya) (submittedVersion, public-domain)
- Funders
- HHS | NIH | National Institute of Neurological Disorders and Stroke (R01 NS085070, U54 NS100693, R01 NS078086, P50 NS072187)
- Topics
- Health Sciences › Medicine › Clinical Neurology › Parkinson's Disease Mechanisms and Treatments
- Life Sciences › Biochemistry, Genetics and Molecular Biology › Cell Biology › Autophagy in Disease and Therapy
- Life Sciences › Biochemistry, Genetics and Molecular Biology › Molecular Biology › Nuclear Receptors and Signaling
- Keywords
- mitophagy, Parkinson's disease, Lewy body disease, normal aging, mitochondrial quality control, PINK1, Parkin, ubiquitin phosphorylation, lysosomes, neurofibrillary tangles, biomarkers, dopaminergic neurons, mitochondrial dysfunction
- MeSH terms
- Aged, Aged, 80 and over, Aging, Brain, Female, HeLa Cells, Humans, Male, Middle Aged, Mutation, Phosphorylation, Phosphoserine, Protein Binding, Cohort Studies, Biomarkers, tau Proteins, Lewy Body Disease, Ubiquitin, alpha-Synuclein, Mitophagy
About these checks
Registry, retraction, Cites and statistics results are computed, not judged, with one exception: a printed reference that no index lists is read once by a model before it counts as a citation error. Claims are extracted by a model and kept only when their quote appears verbatim in the text; each cited source is then checked, with a model’s help, for whether it says what the claim relies on. Those verdicts can be wrong — read the claim’s quote and the cited source before relying on one.
Statistics and arithmetic are recomputed, not judged.
Confidence bands are shown only for fields calibrated on our annotated test set. None is calibrated yet, so no band is shown.
What counts as a claim ›How we measure confidence ›How we check this ›
Are you an author, or do you see a problem with this page? Request a review
