

The DOI matches its Crossref record; 65 of the 65 references it cites were found in a registry or an index.
Production of α2,6-sialylated IgG1 in CHO cells
Open accessAbstract
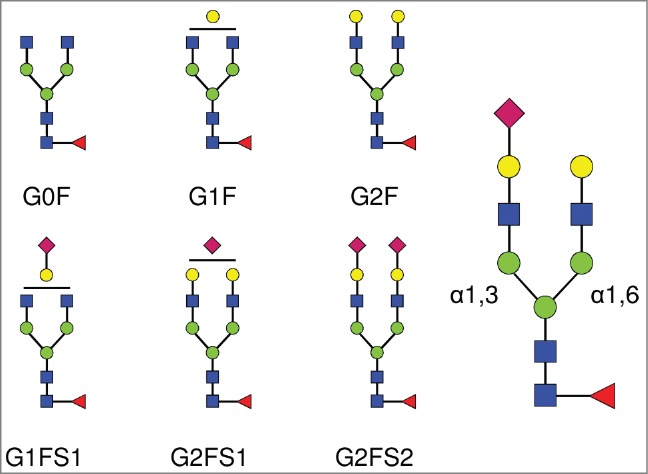
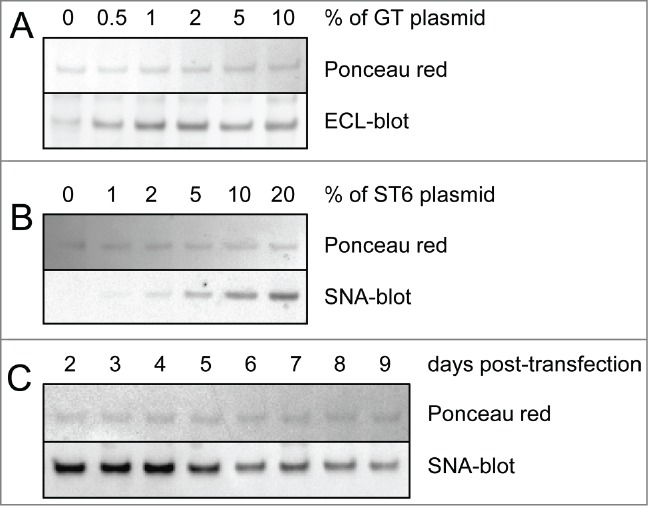
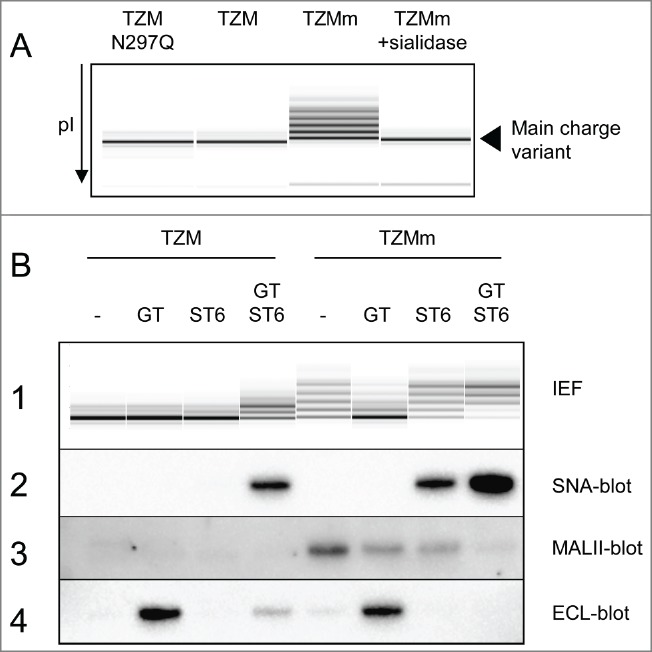
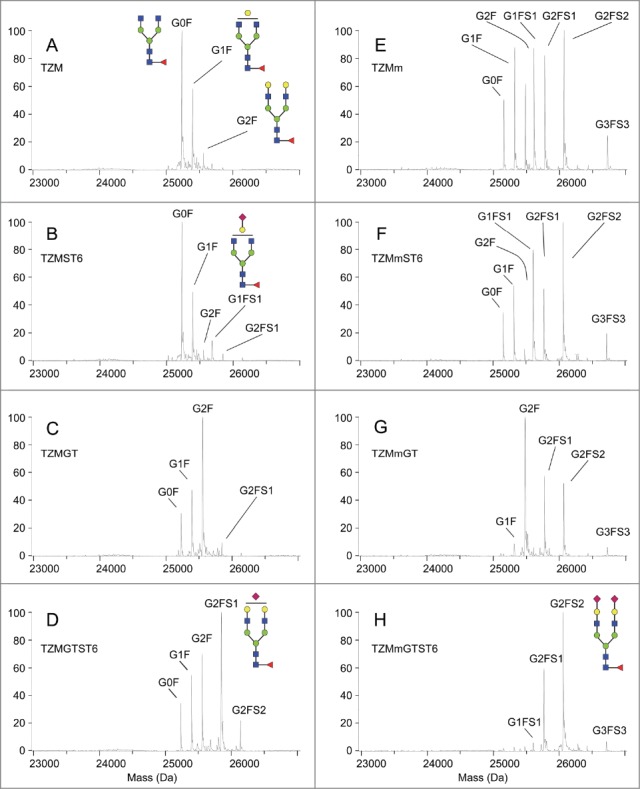
The presence of α2,6-sialic acids on the Fc N-glycan provides anti-inflammatory properties to the IgGs through a mechanism that remains unclear. Fc-sialylated IgGs are rare in humans as well as in industrial host cell lines such as Chinese hamster ovary (CHO) cells. Facilitated access to well-characterized α2,6-sialylated IgGs would help elucidate the mechanism of this intriguing IgG's effector function. This study presents a method for the efficient Fc glycan α2,6-sialylation of a wild-type and a F243A IgG1 mutant by transient co-expression with the human α2,6-sialyltransferase 1 (ST6) and β1,4-galactosyltransferase 1 (GT) in CHO cells. Overexpression of ST6 alone only had a moderate effect on the glycoprofiles, whereas GT alone greatly enhanced Fc-galactosylation, but not sialylation. Overexpression of both GT and ST6 was necessary to obtain a glycoprofile dominated by α2,6-sialylated glycans in both antibodies. The wild-type was composed of the G2FS(6)1 glycan (38%) with remaining unsialylated glycans, while the mutant glycoprofile was essentially composed of G2FS(6)1 (25%), G2FS(3,6)2 (16%) and G2FS(6,6)2 (37%). The α2,6-linked sialic acids represented over 85% of all sialic acids in both antibodies. We discuss how the limited sialylation level in the wild-type IgG1 expressed alone or with GT results from the glycan interaction with Fc's amino acid residues or from intrinsic galactosyl- and sialyl-transferases substrate specificities.
Overview
The claims and statistics of this paper haven’t been checked yet.
Run the check — free, no account needed. It reads the open-access text and checks the sources it cites.
Integrity signals
Registry
Cites
Statistics
Figures
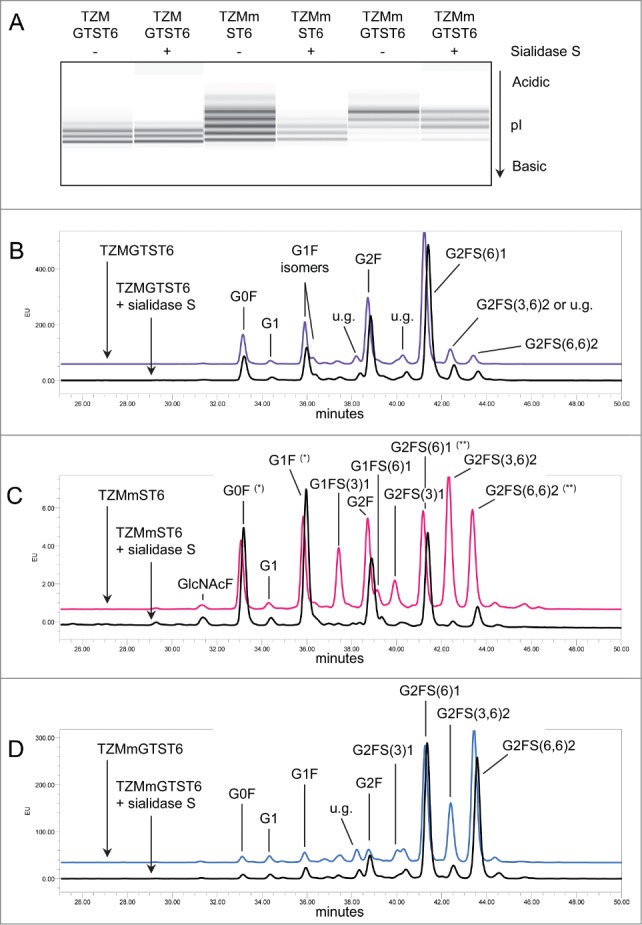
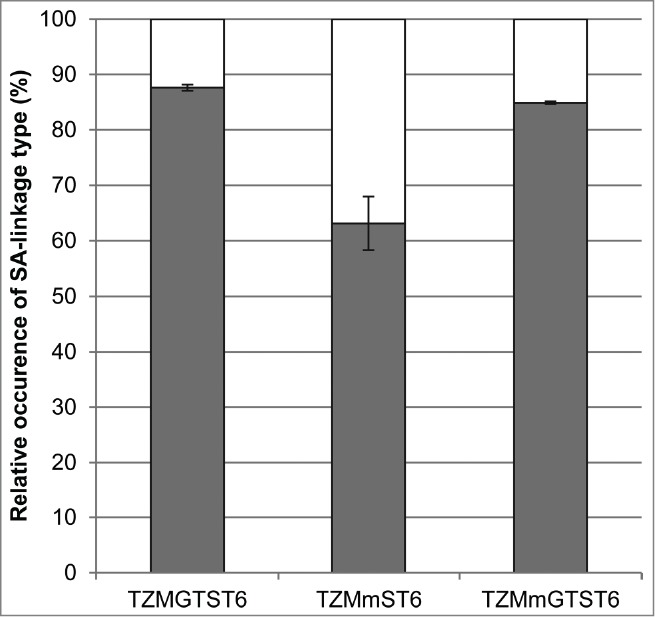
Verification
Claims the paper makes
The claims and statistics of this paper haven’t been checked yet.
Run the check — free, no account needed. It reads the open-access text and checks the sources it cites.
Claims other papers make about this one
Each is checked against this paper’s own text: does it say what the citing paper says it does?
The cited source says what the claim attributes to it.
In the citing paper
“Co-expression of ST6Gal1 and β4GalT1 in CHO cells also significantly enhanced the sialylation level of the mutated version of trastuzumab (Raymond et al., 2015).”
From Therapeutic glycoprotein production in mammalian cells (2017) · cites this paper as Raymond et al., 2015
Self-check
Percentages, sums and reported differences re-computed from the paper’s own numbers.
The self-check needs the paper’s full text.
Citations
Cites
Shields, R. L., Lai, J., Keck, R., O'Connell, L. Y., Hong, K., Meng, Y. G., Weikert, S. H. A., & Presta, L. G. (2002) · Journal of Biological Chemistry · doi:10.1074/jbc.m202069200 · Cited by 1,835
Anti-Inflammatory Activity of Immunoglobulin G Resulting from Fc Sialylation
Kaneko, Y., Nimmerjahn, F., & Ravetch, J. V. (2006) · Science · doi:10.1126/science.1129594 · Cited by 1,754
Shinkawa, T., Nakamura, K., Yamane, N., Shoji-Hosaka, E., Kanda, Y., Sakurada, M., Uchida, K., Anazawa, H., Satoh, M., Yamasaki, M., et al. (2003) · Journal of Biological Chemistry · doi:10.1074/jbc.m210665200 · Cited by 1,413
The Impact of Glycosylation on the Biological Function and Structure of Human Immunoglobulins
Arnold, J. N., Wormald, M. R., Sim, R. B., Rudd, P. M., & Dwek, R. A. (2006) · Annual Review of Immunology · doi:10.1146/annurev.immunol.25.022106.141702 · Cited by 1,354
Durocher, Y. (2002) · Nucleic Acids Research · doi:10.1093/nar/30.2.e9 · Cited by 1,037
Self-citationRecapitulation of IVIG anti-inflammatory activity with a recombinant IgG Fc
Anthony, R. M., Nimmerjahn, F., Ashline, D. J., Reinhold, V. N., Paulson, J. C., & Ravetch, J. V. (2008) · Science · doi:10.1126/science.1154315 · Cited by 849
Therapeutic antibodies for autoimmunity and inflammation
Chan, A. C., & Carter, P. J. (2010) · Nature reviews. Immunology · doi:10.1038/nri2761 · Cited by 846
Bigge, J. C., Patel, T. P., Bruce, J., Goulding, P. N., Charles, S., & Parekh, R. B. (1995) · Analytical Biochemistry · doi:10.1006/abio.1995.1468 · Cited by 825
Krapp, S., Mimura, Y., Jefferis, R., Huber, R., & Sondermann, P. (2003) · Journal of Molecular Biology · doi:10.1016/s0022-2836(02)01250-0 · Cited by 690
The human sialyltransferase family
Harduin‐Lepers, A., Vallejo‐Ruiz, V., Krzewinski‐Recchi, M., Samyn-Petit, B., Julien, S., & Delannoy, P. (2001) · Biochimie · doi:10.1016/s0300-9084(01)01301-3 · Cited by 580
Research works printed but not linked: 4
- Scott AM, 2012, Cancer Immun, 12, 14
- Ferrara C, 2006, Biotechnol Appl Biochem, 93, 851
- 10.1111/j.1537-2995.2011.03517 · DOI
- Royle L, 2006, Methods Mol Biol, 347, 125
Cited by
Sorted by citations
Items 101–106 of 106
Serafin, B., Henry, O., & Crescenzo, G. D. (2026) · Glycobiology · doi:10.1093/glycob/cwag019
Computationally inspired glycoengineering to maximise mAb β4-galactosylation
Gómez, I. A., Ghahremanzamaneh, M., Tsopanoglou, A., Blanco, A., Carillo, S., Bones, J., & del Val, I. J. (2026) · Metabolic Engineering · doi:10.1016/j.ymben.2026.102549
Separation of Monoclonal Antibody Aggregates Using an Analytical Ultrafiltration Technique
Ghosh, R., Ingawale, M., & Durocher, Y. (2026) · Membranes · doi:10.3390/membranes16060207
Self-citationGlycosylation in Quality and Safety of Therapeutic Proteins
Matsumoto, Y., Kim, J., McKenna, K. R., Biel, T. G., Kirshner, S., Falkowski, V. M., & Ju, T. (2026) · Pharmacological Reviews · doi:10.1016/j.pharmr.2026.100163
Glycan-intrinsic monoclonal antibody biomanufacturing
Gyorgypal, A. (2026) · Frontiers in Chemical Engineering · doi:10.3389/fceng.2026.1955792
Metadata
- Authors
- Raymond, C., Robotham, A., Spearman, M., Butler, M., Kelly, J., & Durocher, Y.
- Affiliations
- National Research Council Canada (CA)
- University of Manitoba (CA)
- Corresponding author
- Durocher, Yves
- Venue
- mAbs
- Publisher
- Informa UK Limited
- Published
- 2015-04-15
- Volume
- 7
- Issue
- 3
- Pages
- 571-583
- ISSN
- 1942-0862 (ISSN-L)
- 1942-0870
- PMC
- PMC4622614
- OpenAlex
- W1592578892
- Cited by
- 106
- References
- 65
- Citations by year
- 2026: 6 · 2025: 5 · 2024: 10 · 2023: 10 · 2022: 6 · 2021: 10 · 2020: 9 · 2019: 11 · 2018: 12 · 2017: 11 · 2016: 9 · 2015: 7
- FWCI
- 5.65
- Type
- journal article
- Language
- en
- Open access
- gold
- doi.org
- Licence
- cc-by-nc
- Locations
- mAbs (publishedVersion, cc-by-nc)
- PubMed Central (publishedVersion, cc-by-nc)
- PubMed (publishedVersion)
- NPARC (submittedVersion)
- Funders
- Natural Sciences and Engineering Research Council of Canada
- Topics
- Life Sciences › Biochemistry, Genetics and Molecular Biology › Molecular Biology › Viral Infectious Diseases and Gene Expression in Insects
- Life Sciences › Biochemistry, Genetics and Molecular Biology › Molecular Biology › Glycosylation and Glycoproteins Research
- Life Sciences › Immunology and Microbiology › Immunology › Monoclonal and Polyclonal Antibodies Research
- Keywords
- α2,6-sialylation, IgG1, Fc glycan, sialic acid, beta-1,4-galactosyltransferase, CHO cells, antibody glycosylation
- MeSH terms
- beta-D-Galactoside alpha 2-6-Sialyltransferase, Animals, Antibodies, Monoclonal, Cricetulus, Cricetinae, Humans, Immunoglobulin G, N-Acetyllactosamine Synthase, Sialic Acids, Sialyltransferases, Antigens, CD, CHO Cells, Amino Acid Substitution, Mutation, Missense
About these checks
Registry, retraction, Cites and statistics results are computed, not judged, with one exception: a printed reference that no index lists is read once by a model before it counts as a citation error. Claims are extracted by a model and kept only when their quote appears verbatim in the text; each cited source is then checked, with a model’s help, for whether it says what the claim relies on. Those verdicts can be wrong — read the claim’s quote and the cited source before relying on one.
Statistics and arithmetic are recomputed, not judged.
Confidence bands are shown only for fields calibrated on our annotated test set. None is calibrated yet, so no band is shown.
What counts as a claim ›How we measure confidence ›How we check this ›
Are you an author, or do you see a problem with this page? Request a review
