

The DOI matches its Crossref record; 1 of the 1 references it cites were found in a registry or an index.
Visualization of the Peroxisomal Compartment in Living Mammalian Cells: Dynamic Behavior and Association with Microtubules
Abstract
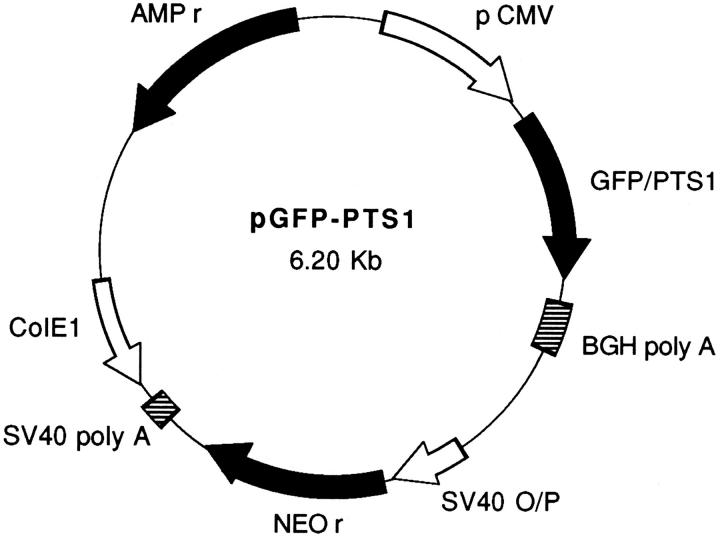
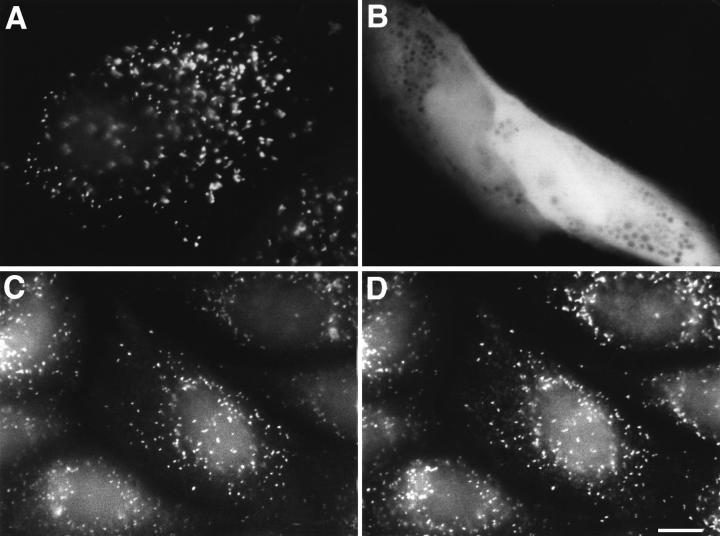
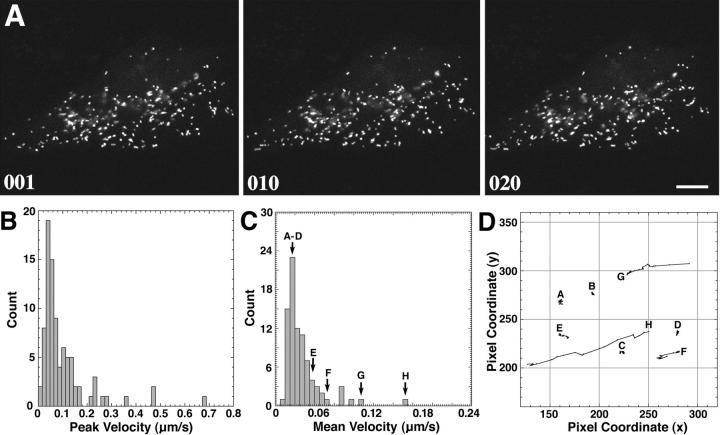
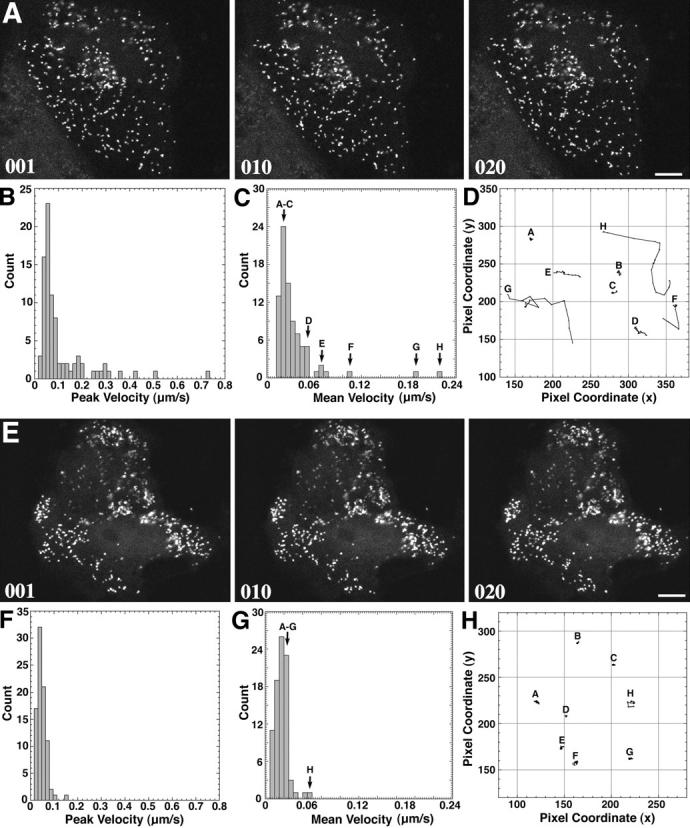
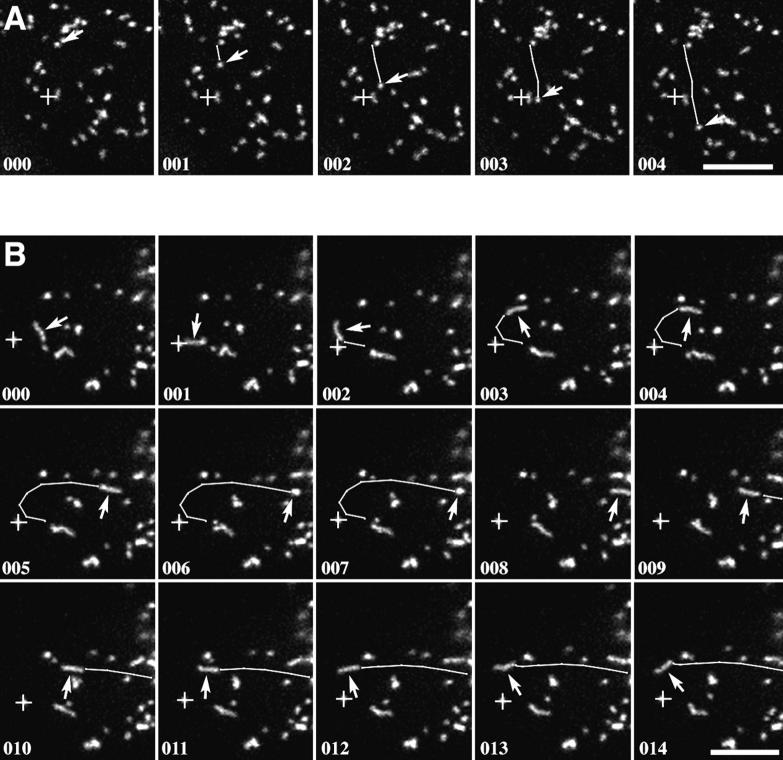
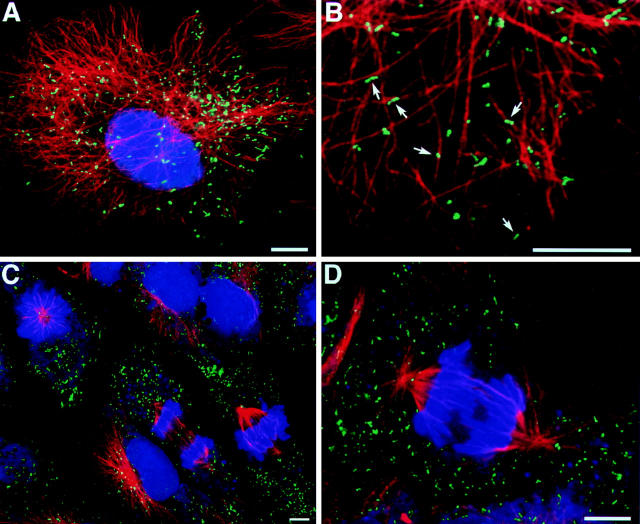
Peroxisomes in living CV1 cells were visualized by targeting the green fluorescent protein (GFP) to this subcellular compartment through the addition of a COOH-terminal peroxisomal targeting signal 1 (GFP–PTS1). The organelle dynamics were examined and analyzed using time-lapse confocal laser scanning microscopy. Two types of movement could be distinguished: a relatively slow, random, vibration-like movement displayed by the majority (∼95%) of the peroxisomes, and a saltatory, fast directional movement displayed by a small subset (∼5%) of the peroxisomes. In the latter instance, peak velocities up to 0.75 μm/s and sustained directional velocities up to 0.45 μm/s over 11.5 μm were recorded. Only the directional type of motion appeared to be energy dependent, whereas the vibrational movement continued even after the cells were depleted of energy. Treatment of cells, transiently expressing GFP–PTS1, with microtubule-destabilizing agents such as nocodazole, vinblastine, and demecolcine clearly altered peroxisome morphology and subcellular distribution and blocked the directional movement. In contrast, the microtubule-stabilizing compound paclitaxel, or the microfilament-destabilizing drugs cytochalasin B or D, did not exert these effects. High resolution confocal analysis of cells expressing GFP–PTS1 and stained with anti-tubulin antibodies revealed that many peroxisomes were associated with microtubules. The GFP–PTS1–labeled peroxisomes were found to distribute themselves in a stochastic, rather than ordered, manner to daughter cells at the time of mitosis.
Overview
The claims and statistics of this paper haven’t been checked yet.
Run the check — free, no account needed. It reads the open-access text and checks the sources it cites.
Integrity signals
Registry
Cites
Statistics
Figures
Verification
Claims the paper makes
The claims and statistics of this paper haven’t been checked yet.
Run the check — free, no account needed. It reads the open-access text and checks the sources it cites.
Claims other papers make about this one
Each is checked against this paper’s own text: does it say what the citing paper says it does?
In the citing paper
“In addition, mitophagy can be induced by culturing the cells in a nonfermentable carbon source to post-log phase.”
From Guidelines for the use and interpretation of assays for monitoring autophagy (4th edition) 1 (2021) · cites this paper as [1065]
In the citing paper
“In this case, mitophagy may be induced because the energy demand is lower at post-log phase and the mitochondrial mass exceeds the cell's needs [171, 1064, 1065].”
From Guidelines for the use and interpretation of assays for monitoring autophagy (4th edition) 1 (2021) · cites this paper as [1065]
Self-check
Percentages, sums and reported differences re-computed from the paper’s own numbers.
The self-check needs the paper’s full text.
Citations
Cites
Identification of a novel force-generating protein, kinesin, involved in microtubule-based motility
VALE, R., REESE, T., & SHEETZ, M. (1985) · Cell · doi:10.1016/s0092-8674(85)80099-4 · Cited by 1,993 · cited 1×
“Kinesins involved in both minus and plus end–directed movement have been described (Vale et al., 1985; McDonald et al., 1990).”
Background
Research works printed but not linked: 40
- Allan, 1994, Organelle movement. Dynactin: portrait of a dynein regulator, Curr Biol, 4, 1000, 10.1016/S0960-9822(00)00225-6 · DOI
- Baumann, 1995, Microtubule-associated movement of mitochondria and small particles in Acanthamoeba castellanii., Cell Motil Cytoskeleton, 32, 305, 10.1002/cm.970320407 · DOI
- Birky, 1983, The partitioning of cytoplasmic organelles at cell division, Int Rev Cytol, 15, 49
- Cole, 1995, Organization of organelles and membrane traffic by microtubules, Curr Opin Cell Biol, 7, 55, 10.1016/0955-0674(95)80045-X · DOI
- Cubitt, 1995, Understanding, improving and using green fluorescent proteins, Trends Biochem Sci, 20, 448, 10.1016/S0968-0004(00)89099-4 · DOI
- Erdmann, 1994, The peroxisomal targeting signal of 3-oxoacyl-CoA thiolase from Saccharomyces cerevisiae., Yeast, 10, 935, 10.1002/yea.320100708 · DOI
- Faber, 1994, The methylotrophic yeast Hansenula polymorphacontains an inducible import pathway for peroxisomal matrix proteins with an N-terminal targeting signal (PTS2 proteins), Proc Natl Acad Sci USA, 91, 12985, 10.1073/pnas.91.26.12985 · DOI
- Freed, 1970, The association of a class of saltatory movements with microtubules in cultured cells, J Cell Biol, 45, 334, 10.1083/jcb.45.2.334 · DOI
- Gietl, 1990, Glyoxysomal malate dehydrogenase from watermelon is synthesized with an amino-terminal transit peptide, Proc Natl Acad Sci USA, 87, 5773, 10.1073/pnas.87.15.5773 · DOI
- Glover, 1994, Mutagenesis of the amino targeting signal of Saccharomyces cerevisiae3-ketoacyl-CoA thiolase reveals conserved amino acids required for import into peroxisomes in vivo, J Biol Chem, 269, 7558, 10.1016/S0021-9258(17)37323-4 · DOI
- Gould, 1989, A conserved tripeptide sorts proteins to peroxisomes, J Cell Biol, 108, 1657, 10.1083/jcb.108.5.1657 · DOI
- Heuser, 1989, Mechanisms behind the organization of membranous organelles in cells, Curr Opin Cell Biol, 1, 98, 10.1016/S0955-0674(89)80044-4 · DOI
- Ho, 1989, Reclustering of scattered Golgi elements occurs along microtubules, Eur J Cell Biol, 48, 250
- Hollenbeck, 1990, Radial extension of macrophage tubular lysosomes supported by kinesin, Nature (Lond), 346, 864, 10.1038/346864a0 · DOI
- Kamijo, 1990, The 70kDa peroxisomal membrane protein is a member of the Mdr (P-glycoprotein)-related ATP-binding protein superfamily, J Biol Chem, 265, 4534, 10.1016/S0021-9258(19)39595-X · DOI · Paper page
- Keller, 1987, Firefly luciferase is targeted to peroxisomes in mammalian cells, Proc Natl Acad Sci USA, 84, 3264, 10.1073/pnas.84.10.3264 · DOI
- Keller, 1991, Evolutionary conservation of a microbody targeting signal that targets proteins to peroxisomes, glyoxysomes, and glycosomes, J Cell Biol, 114, 893, 10.1083/jcb.114.5.893 · DOI
- Kelly, 1990, Microtubules, membrane traffic, and cell organization, Cell, 61, 5, 10.1016/0092-8674(90)90206-T · DOI
- Lazarow, 1985, Biogenesis of peroxisomes, Annu Rev Cell Biol, 1, 489, 10.1146/annurev.cb.01.110185.002421 · DOI
- McDonald, 1990, The kinesin-like ncd protein of Drosophilais a minus end-directed microtubule motor, Cell, 63, 1159, 10.1016/0092-8674(90)90412-8 · DOI
- McNew, 1996, The targeting and assembly of peroxisomal proteins: some old rules do not apply, Trends Biochem Sci, 21, 54, 10.1016/S0968-0004(96)80181-2 · DOI
- Monosov, 1996, Labeling of peroxisomes with green fluorescent protein in living Pichia pastoriscells, J Histochem Cytochem, 44, 581, 10.1177/44.6.8666743 · DOI · Paper page
- Morris, 1995, Axonal transport of mitochondria along microtubules and F-actin in living vertebrate neurons, J Cell Biol, 131, 1315, 10.1083/jcb.131.5.1315 · DOI
- Osumi, 1991, Amino-terminal presequence of the precursor of peroxisomal 3-ketoacyl-CoA thiolase is a cleavable signal peptide for peroxisomal targeting, Biochem Biophys Res Commun, 181, 947, 10.1016/0006-291X(91)92028-I · DOI
- Rapp, 1996, Microtubule-based peroxisome movement, J Cell Sci, 109, 837, 10.1242/jcs.109.4.837 · DOI
- Rickard, 1996, CLIPs for organelle-microtubule interactions, Trends Cell Biol, 6, 1278, 10.1016/0962-8924(96)10017-9 · DOI
- Rizzuto, 1995, Chimeric green fluorescent protein as a tool for visualizing subcellular organelles in living cells, Curr Biol, 5, 635, 10.1016/S0960-9822(95)00128-X · DOI
- Schrader, 1996, Interaction of microtubules with peroxisomes. Tubular and spherical peroxisomes in HepG2 cells and their alterations induced by microtubule-active drugs, Eur J Cell Biol, 69, 24
- Simon, 1995, Actin-dependent mitochondrial motility in mitotic yeast and cell-free systems: identification of a motor activity on the mitochondrial surface, J Cell Biol, 130, 345, 10.1083/jcb.130.2.345 · DOI
- Soto, 1993, Serial section electron tomography: a method for three-dimensional reconstruction of large structures, Neuroimage, 1, 230, 10.1006/nimg.1994.1008 · DOI
- Subramani, 1993, Protein import into peroxisomes and biogenesis of the organelle, Annu Rev Cell Biol, 9, 445, 10.1146/annurev.cb.09.110193.002305 · DOI
- Swinkels, 1991, A novel, cleavable peroxisomal targeting signal at the amino-terminus of the rat 3-ketoacyl-CoA thiolase, EMBO (Eur Mol Biol Organ) J, 10, 3255, 10.1002/j.1460-2075.1991.tb04889.x · DOI
- Terasaki, 1986, Microtubules and the endoplasmic reticulum are highly interdependent structures, J Cell Biol, 103, 1557, 10.1083/jcb.103.4.1557 · DOI
- Thaler, 1996, Microtubules and microtubule motors: mechanisms of regulation, Int Rev Cytol, 164, 269, 10.1016/S0074-7696(08)62388-8 · DOI
- van den Bosch, 1992, Biochemistry of peroxisomes, Annu Rev Biochem, 61, 157, 10.1146/annurev.bi.61.070192.001105 · DOI
- Wang, 1978, Functions of cytoplasmic fibers in intracellular movements in BHK-21 cells, J Cell Biol, 79, 708, 10.1083/jcb.79.3.708 · DOI
- Warren, 1996, Organelle inheritance, Cell, 84, 395, 10.1016/S0092-8674(00)81284-2 · DOI
- Weisman, 1990, Mutants of Saccharomyces cerevisiaethat block intervacuole vesicular traffic and vacuole division and segregation, Proc Natl Acad Sci USA, 87, 1076, 10.1073/pnas.87.3.1076 · DOI
- Wiemer, 1996, Isolation and characterization of Pas2p, a peroxisomal membrane protein essential for peroxisome biogenesis in the methylotrophic yeast Pichia pastoris., J Biol Chem, 271, 18973, 10.1074/jbc.271.31.18973 · DOI
- Yamamoto, 1987, Biogenesis of peroxisomes in regenerating rat liver. I. Sequential changes of catalase and urate oxidase detected by ultrastructural cytochemistry, Eur J Cell Biol, 43, 293
Cited by
Sorted by citations
Guidelines for the use and interpretation of assays for monitoring autophagy (3rd edition).
Klionsky, D. J., Abdelmohsen, K., Abe, A., Abedin, M. J., Abeliovich, H., Acevedo Arozena, A., Adachi, H., Adams, C. M., Adams, P. D., Adeli, K., et al. (2016) · Autophagy · doi:10.1080/15548627.2015.1100356 · Cited by 5,894
Guidelines for the use and interpretation of assays for monitoring autophagy
Klionsky, D. J., Abdalla, F. C., Abeliovich, H., Abraham, R. T., Acevedo-Arozena, A., Adeli, K., Agholme, L., Agnello, M., Agostinis, P., Aguirre-Ghiso, J. A., et al. (2012) · Autophagy · doi:10.4161/auto.19496 · Cited by 3,996
Guidelines for the use and interpretation of assays for monitoring autophagy (4th edition) 1
Klionsky, D. J., Abdel-Aziz, A. K., Abdelfatah, S., Abdellatif, M., Abdoli, A., Abel, S., Abeliovich, H., Abildgaard, M. H., Abudu, Y. P., Acevedo-Arozena, A., et al. (2021) · Autophagy · doi:10.1080/15548627.2020.1797280 · Cited by 2,897
Koch, J., Pranjic, K., Huber, A., Ellinger, A., Hartig, A., Kragler, F., & Brocard, C. (2010) · Journal of Cell Science · doi:10.1242/jcs.064907 · Cited by 163
Intracellular redistribution of neuronal peroxisomes in response to ACBD5 expression
Wang, Y., Metz, J., Costello, J. L., Passmore, J., Schrader, M., Schultz, C., & Islinger, M. (2018) · PLOS ONE · doi:10.1371/journal.pone.0209507 · Cited by 24
Metadata
- Authors
- Wiemer, E. A. C., Wenzel, T., Deerinck, T. J., Ellisman, M. H., & Subramani, S.
- Affiliations
- *Department of Biology, University of California at San Diego, La Jolla, California 92093-0322; and ‡National Center for Microscopy and Imaging Research, Department of Neurosciences, University of California at San Diego, La Jolla, California 92093-0608
- Venue
- The Journal of Cell Biology
- Publisher
- Rockefeller University Press
- Published
- 1997-01-13
- Volume
- 136
- Issue
- 1
- Pages
- 71-80
- ISSN
- 0021-9525
- 1540-8140
- PMC
- PMC2132450
- Cited by
- 156
- References
- 1
- Language
- en
About these checks
Registry, retraction, Cites and statistics results are computed, not judged, with one exception: a printed reference that no index lists is read once by a model before it counts as a citation error. Claims are extracted by a model and kept only when their quote appears verbatim in the text; each cited source is then checked, with a model’s help, for whether it says what the claim relies on. Those verdicts can be wrong — read the claim’s quote and the cited source before relying on one.
Statistics and arithmetic are recomputed, not judged.
Confidence bands are shown only for fields calibrated on our annotated test set. None is calibrated yet, so no band is shown.
What counts as a claim ›How we measure confidence ›How we check this ›
Are you an author, or do you see a problem with this page? Request a review
