

The DOI matches its Crossref record; 62 of the 63 references it cites were found in a registry or an index.
Telomere Length Dynamics and Chromosomal Instability in Cells Derived from Telomerase Null Mice
Open accessAbstract
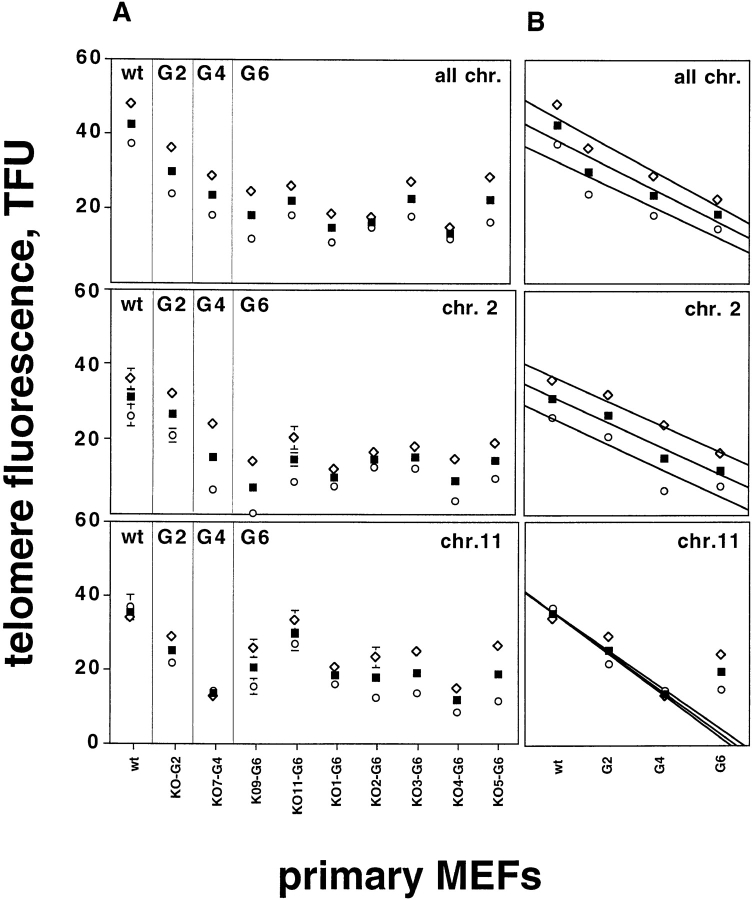
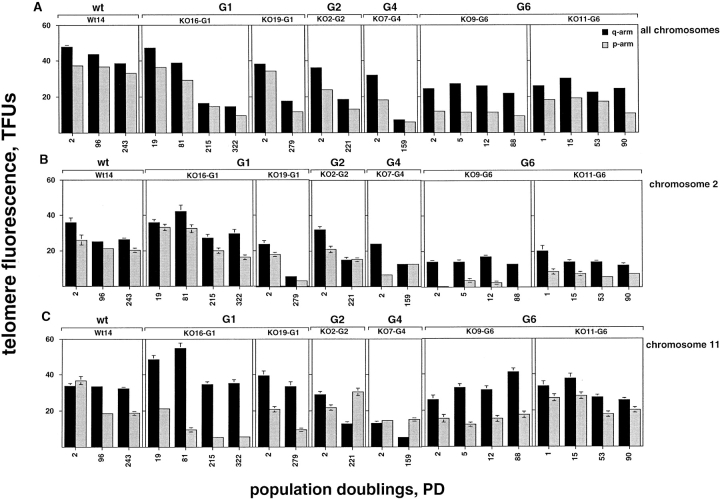
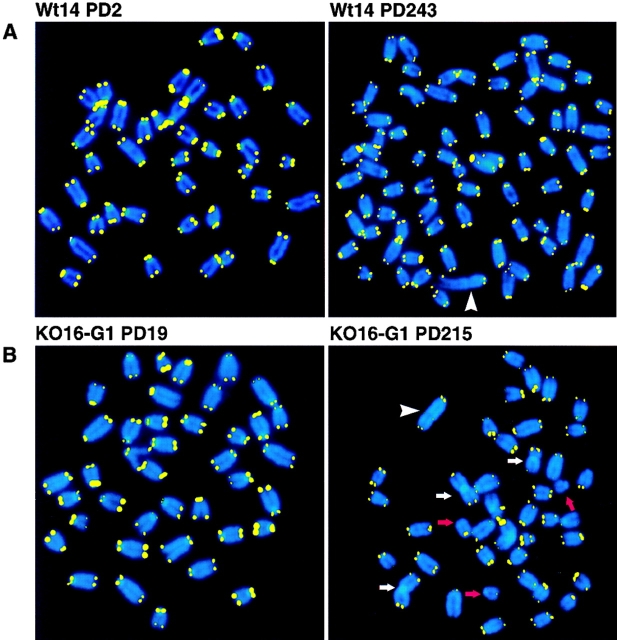
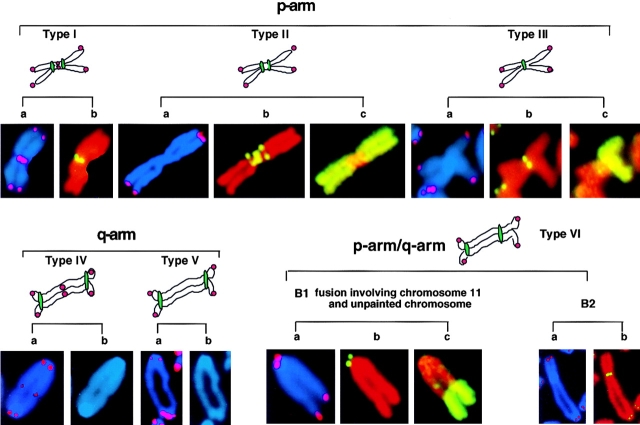
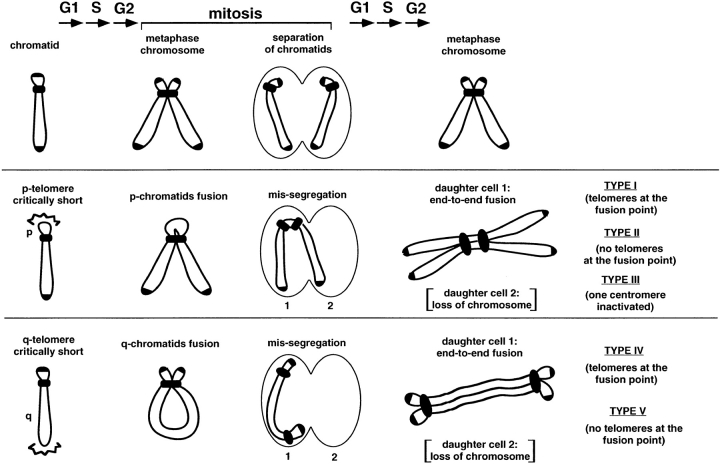
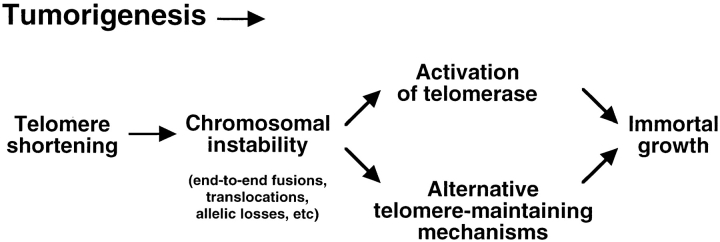
To study the effect of continued telomere shortening on chromosome stability, we have analyzed the telomere length of two individual chromosomes (chromosomes 2 and 11) in fibroblasts derived from wild-type mice and from mice lacking the mouse telomerase RNA (mTER) gene using quantitative fluorescence in situ hybridization. Telomere length at both chromosomes decreased with increasing generations of mTER−/− mice. At the 6th mouse generation, this telomere shortening resulted in significantly shorter chromosome 2 telomeres than the average telomere length of all chromosomes. Interestingly, the most frequent fusions found in mTER−/− cells were homologous fusions involving chromosome 2. Immortal cultures derived from the primary mTER−/− cells showed a dramatic accumulation of fusions and translocations, revealing that continued growth in the absence of telomerase is a potent inducer of chromosomal instability. Chromosomes 2 and 11 were frequently involved in these abnormalities suggesting that, in the absence of telomerase, chromosomal instability is determined in part by chromosome-specific telomere length. At various points during the growth of the immortal mTER−/− cells, telomere length was stabilized in a chromosome-specific man-ner. This telomere-maintenance in the absence of telomerase could provide the basis for the ability of mTER−/− cells to grow indefinitely and form tumors.
Overview
The claims and statistics of this paper haven’t been checked yet.
Run the check — free, no account needed. It reads the open-access text and checks the sources it cites.
Integrity signals
Registry
Cites
Statistics
Figures
Verification
Claims the paper makes
The claims and statistics of this paper haven’t been checked yet.
Run the check — free, no account needed. It reads the open-access text and checks the sources it cites.
Claims other papers make about this one
Each is checked against this paper’s own text: does it say what the citing paper says it does?
In the citing paper
“In the G5-G6 TERCÀ/À tissues, there was clear cytogenetic evidence of progressive telomere erosion including 'signal-free' ends, chromosomal end-to-end fusions and anaphase bridging at mitosis (60)(61)(62).”
From Telomeres and telomerase in cancer (2010) · cites this paper as [61]
In the citing paper
“G5-G6 TERC mice became infertile, showed high rates of apoptosis in testis and germ cell depletion, exhibited impaired bone marrow function and diminished proliferation of lymphocytes (61).”
From Telomeres and telomerase in cancer (2010) · cites this paper as [61]
In the citing paper
“Indeed, continued breeding of first generation (G1) TERCÀ/À mice to yield successive generations of TERCÀ/À mice resulted in progressive loss of telomere reserves and ultimately provoked severe degeneration of highly proliferative tissues.”
From Telomeres and telomerase in cancer (2010) · cites this paper as [61]
Self-check
Percentages, sums and reported differences re-computed from the paper’s own numbers.
The self-check needs the paper’s full text.
Citations
Cites
Telomeres shorten during ageing of human fibroblasts
Harley, C. B., Futcher, A. B., & Greider, C. W. (1990) · Nature · doi:10.1038/345458a0 · Cited by 5,750 · cited 1×
“Indeed, telomere shortening to a critical length has been proposed to limit the life span of somatic cells in humans (Harley et al., 1990; Counter et al., 1992).”
BackgroundExtension of Life-Span by Introduction of Telomerase into Normal Human Cells
Bodnar, A. G., Ouellette, M., Frolkis, M., Holt, S. E., Chiu, C.-P., Morin, G. B., Harley, C. B., Shay, J. W., Lichtsteiner, S., & Wright, W. E. (1998) · Science · doi:10.1126/science.279.5349.349 · Cited by 4,975 · cited 2×
“It has been recently shown that the introduction of the telomerase catalytic subunit in primary human cells is sufficient to restore enzymatic activity, to elongate and maintain telomeres, and, in some cell types, to sustain immortal growth ( Bodnar et al., 1998; Wang et al., 1998; Kiyono et al., 1998).”
Structure and function of telomeres
Blackburn, E. H. (1991) · Nature · doi:10.1038/350569a0 · Cited by 3,596
Identification of a specific telomere terminal transferase activity in tetrahymena extracts
Greider, C. W., & Blackburn, E. H. (1985) · Cell · doi:10.1016/0092-8674(85)90170-9 · Cited by 3,400 · cited 1×
“In such cells the enzyme telomerase seems to be the main mechanism for the maintenance of telomere length (Greider and Blackburn, 1985; Morin, 1989; Yu et al., 1990; Singer and Gottschling, 1994; McEachern and Blackburn, 1996; Nakamura et al., 1997).”
BackgroundA survey of telomerase activity in human cancer
Shay, J. W., & Bacchetti, S. (1997) · European Journal of Cancer · doi:10.1016/s0959-8049(97)00062-2 · Cited by 2,794 · cited 1×
“These mechanisms, which can be either telomerase dependent (reviewed in Shay and Bacchetti, 1997 ) or independent (this paper and Bryan et al., 1995, 1997), can prevent telomeres from further shortening, allowing the immortal growth of cells that have critically short telomeres and a high degree of genetic instability.”
BackgroundTodaro, G. J., & Green, H. (1963) · The Journal of Cell Biology · doi:10.1083/jcb.17.2.299 · Cited by 2,747 · cited 1×
“col (Todaro and Green, 1963) in dishes of 10 cm diam, seeding 10 6 cells ev-”
Telomerase Catalytic Subunit Homologs from Fission Yeast and Human
Nakamura, T. M., Morin, G. B., Chapman, K. B., Weinrich, S. L., Andrews, W. H., Lingner, J., Harley, C. B., & Cech, T. R. (1997) · Science · doi:10.1126/science.277.5328.955 · Cited by 2,256
The RNA Component of Human Telomerase
Feng, J., Funk, W. D., Wang, S.-S., Weinrich, S. L., Avilion, A. A., Chiu, C.-P., Adams, R. R., Chang, E., Allsopp, R. C., Yu, J., et al. (1995) · Science · doi:10.1126/science.7544491 · Cited by 2,227 · cited 2×
“, 1998), an RNA molecule that contains the template for the synthesis of telomeric repeats (Greider and Blackburn, 1989; Singer and Gottschling, 1994; Blasco et al., 1995; Feng et al., 1995; McEachern and Blackburn, 1995), and other associated proteins (Collins et al.”
Telomere Shortening and Tumor Formation by Mouse Cells Lacking Telomerase RNA
Blasco, M. A., Lee, H.-W., Hande, M. P., Samper, E., Lansdorp, P. M., DePinho, R. A., & Greider, C. W. (1997) · Cell · doi:10.1016/s0092-8674(01)80006-4 · Cited by 2,108 · cited 15×
“The details are explained elsewhere (Blasco et al., 1997).”
InfluentialSelf-citationCounter, C. M., Avilion, A. A., LeFeuvre, C. E., Stewart, N. G., Greider, C. W., Harley, C. B., & Bacchetti, S. (1992) · The EMBO Journal · doi:10.1002/j.1460-2075.1992.tb05245.x · Cited by 2,096 · cited 1×
“Indeed, telomere shortening to a critical length has been proposed to limit the life span of somatic cells in humans (Harley et al., 1990; Counter et al., 1992).”
Background
Cited by
Sorted by citations
Longevity, Stress Response, and Cancer in Aging Telomerase-Deficient Mice
Rudolph, K. L., Chang, S., Lee, H.-W., Blasco, M., Gottlieb, G. J., Greider, C., & DePinho, R. A. (1999) · Cell · doi:10.1016/s0092-8674(00)80580-2 · Cited by 1,349
“Here we find that ditions (Hande et al., 1999). the ability of the mTR2/2 mice to respond to various physiological stresses is compromised and declines Progressive Increase in the Rate of Spontaneous with increasing age of the mouse.”
BackgroundSelf-citationHemann, M. T., Strong, M. A., Hao, L.-Y., & Greider, C. W. (2001) · Cell · doi:10.1016/s0092-8674(01)00504-9 · Cited by 1,219
“) mTRϪ/Ϫ mice (Table 1) (Blasco et al., 1997; Hemann et al., 2001b; Lee et al., 1998).”
Aubert, G., & Lansdorp, P. M. (2008) · Physiological Reviews · doi:10.1152/physrev.00026.2007 · Cited by 1,188
“The technique is well established to study telomere biology in many settings (8, 81).”
BackgroundMethodSelf-citationOxygen sensitivity severely limits the replicative lifespan of murine fibroblasts
Parrinello, S., Samper, E., Krtolica, A., Goldstein, J., Melov, S., & Campisi, J. (2003) · Nature Cell Biology · doi:10.1038/ncb1024 · Cited by 1,116
“In addition, our finding that mTR −/− MEFs do not senesce in 3% oxygen, in contrast to telomerase-negative human cells, is most probably caused by the ability of mouse chromosomes to stabilize telomeres in the absence of telomerase until alternative telomere maintenance pathways are induce”
BackgroundSelf-citationInhibition of telomerase limits the growth of human cancer cells
Hahn, W. C., Stewart, S. A., Brooks, M. W., York, S. G., Eaton, E. N., Kurachi, A. L., Beijersbergen, R. L., Knoll, J. H. M., Meyerson, M. M., & Weinberg, R. A. (1999) · Nature Medicine · doi:10.1038/13495 · Cited by 1,038
Metadata
- Authors
- Hande, M. P., Samper, E., Lansdorp, P., & Blasco, M. A.
- Affiliations
- University of British Columbia (CA)
- *Department of Immunology and Oncology, Centro Nacional de Biotecnología/CSIC, Campus Cantoblanco, Madrid E-28049, Spain; ‡Terry Fox Laboratory, British Columbia Cancer Research Center, Vancouver, British Columbia V5Z 1L3, Canada; and §Department of Medicine, University of British Columbia, Vancouver, British Columbia V6T 2B5, Canada
- Venue
- The Journal of Cell Biology
- Publisher
- Rockefeller University Press
- Published
- 1999-02-22
- Volume
- 144
- Issue
- 4
- Pages
- 589-601
- ISSN
- 0021-9525 (ISSN-L)
- 1540-8140
- PMC
- PMC2132934
- OpenAlex
- W2110286112
- Cited by
- 313
- References
- 63
- Citations by year
- 2026: 1 · 2024: 5 · 2023: 1 · 2020: 1 · 2019: 6 · 2018: 7 · 2017: 5 · 2016: 10 · 2015: 8 · 2014: 8 · 2013: 10 · 2012: 7
- FWCI
- 16.53
- Type
- journal article
- Language
- en
- Open access
- green
- www.ncbi.nlm.nih.gov
- Licence
- cc-by-nc-sa
- Locations
- The Journal of Cell Biology (publishedVersion)
- PubMed Central (publishedVersion, cc-by-nc-sa)
- PubMed (publishedVersion)
- Funders
- National Institutes of Health (1r01gm056162-01)
- National Cancer Institute (P01CA013106)
- National Institute of General Medical Sciences (GM56162)
- National Institute of Allergy and Infectious Diseases (R01AI029524)
- Topics
- Life Sciences › Biochemistry, Genetics and Molecular Biology › Cell Biology › Telomeres, Telomerase, and Senescence
- Life Sciences › Biochemistry, Genetics and Molecular Biology › Aging › Genetics, Aging, and Longevity in Model Organisms
- Life Sciences › Biochemistry, Genetics and Molecular Biology › Genetics › Chromosomal and Genetic Variations
- Keywords
- telomere length, chromosomal instability, telomerase RNA, telomere shortening, chromosome 2, chromosome 11, translocation, cell immortalization, fibroblasts, tumor formation, telomere maintenance
- MeSH terms
- Animals, Cell Transformation, Neoplastic, Cells, Cultured, Chromosome Aberrations, Models, Genetic, Neoplasms, Experimental, Telomere, In Situ Hybridization, Fluorescence, Mice, Knockout, Telomerase, Mice
About these checks
Registry, retraction, Cites and statistics results are computed, not judged, with one exception: a printed reference that no index lists is read once by a model before it counts as a citation error. Claims are extracted by a model and kept only when their quote appears verbatim in the text; each cited source is then checked, with a model’s help, for whether it says what the claim relies on. Those verdicts can be wrong — read the claim’s quote and the cited source before relying on one.
Statistics and arithmetic are recomputed, not judged.
Confidence bands are shown only for fields calibrated on our annotated test set. None is calibrated yet, so no band is shown.
What counts as a claim ›How we measure confidence ›How we check this ›
Are you an author, or do you see a problem with this page? Request a review
