Cited by 127

The DOI matches its Crossref record; 1 of the 1 references it cites were found in a registry or an index.

Functional binding interaction identified between the axonal CAM L1 and members of the ERM family

Dickson, Tracey C., Mintz, C. David, Benson, Deanna L., Salton, Stephen R.J.·2002·The Journal of Cell Biology

Abstract

Ayeast two-hybrid library was screened using the cytoplasmic domain of the axonal cell adhesion molecule L1 to identify binding partners that may be involved in the regulation of L1 function. The intracellular domain of L1 bound to ezrin, a member of the ezrin, radixin, and moesin (ERM) family of membrane–cytoskeleton linking proteins, at a site overlapping that for AP2, a clathrin adaptor. Binding of bacterial fusion proteins confirmed this interaction. To determine whether ERM proteins interact with L1 in vivo, extracellular antibodies to L1 were used to force cluster the protein on cultured hippocampal neurons and PC12 cells, which were then immunolabeled for ERM proteins. Confocal analysis revealed a precise pattern of codistribution between ERMs and L1 clusters in axons and PC12 neurites, whereas ERMs in dendrites and spectrin labeling remained evenly distributed. Transfection of hippocampal neurons grown on an L1 substrate with a dominant negative ERM construct resulted in extensive and abnormal elaboration of membrane protrusions and an increase in axon branching, highlighting the importance of the ERM–actin interaction in axon development. Together, our data indicate that L1 binds directly to members of the ERM family and suggest this association may coordinate aspects of axonal morphogenesis.

Overview

The claims and statistics of this paper haven’t been checked yet.

Run the check — free, no account needed. It reads the open-access text and checks the sources it cites.

A few free checks a day · papers already verified open instantly · results are public

Integrity signals

Registry

Crossref · 10.1083/jcb.200111076

Cites

1 of 1 references verified0 citation errors · 0 not checkable

Statistics

Figures

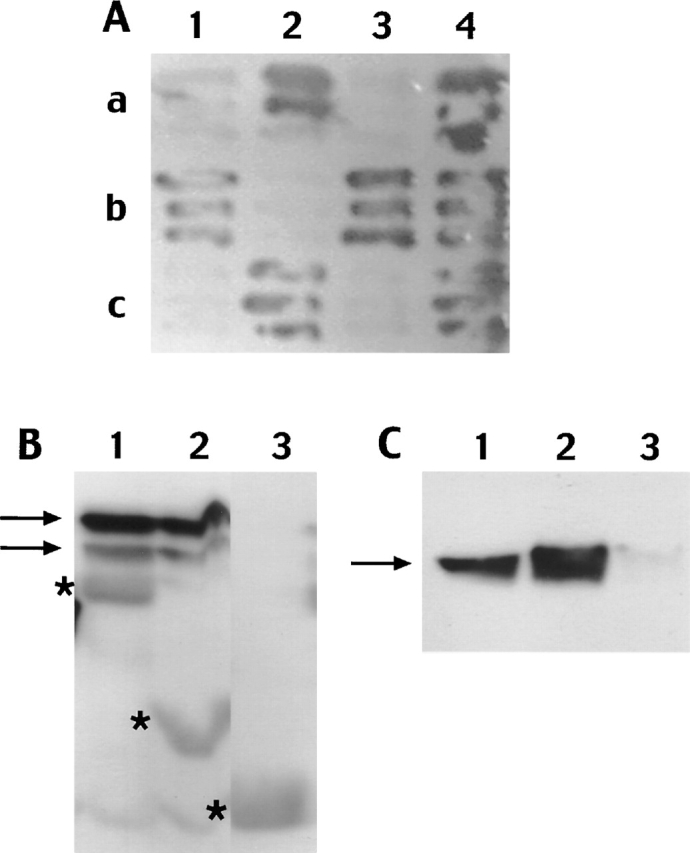
Figure 1. The L1 cytoplasmic domain showed strong specific interactions with rat AP2 and the membrane–cytoskeleton linker proteins ankyrinB and ezrin. (A) An example of the yeast two-hybrid cotransformation assays shows ezrin (a) and AP2 (c) reacting with both truncated L1 (2) (L1 COOH terminus truncated at amino acid 1,182, E of the RSLE motif) and the full-length L1 COOH terminus (4) (with RSLE). However, ezrin did not interact with L1ΔY (1) (L1 COOH terminus with tyrosine adjacent to RSLE motif mutated to phenylalanine) or L1-RSLE (3) (L1 COOH terminus lacking RSLE), whereas ankyrin (b) interacted with both of these constructs. (B) Bacterial fusion proteins containing the L1 COOH termini bind to ezrin. GST-L1 (1) and GST-L1–truncated (2) bind ezrin (arrows), whereas GST alone (3) does not. Asterisks denote position of GST fusion proteins. (C) The GST-L1 (1) and GST-L1–truncated (2) fusion proteins were also both found to bind AP2 (arrow), whereas GST alone (3) does not.
Figure 1. The L1 cytoplasmic domain showed strong specific interactions with rat AP2 and the membrane–cytoskeleton linker proteins ankyrinB and ezrin. (A) An example of the yeast two-hybrid cotransformation assays shows ezrin (a) and AP2 (c) reacting with both truncated L1 (2) (L1 COOH terminus truncated at amino acid 1,182, E of the RSLE motif) and the full-length L1 COOH terminus (4) (with RSLE). However, ezrin did not interact with L1ΔY (1) (L1 COOH terminus with tyrosine adjacent to RSLE motif mutated to phenylalanine) or L1-RSLE (3) (L1 COOH terminus lacking RSLE), whereas ankyrin (b) interacted with both of these constructs. (B) Bacterial fusion proteins containing the L1 COOH termini bind to ezrin. GST-L1 (1) and GST-L1–truncated (2) bind ezrin (arrows), whereas GST alone (3) does not. Asterisks denote position of GST fusion proteins. (C) The GST-L1 (1) and GST-L1–truncated (2) fusion proteins were also both found to bind AP2 (arrow), whereas GST alone (3) does not.CC BY-NC-SA · PubMed Central
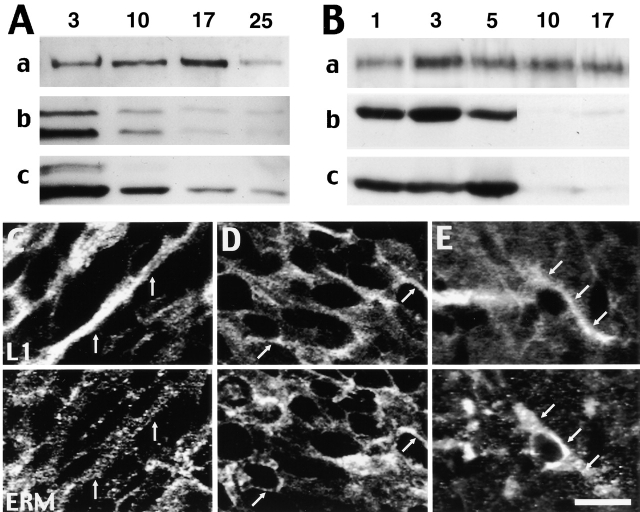
Figure 2. Immunoblots indicate that ezrin and moesin expression levels are highest in young neurons and drop off dramatically after the first week of growth. (A) In hippocampal neurons, levels of L1 (a) were highest at 3, 10, and 17 d growth. Levels of ezrin (b) and moesin (c) were highest at 3 d and decreased considerably after 10 d of growth. Ezrin and moesin levels decrease with long term NGF treatment of PC12 cells. (B) Ezrin (b) and moesin (c) levels of expression were greatest after 3 and 5 d, respectively, of differentiation and decreased dramatically after 10 d, whereas L1 levels gradually increased with NGF treatment. ERM proteins and L1 are codistributed in vivo. Arrows indicate examples of codistribution between L1 (top) and the ERM proteins (bottom) within the internal capsule (C), the temporal cortex (D), and the CA3 region of the hippocampus (E). Both labels were concentrated in the cortical edges of cell bodies; however, labeling was also evident within cell processes. Bar: (C and D) 13 μm; (E) 17 μm.
Figure 2. Immunoblots indicate that ezrin and moesin expression levels are highest in young neurons and drop off dramatically after the first week of growth. (A) In hippocampal neurons, levels of L1 (a) were highest at 3, 10, and 17 d growth. Levels of ezrin (b) and moesin (c) were highest at 3 d and decreased considerably after 10 d of growth. Ezrin and moesin levels decrease with long term NGF treatment of PC12 cells. (B) Ezrin (b) and moesin (c) levels of expression were greatest after 3 and 5 d, respectively, of differentiation and decreased dramatically after 10 d, whereas L1 levels gradually increased with NGF treatment. ERM proteins and L1 are codistributed in vivo. Arrows indicate examples of codistribution between L1 (top) and the ERM proteins (bottom) within the internal capsule (C), the temporal cortex (D), and the CA3 region of the hippocampus (E). Both labels were concentrated in the cortical edges of cell bodies; however, labeling was also evident within cell processes. Bar: (C and D) 13 μm; (E) 17 μm.CC BY-NC-SA · PubMed Central
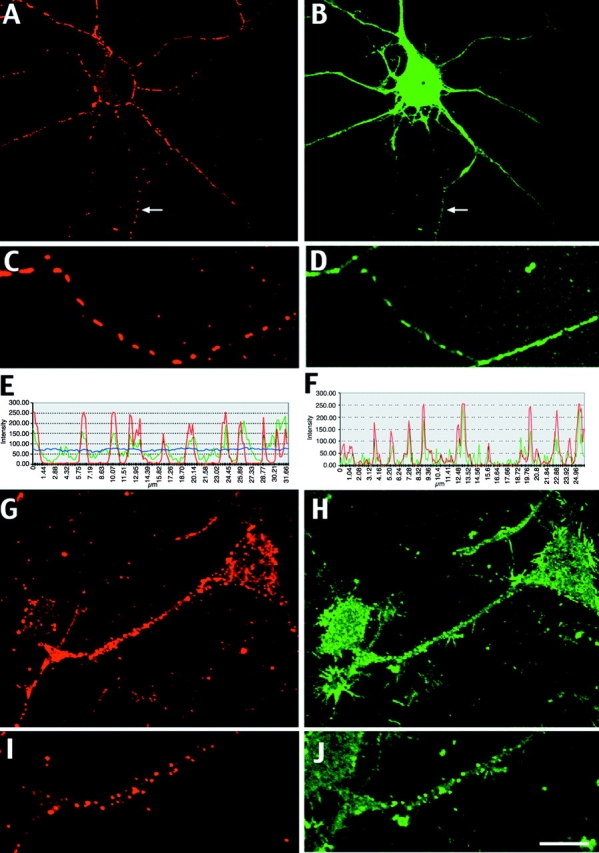
Figure 3. L1 strongly interacts with ERM proteins in vivo. (A and C) After forced L1 clustering, labeling exists as distinct patches along the axons (arrows). (Note that an axon from a neighboring cell can be seen wrapped around the cell soma and dendrites, a common phenomena in hippocampal cultures). (B and D) Clustering is also evident within axons labeled for the ERM proteins. ERM labeling within dendrites remained smooth. Fluorescence intensity profiles taken along axons in which L1 had been forced to cluster (E) confirmed these observations. Red, green, and blue lines represent L1, ERM, and DIC labeling profiles, respectively. Similarly, forced L1 clustering (G and I) in differentiated PC12 cells resulted in clustering of ERM labeling (H and J). Quantification of labeling along neurites confirmed these observation (F). Bar: (A and B) 16 μm; (C and D) 11 μm; (G and H) 12 μm; (I and J) 8 μm.
Figure 3. L1 strongly interacts with ERM proteins in vivo. (A and C) After forced L1 clustering, labeling exists as distinct patches along the axons (arrows). (Note that an axon from a neighboring cell can be seen wrapped around the cell soma and dendrites, a common phenomena in hippocampal cultures). (B and D) Clustering is also evident within axons labeled for the ERM proteins. ERM labeling within dendrites remained smooth. Fluorescence intensity profiles taken along axons in which L1 had been forced to cluster (E) confirmed these observations. Red, green, and blue lines represent L1, ERM, and DIC labeling profiles, respectively. Similarly, forced L1 clustering (G and I) in differentiated PC12 cells resulted in clustering of ERM labeling (H and J). Quantification of labeling along neurites confirmed these observation (F). Bar: (A and B) 16 μm; (C and D) 11 μm; (G and H) 12 μm; (I and J) 8 μm.CC BY-NC-SA · PubMed Central
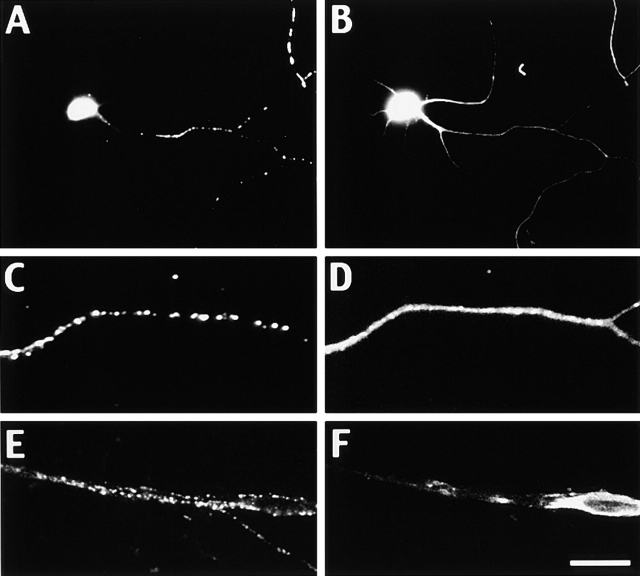
Figure 4. The L1–ERM interaction is specific. Forced clustering of L1 in hippocampal neurons (A and C) had no effect on the labeling pattern of spectrin, which remained smooth throughout the axon and dendrites (B and D). Clustering of L1-RSLE in Schwann cells (E) had no effect on ERM protein labeling (F). Bar: (A and B) 25 μm; (C and D) 5 μm; (E and F) 18 μm.
Figure 4. The L1–ERM interaction is specific. Forced clustering of L1 in hippocampal neurons (A and C) had no effect on the labeling pattern of spectrin, which remained smooth throughout the axon and dendrites (B and D). Clustering of L1-RSLE in Schwann cells (E) had no effect on ERM protein labeling (F). Bar: (A and B) 25 μm; (C and D) 5 μm; (E and F) 18 μm.CC BY-NC-SA · PubMed Central
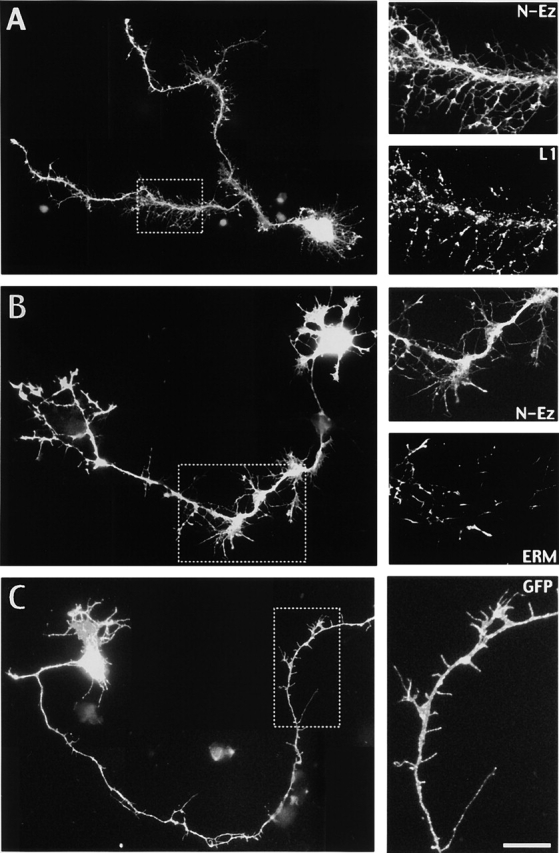
Figure 5. Expression of ezrin NH2 terminus dominant negative causes abnormal morphogenesis. (A) Transfection of neurons grown on an L1 substrate with a construct encoding the NH2 terminus of ezrin fused to GFP resulted in increased axonal branching and the growth of abnormal numbers of long branchlets and filopodia-like protrusions. High power insets of boxed region show localization of L1 throughout N-Ez–GFP protrusions. (B) Transfection of neurons cultured on laminin had no significant effect on branching; however, similar filopodia-like protrusions were noted. High power images of boxed regions show localization of endogenous ERM proteins concentrated at the tips of N-Ez–GFP protrusions. (C) Transfection of hippocampal neurons cultured on an L1 substrate with the pEGFP-F' vector (no insert) indicates normal growth at DIV 3. Inset shows high power image of normal axonal growth. Bar: (A) 30 μm; (A, insets) 11 μm; (B) 24 μm; (B, insets) 17 μm; (C) 24 μm; (C, inset) 10 μm.
Figure 5. Expression of ezrin NH2 terminus dominant negative causes abnormal morphogenesis. (A) Transfection of neurons grown on an L1 substrate with a construct encoding the NH2 terminus of ezrin fused to GFP resulted in increased axonal branching and the growth of abnormal numbers of long branchlets and filopodia-like protrusions. High power insets of boxed region show localization of L1 throughout N-Ez–GFP protrusions. (B) Transfection of neurons cultured on laminin had no significant effect on branching; however, similar filopodia-like protrusions were noted. High power images of boxed regions show localization of endogenous ERM proteins concentrated at the tips of N-Ez–GFP protrusions. (C) Transfection of hippocampal neurons cultured on an L1 substrate with the pEGFP-F' vector (no insert) indicates normal growth at DIV 3. Inset shows high power image of normal axonal growth. Bar: (A) 30 μm; (A, insets) 11 μm; (B) 24 μm; (B, insets) 17 μm; (C) 24 μm; (C, inset) 10 μm.CC BY-NC-SA · PubMed Central

Verification

Claims the paper makes

The claims and statistics of this paper haven’t been checked yet.

Run the check — free, no account needed. It reads the open-access text and checks the sources it cites.

A few free checks a day · papers already verified open instantly · results are public

Claims other papers make about this one

Each is checked against this paper’s own text: does it say what the citing paper says it does?

Self-check

Percentages, sums and reported differences re-computed from the paper’s own numbers.

The self-check needs the paper’s full text.

Citations

Cites

Show all 1 references

Research works printed but not linked: 36

  1. 1993, J. Cell Biol., 120, 129, 10.1083/jcb.120.1.129 · DOI
  2. 1999, J. Cell Sci., 112, 111, 10.1242/jcs.112.1.111 · DOI
  3. 1998, J. Neurosci., 18, 6892, 10.1523/JNEUROSCI.18-17-06892.1998 · DOI
  4. 1994, J. Neurocytol., 23, 279, 10.1007/BF01188497 · DOI · Paper page
  5. 1999, Curr. Opin. Cell Biol., 11, 109, 10.1016/S0955-0674(99)80013-1 · DOI
  6. 1997, J. Cell Sci., 110, 3011, 10.1242/jcs.110.24.3011 · DOI
  7. 2001, Curr. Biol., 11, R555, 10.1016/S0960-9822(01)00341-4 · DOI
  8. 1994, Prot. Profile., 1, 951
  9. 1997, J. Cell Biol., 138, 423, 10.1083/jcb.138.2.423 · DOI
  10. 1994, J. Biol. Chem., 269, 27163, 10.1016/S0021-9258(18)46961-X · DOI
  11. 1999, EMBO J., 18, 4744, 10.1093/emboj/18.17.4744 · DOI
  12. 1999, J. Neurosci., 19, 4907, 10.1523/JNEUROSCI.19-12-04907.1999 · DOI
  13. 1997, Neuroscience., 78, 373, 10.1016/S0306-4522(96)00594-5 · DOI
  14. 1989, J. Cell Biol., 109, 1621, 10.1083/jcb.109.4.1621 · DOI
  15. 1998, J. Cell Biol., 141, 929, 10.1083/jcb.141.4.929 · DOI
  16. 1996, Nature, 382, 265, 10.1038/382265a0 · DOI
  17. 1996, Neuron., 17, 587, 10.1016/S0896-6273(00)80192-0 · DOI · Paper page
  18. 1998, J. Cell Biol., 142, 251, 10.1083/jcb.142.1.251 · DOI
  19. 1998, J. Neurosci., 18, 3749, 10.1523/JNEUROSCI.18-10-03749.1998 · DOI
  20. 1998, J. Neurosci., 18, 5311, 10.1523/JNEUROSCI.18-14-05311.1998 · DOI
  21. 1995, J. Cell Biol., 131, 1821, 10.1083/jcb.131.6.1821 · DOI
  22. 1989, Neuron., 2, 1597, 10.1016/0896-6273(89)90048-2 · DOI
  23. 1999, Trends Cell Biol., 9, 187, 10.1016/S0962-8924(99)01544-5 · DOI
  24. 1997, Mol. Biol. Cell., 8, 1543, 10.1091/mbc.8.8.1543 · DOI
  25. 1994, Glia., 10, 70, 10.1002/glia.440100109 · DOI
  26. 1991, FEBS Lett., 289, 91, 10.1016/0014-5793(91)80915-P · DOI
  27. 1996, J. Cell Biol., 132, 475, 10.1083/jcb.132.3.475 · DOI
  28. 1998, J. Cell Biol., 143, 443, 10.1083/jcb.143.2.443 · DOI
  29. 1990, J. Neurocytol., 19, 807, 10.1007/BF01186812 · DOI
  30. 1983, J. Neurosci., 3, 441, 10.1523/JNEUROSCI.03-03-00441.1983 · DOI
  31. 1999, J. Biol. Chem., 274, 37965, 10.1074/jbc.274.53.37965 · DOI
  32. 1996, J. Neurochem., 66, 2338, 10.1046/j.1471-4159.1996.66062338.x · DOI
  33. 1994, J. Cell Biol., 126, 391, 10.1083/jcb.126.2.391 · DOI
  34. 1997, Curr. Opin. Cell Biol., 9, 659, 10.1016/S0955-0674(97)80119-6 · DOI
  35. 1993, J. Comp. Neurol., 332, 237, 10.1002/cne.903320208 · DOI
  36. 2001, Cell Biol. Int., 25, 205, 10.1006/cbir.2000.0635 · DOI

Cited by

Sorted by citations

Metadata

Authors
Dickson, T. C., Mintz, C. D., Benson, D. L., & Salton, S. R. J.
Affiliations
1Fishberg Research Center for Neurobiology, The Mount Sinai School of Medicine, New York, NY 10029
Venue
The Journal of Cell Biology
Published
2002-06-17
Volume
157
Issue
7
Pages
1105-1112
ISSN
  • 1540-8140
  • 0021-9525
Cited by
127
References
1
Language
en

About these checks

Registry, retraction, Cites and statistics results are computed, not judged, with one exception: a printed reference that no index lists is read once by a model before it counts as a citation error. Claims are extracted by a model and kept only when their quote appears verbatim in the text; each cited source is then checked, with a model’s help, for whether it says what the claim relies on. Those verdicts can be wrong — read the claim’s quote and the cited source before relying on one.

Statistics and arithmetic are recomputed, not judged.

Confidence bands are shown only for fields calibrated on our annotated test set. None is calibrated yet, so no band is shown.

What counts as a claim ›How we measure confidence ›How we check this ›

Are you an author, or do you see a problem with this page? Request a review