Cited by 88

The DOI matches its Crossref record.

Regulation of translation is required for dendritic cell function and survival during activation

Lelouard, Hugues, Schmidt, Enrico K., Camosseto, Voahirana, Clavarino, Giovanna, Ceppi, Maurizio, Hsu, Hsiang-Ting, Pierre, Philippe·2007·The Journal of Cell Biology

Abstract

In response to inflammatory stimulation, dendritic cells (DCs) have a remarkable pattern of differentiation (maturation) that exhibits specific mechanisms to control antigen processing and presentation. Here, we show that in response to lipopolysaccharides, protein synthesis is rapidly enhanced in DCs. This enhancement occurs via a PI3K-dependent signaling pathway and is key for DC activation. In addition, we show that later on, in a manner similar to viral or apoptotic stress, DC activation leads to the phosphorylation and proteolysis of important translation initiation factors, thus inhibiting cap-dependent translation. This inhibition correlates with major changes in the origin of the peptides presented by MHC class I and the ability of mature DCs to prevent cell death. Our observations have important implications in linking translation regulation with DC function and survival during the immune response.

Overview

The claims and statistics of this paper haven’t been checked yet.

Run the check — free, no account needed. It reads the open-access text and checks the sources it cites.

A few free checks a day · papers already verified open instantly · results are public

Integrity signals

Registry

Crossref · 10.1083/jcb.200707166

Cites

Statistics

Figures

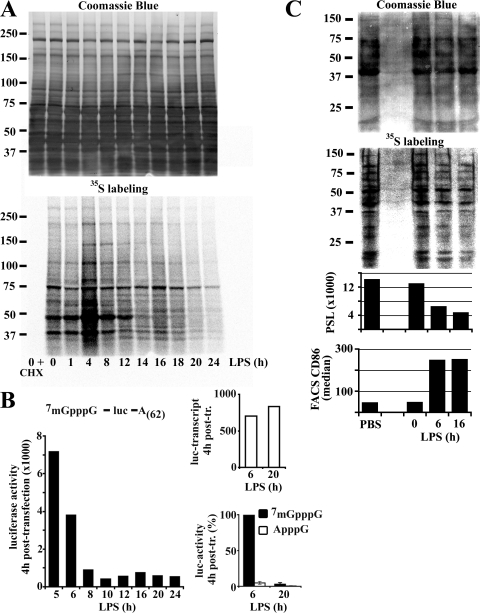
Figure 1. Protein synthesis is regulated during DC maturation. (A) At the indicated time of LPS-induced maturation, DCs were pulsed for 10 min with 35S-labeled Pro-Mix. Soluble fractions were prepared and analyzed by Coomassie blue staining (top) and autoradiography (bottom) after SDS-PAGE. (B) A firefly luciferase reporter mRNA was transfected in DCs. Left: luciferase activity was measured 4 h after transfection at the indicated time of maturation (absolute values of one representative experiment). Bottom right: comparative levels of translation of luciferase mRNAs modified or not with an unmethylated cap-analogue in transfected 6 h and 20 h LPS-treated DCs. Error bars indicate the SD of three independent experiments. Due to variations of absolute values in the different experiments, the time point 6 h of 7mGpppG was defined as 100%. Transfection efficiency was determined by quantitative PCR (top right, absolute values). (C) Spleen DCs, isolated from mice treated with PBS as control or 10 μg LPS i.p. for different times as indicated, were metabolically labeled. After SDS-PAGE, soluble fractions were stained with Coomassie blue (top) and 35S incorporation was visualized by phosphoimaging (bottom) and quantified (PSL = photostimulated luminescence). The maturation status of the DCs is shown by FACS analysis of CD86 (bottom).
Figure 1. Protein synthesis is regulated during DC maturation. (A) At the indicated time of LPS-induced maturation, DCs were pulsed for 10 min with 35S-labeled Pro-Mix. Soluble fractions were prepared and analyzed by Coomassie blue staining (top) and autoradiography (bottom) after SDS-PAGE. (B) A firefly luciferase reporter mRNA was transfected in DCs. Left: luciferase activity was measured 4 h after transfection at the indicated time of maturation (absolute values of one representative experiment). Bottom right: comparative levels of translation of luciferase mRNAs modified or not with an unmethylated cap-analogue in transfected 6 h and 20 h LPS-treated DCs. Error bars indicate the SD of three independent experiments. Due to variations of absolute values in the different experiments, the time point 6 h of 7mGpppG was defined as 100%. Transfection efficiency was determined by quantitative PCR (top right, absolute values). (C) Spleen DCs, isolated from mice treated with PBS as control or 10 μg LPS i.p. for different times as indicated, were metabolically labeled. After SDS-PAGE, soluble fractions were stained with Coomassie blue (top) and 35S incorporation was visualized by phosphoimaging (bottom) and quantified (PSL = photostimulated luminescence). The maturation status of the DCs is shown by FACS analysis of CD86 (bottom).CC BY-NC-SA · PubMed Central
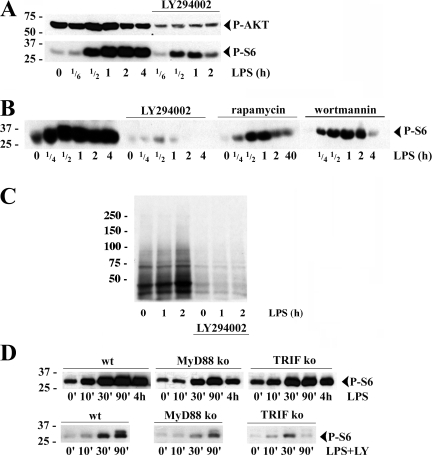
Figure 2. The PI3K/AKT signal transduction pathway is involved in S6 phosphorylation and translational increase during DC activation. (A) Immunoblot of S6 (top) and AKT (bottom) phosphorylation at the onset of DC maturation and its inhibition by LY 294002 (LY). (B) DCs were pretreated with wortmannin, LY, or rapamycin prior stimulation and immunoblotted for phospho-S6 (P-S6). (C) Translation was monitored in DCs by 35S-labeled Pro-Mix during the first 2 h of LPS activation with or without LY treatment. (D) Immunoblot of P-S6 in DCs derived from C57BL6 (WT), MyD88−/−, and TRIF−/− mice and stimulated with LPS for the indicated times, with (bottom) or without (top) pretreatment with LY.
Figure 2. The PI3K/AKT signal transduction pathway is involved in S6 phosphorylation and translational increase during DC activation. (A) Immunoblot of S6 (top) and AKT (bottom) phosphorylation at the onset of DC maturation and its inhibition by LY 294002 (LY). (B) DCs were pretreated with wortmannin, LY, or rapamycin prior stimulation and immunoblotted for phospho-S6 (P-S6). (C) Translation was monitored in DCs by 35S-labeled Pro-Mix during the first 2 h of LPS activation with or without LY treatment. (D) Immunoblot of P-S6 in DCs derived from C57BL6 (WT), MyD88−/−, and TRIF−/− mice and stimulated with LPS for the indicated times, with (bottom) or without (top) pretreatment with LY.CC BY-NC-SA · PubMed Central
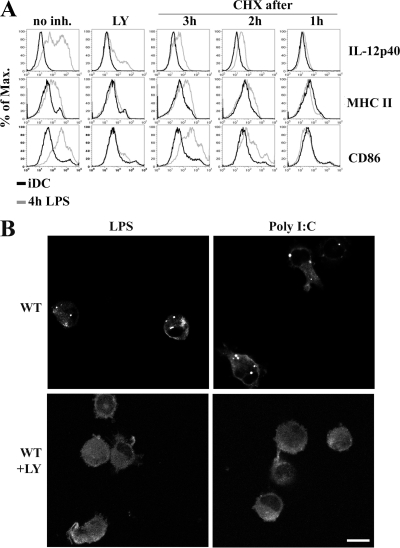
Figure 3. Importance of protein translational increase for DALIS formation and DC immunological functions. (A) Impaired MHC class II and CD86 surface expression up-regulation and cytokine production in maturing DCs upon treatment with LY or CHX. FACS staining of IL-12 synthesis and surface expression of MHC class II and CD86 in iDCs (black line) and mDCs (4 h light gray) are shown for different times of treatment with LY and CHX. (B) After 8 h of LPS (left) or poly I:C (right) stimulation in the absence or in the presence of the PI3K inhibitor LY294002, mice bone marrow–derived DCs were stained for ubiquitinated proteins (FK2) and visualized by confocal microscopy. Bar, 10 μm.
Figure 3. Importance of protein translational increase for DALIS formation and DC immunological functions. (A) Impaired MHC class II and CD86 surface expression up-regulation and cytokine production in maturing DCs upon treatment with LY or CHX. FACS staining of IL-12 synthesis and surface expression of MHC class II and CD86 in iDCs (black line) and mDCs (4 h light gray) are shown for different times of treatment with LY and CHX. (B) After 8 h of LPS (left) or poly I:C (right) stimulation in the absence or in the presence of the PI3K inhibitor LY294002, mice bone marrow–derived DCs were stained for ubiquitinated proteins (FK2) and visualized by confocal microscopy. Bar, 10 μm.CC BY-NC-SA · PubMed Central
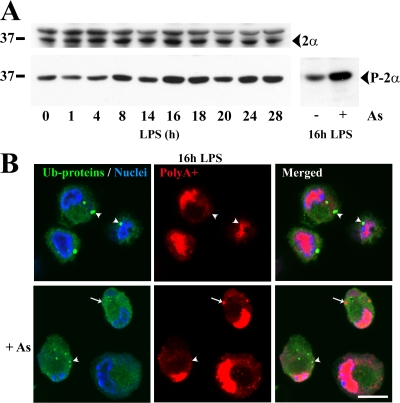
Figure 4. eIF2α phosphorylation increases during DC maturation without inducing SG formation. (A) eIF2α levels remained constant during DC maturation (top) while its phosphorylation increased (bottom left) to a lesser extent than in mDCs treated with 500 μM arsenite (bottom right), as monitored by immunoblot. (B) mDCs were treated (bottom) or not (top) with arsenite before being stained for ubiquitinated proteins (FK2; green), polyA+ mRNA (oligo-dT probe; red), and nuclei (TO-PRO-3; blue). SGs (red; arrows) induced upon arsenite treatment are not enriched in ubiquitinated proteins (green), while DALIS (green; arrowheads) formed upon LPS treatment are not enriched in mRNA (red). Because SGs induced by arsenite did not contain ubiquitinated proteins and conversely DALIS were not enriched in poly-adenylated mRNAs, these are distinct structures. Translation inhibition is responsible for the disappearance of DALIS in the arsenite-treated cells. Bar, 10 μm.
Figure 4. eIF2α phosphorylation increases during DC maturation without inducing SG formation. (A) eIF2α levels remained constant during DC maturation (top) while its phosphorylation increased (bottom left) to a lesser extent than in mDCs treated with 500 μM arsenite (bottom right), as monitored by immunoblot. (B) mDCs were treated (bottom) or not (top) with arsenite before being stained for ubiquitinated proteins (FK2; green), polyA+ mRNA (oligo-dT probe; red), and nuclei (TO-PRO-3; blue). SGs (red; arrows) induced upon arsenite treatment are not enriched in ubiquitinated proteins (green), while DALIS (green; arrowheads) formed upon LPS treatment are not enriched in mRNA (red). Because SGs induced by arsenite did not contain ubiquitinated proteins and conversely DALIS were not enriched in poly-adenylated mRNAs, these are distinct structures. Translation inhibition is responsible for the disappearance of DALIS in the arsenite-treated cells. Bar, 10 μm.CC BY-NC-SA · PubMed Central
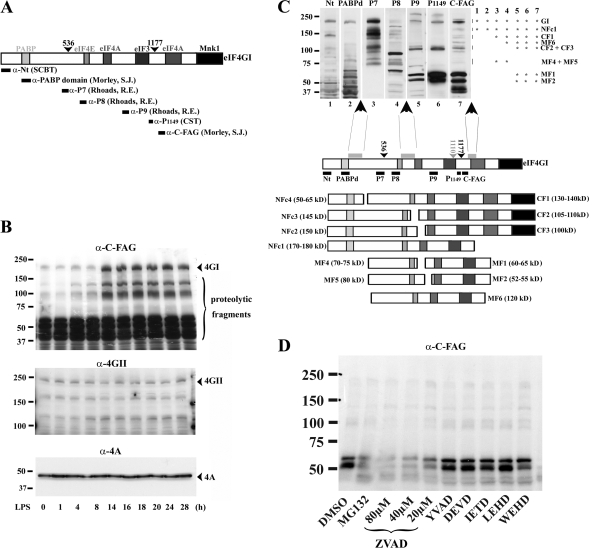
Figure 5. Up-regulation and cleavage of eIF4GI during DC maturation. (A) Scheme of the murine eIF4GI largest isoform. Binding sites for PABP and the different translation initiation factors are boxed. The caspase-3 cleavage sites are indicated with arrowheads. Epitopes recognized by the different antibodies used throughout this study are organized according to their position in eIF4GI. (B) Conversely to eIF4GII (middle) and eIF4A (bottom), eIF4GI and associated fragments (top) are strongly increased after 8 h of maturation as monitored by immunoblot performed with α-C-FAG antibody. (C) Model of eIF4GI cleavage in mDCs. Extracts of mDCs were separated by SDS-PAGE and immunoblotted with different anti-eIF4GI antibodies. Fragment patterns were compared as follows: bands recognized by only one antibody were eliminated; other bands were analyzed according to antibody reactivity (illustrated by asterisks on the right of the immunoblot), molecular weight and comparison to the previously described cleavage products generated by caspase-3, proteasome, picornaviral, and HIV virus proteases. Three major proteolytic sensitive areas (gray boxes) and their putative products were deduced from antibody reactivity and molecular weights. NFc stands for N-terminal fragment cluster because several clustered bands are always displayed due to the existence of the multiple isoforms of eIF4GI. MF stands for middle fragment and CF for C-terminal fragment. (D) Alteration of eIF4GI during DC maturation is prevented by proteasome and pan-caspase inhibitors. Effects of protease inhibitors on eIF4GI fate in DCs were analyzed by immunoblot using the anti- C-FAG antibody. Conversely to MG132 and Z-VAD-FMK, specific caspase inhibitors (YVAD, DEVD, IETD, LEHD, WEHD) had no effect on accumulation of eIF4GI fragments.
Figure 5. Up-regulation and cleavage of eIF4GI during DC maturation. (A) Scheme of the murine eIF4GI largest isoform. Binding sites for PABP and the different translation initiation factors are boxed. The caspase-3 cleavage sites are indicated with arrowheads. Epitopes recognized by the different antibodies used throughout this study are organized according to their position in eIF4GI. (B) Conversely to eIF4GII (middle) and eIF4A (bottom), eIF4GI and associated fragments (top) are strongly increased after 8 h of maturation as monitored by immunoblot performed with α-C-FAG antibody. (C) Model of eIF4GI cleavage in mDCs. Extracts of mDCs were separated by SDS-PAGE and immunoblotted with different anti-eIF4GI antibodies. Fragment patterns were compared as follows: bands recognized by only one antibody were eliminated; other bands were analyzed according to antibody reactivity (illustrated by asterisks on the right of the immunoblot), molecular weight and comparison to the previously described cleavage products generated by caspase-3, proteasome, picornaviral, and HIV virus proteases. Three major proteolytic sensitive areas (gray boxes) and their putative products were deduced from antibody reactivity and molecular weights. NFc stands for N-terminal fragment cluster because several clustered bands are always displayed due to the existence of the multiple isoforms of eIF4GI. MF stands for middle fragment and CF for C-terminal fragment. (D) Alteration of eIF4GI during DC maturation is prevented by proteasome and pan-caspase inhibitors. Effects of protease inhibitors on eIF4GI fate in DCs were analyzed by immunoblot using the anti- C-FAG antibody. Conversely to MG132 and Z-VAD-FMK, specific caspase inhibitors (YVAD, DEVD, IETD, LEHD, WEHD) had no effect on accumulation of eIF4GI fragments.CC BY-NC-SA · PubMed Central
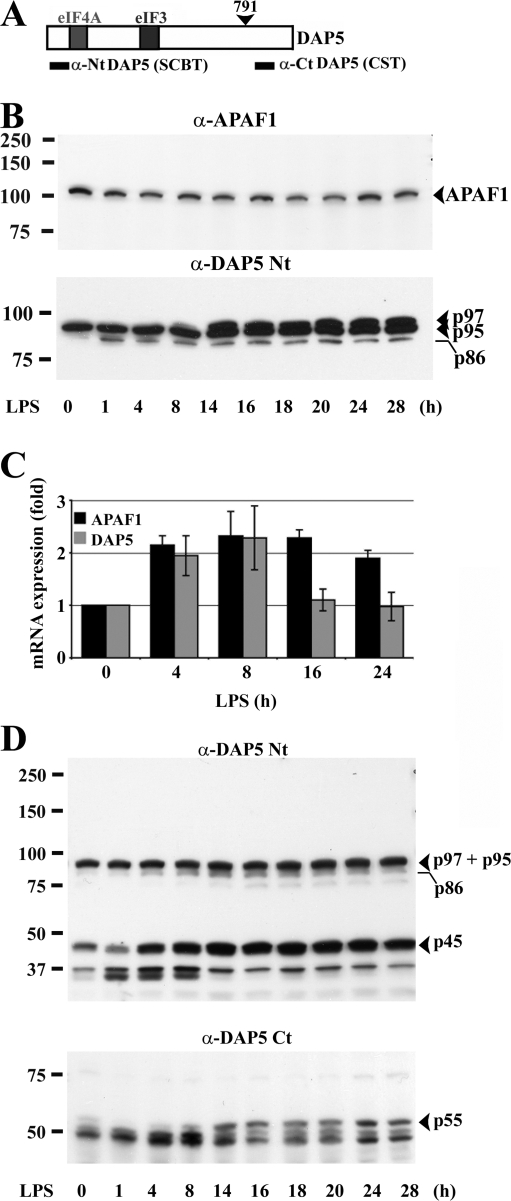
Figure 6. DAP5 translational up-regulation and cleavage in mDCs. (A) Scheme of the murine DAP5. Binding sites for the different translation initiation factors are boxed. (B) Immunoblots of maturing DCs for APAF1 (top) and DAP5 (bottom). Conversely to APAF1, DAP5 p95/p97 is increased during LPS activation. (C) Transcriptional regulation of DAP5 and APAF1. mRNAs were isolated at different stages of DC maturation and quantitative PCR was performed. The mRNA expression levels are indicated as fold regulation normalized to iDCs (0 h). Error bars indicate the SD of three independent duplicated experiments. (D) Alteration of DAP5 during DC maturation. In addition to DAP5/p97, a 45-kD fragment (p45) detected by immunoblot with the α-DAP5 Nt antibody (top) is increased during DC maturation. A complementary fragment of 55 kD (p55) is also detected with the α-DAP5 Ct antibody (bottom).
Figure 6. DAP5 translational up-regulation and cleavage in mDCs. (A) Scheme of the murine DAP5. Binding sites for the different translation initiation factors are boxed. (B) Immunoblots of maturing DCs for APAF1 (top) and DAP5 (bottom). Conversely to APAF1, DAP5 p95/p97 is increased during LPS activation. (C) Transcriptional regulation of DAP5 and APAF1. mRNAs were isolated at different stages of DC maturation and quantitative PCR was performed. The mRNA expression levels are indicated as fold regulation normalized to iDCs (0 h). Error bars indicate the SD of three independent duplicated experiments. (D) Alteration of DAP5 during DC maturation. In addition to DAP5/p97, a 45-kD fragment (p45) detected by immunoblot with the α-DAP5 Nt antibody (top) is increased during DC maturation. A complementary fragment of 55 kD (p55) is also detected with the α-DAP5 Ct antibody (bottom).CC BY-NC-SA · PubMed Central
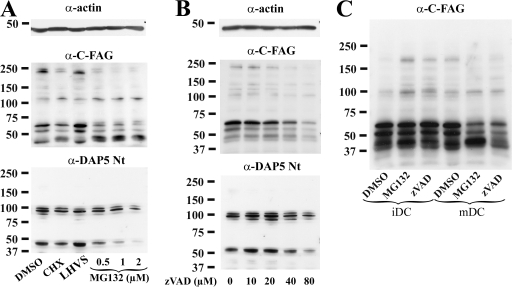
Figure 7. Up-regulation of eIF4GI and DAP5 in mDCs is dependent on their own proteolytic cleavage. Immunoblot detection of eIF4GI and DAP5 in 16 h LPS-activated DCs exposed to pharmacological agents. (A) Conversely to the cysteine protease inhibitor LHVS, the proteasome inhibitor MG132 induced a dose-dependent loss of eIF4GI and DAP5 in mDCs, in a similar fashion to translation inhibition (CHX). (B) Inhibition of caspase-like activities in mDCs with Z-VAD-FMK had a dose-dependent effect comparable to that of MG132 or CHX on eIF4GI and DAP5 levels. (C) In iDCs, MG132 and Z-VAD-FMK treatments favored the accumulation of intact eIF4GI, whereas in mDCs the two drugs promoted its loss, as detected with the anti-C-FAG antibody. Actin immunoblots are shown for equal loading control.
Figure 7. Up-regulation of eIF4GI and DAP5 in mDCs is dependent on their own proteolytic cleavage. Immunoblot detection of eIF4GI and DAP5 in 16 h LPS-activated DCs exposed to pharmacological agents. (A) Conversely to the cysteine protease inhibitor LHVS, the proteasome inhibitor MG132 induced a dose-dependent loss of eIF4GI and DAP5 in mDCs, in a similar fashion to translation inhibition (CHX). (B) Inhibition of caspase-like activities in mDCs with Z-VAD-FMK had a dose-dependent effect comparable to that of MG132 or CHX on eIF4GI and DAP5 levels. (C) In iDCs, MG132 and Z-VAD-FMK treatments favored the accumulation of intact eIF4GI, whereas in mDCs the two drugs promoted its loss, as detected with the anti-C-FAG antibody. Actin immunoblots are shown for equal loading control.CC BY-NC-SA · PubMed Central
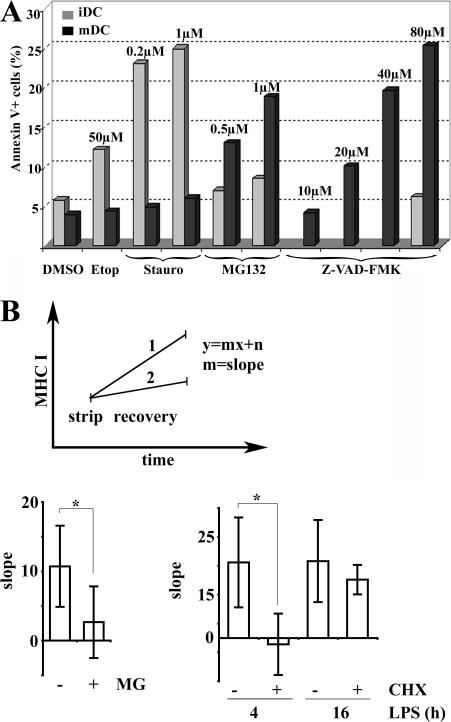
Figure 8. Translation regulation influences DC survival and MHC class I presentation. (A) Effect of proteasome inhibition on DC survival. Surface annexin V staining was quantified by FACS on CD11c+ gated cells. iDCs (gray bars) were sensitive to the apoptosis inducers etoposide (Etop) and staurosporine (Stauro), whereas mDCs (black bars) remained unaffected. Conversely, MG132 and Z-VAD-FMK treatment induced apoptosis in mDCs and had little effect in iDCs. Data are from one representative experiment out of four performed. (B) Origin of MHC I ligands during DC maturation. Surface levels of peptide-loaded Kb molecules were monitored by FACS using the HB-176 antibody, which recognizes conformed H-2Kb molecules independently of their peptide ligands. Acid stripping was used to decrease surface peptide loaded H-2Kb and increase the sensitivity of detecting newly arriving surface MHC I molecules. Surface H-2Kb recovery over 2 h after strip was monitored with or without chemical treatment (MG132 or CHX) and data were plotted as a linear function where the x-value is time and the y-value the level of peptide-loaded MHC I. Slopes (recovery rate) of the linear function were compared to establish the importance of proteasome degradation and protein synthesis for MHC class I surface arrival during DC maturation (example shown in the top panel). Higher slopes indicate higher surface appearance of new peptide-loaded MHC I molecules. As expected, treatment of mDCs with the proteasome inhibitor MG132 decreased the MHC I recovery rate (MG, bottom left), whereas no difference was detected among 4 h and 16 h LPS-activated mDCs (bottom right). Inhibition of protein synthesis with CHX prevented the recovery of 4 h LPS-stimulated DC but not of 16 h stimulated DC (bottom right). Error bars indicate the SD of five independent experiments and the significance was determined by using t test (*, P < 0.05).
Figure 8. Translation regulation influences DC survival and MHC class I presentation. (A) Effect of proteasome inhibition on DC survival. Surface annexin V staining was quantified by FACS on CD11c+ gated cells. iDCs (gray bars) were sensitive to the apoptosis inducers etoposide (Etop) and staurosporine (Stauro), whereas mDCs (black bars) remained unaffected. Conversely, MG132 and Z-VAD-FMK treatment induced apoptosis in mDCs and had little effect in iDCs. Data are from one representative experiment out of four performed. (B) Origin of MHC I ligands during DC maturation. Surface levels of peptide-loaded Kb molecules were monitored by FACS using the HB-176 antibody, which recognizes conformed H-2Kb molecules independently of their peptide ligands. Acid stripping was used to decrease surface peptide loaded H-2Kb and increase the sensitivity of detecting newly arriving surface MHC I molecules. Surface H-2Kb recovery over 2 h after strip was monitored with or without chemical treatment (MG132 or CHX) and data were plotted as a linear function where the x-value is time and the y-value the level of peptide-loaded MHC I. Slopes (recovery rate) of the linear function were compared to establish the importance of proteasome degradation and protein synthesis for MHC class I surface arrival during DC maturation (example shown in the top panel). Higher slopes indicate higher surface appearance of new peptide-loaded MHC I molecules. As expected, treatment of mDCs with the proteasome inhibitor MG132 decreased the MHC I recovery rate (MG, bottom left), whereas no difference was detected among 4 h and 16 h LPS-activated mDCs (bottom right). Inhibition of protein synthesis with CHX prevented the recovery of 4 h LPS-stimulated DC but not of 16 h stimulated DC (bottom right). Error bars indicate the SD of five independent experiments and the significance was determined by using t test (*, P < 0.05).CC BY-NC-SA · PubMed Central

Verification

Claims the paper makes

The claims and statistics of this paper haven’t been checked yet.

Run the check — free, no account needed. It reads the open-access text and checks the sources it cites.

A few free checks a day · papers already verified open instantly · results are public

Claims other papers make about this one

Each is checked against this paper’s own text: does it say what the citing paper says it does?

Self-check

Percentages, sums and reported differences re-computed from the paper’s own numbers.

The self-check needs the paper’s full text.

Citations

Cites

No references could be resolved yet.

Research works printed but not linked: 37

  1. 2003, J. Virol., 77, 12392, 10.1128/JVI.77.23.12392-12400.2003 · DOI
  2. 2002, J. Cell Sci., 115, 3227, 10.1242/jcs.115.16.3227 · DOI
  3. 2001, Proc. Natl. Acad. Sci. USA., 98, 136, 10.1073/pnas.98.1.136 · DOI
  4. 2000, Nat. Immunol., 1, 533, 10.1038/82797 · DOI
  5. 1998, Nature., 392, 245, 10.1038/32588 · DOI
  6. 2004, Mol. Cell., 16, 575, 10.1016/j.molcel.2004.10.017 · DOI
  7. 2000, Cell Death Differ., 7, 628, 10.1038/sj.cdd.4400699 · DOI
  8. 2005, J. Biol. Chem., 280, 18610, 10.1074/jbc.M414014200 · DOI
  9. 2004, Eur. J. Biochem., 271, 3596, 10.1111/j.0014-2956.2004.04306.x · DOI
  10. 2004, Mol. Cell. Biol., 24, 200, 10.1128/MCB.24.1.200-216.2004 · DOI
  11. 2002, Nat. Immunol., 3, 875, 10.1038/ni825 · DOI
  12. 2004, Nat. Rev. Mol. Cell Biol., 5, 827
  13. 1999, Annu. Rev. Biochem., 68, 913, 10.1146/annurev.biochem.68.1.913 · DOI
  14. 2000, Mol. Cell. Biol., 20, 496, 10.1128/MCB.20.2.496-506.2000 · DOI
  15. 2005, J. Immunol., 175, 891, 10.4049/jimmunol.175.2.891 · DOI
  16. 2005, Nat. Rev. Mol. Cell Biol., 6, 318, 10.1038/nrm1618 · DOI
  17. 2004, Nat. Immunol., 5, 583, 10.1038/ni1071 · DOI
  18. 2002, Immunity., 17, 211, 10.1016/S1074-7613(02)00365-5 · DOI
  19. 2001, Trends Immunol., 22, 78, 10.1016/S1471-4906(00)01811-1 · DOI
  20. 2003, J. Biol. Chem., 278, 35869, 10.1074/jbc.M303725200 · DOI
  21. 2002, Nature., 417, 177, 10.1038/417177a · DOI
  22. 2004, J. Cell Biol., 164, 667, 10.1083/jcb.200312073 · DOI
  23. 2001, Cell., 106, 255, 10.1016/S0092-8674(01)00449-4 · DOI
  24. 2005, Cell Death Differ., 12, 571, 10.1038/sj.cdd.4401591 · DOI
  25. 2003, J. Biol. Chem., 278, 3572, 10.1074/jbc.M206781200 · DOI
  26. 2005, Immunol. Rev., 207, 184, 10.1111/j.0105-2896.2005.00300.x · DOI · Paper page
  27. 1997, Nature., 388, 787, 10.1038/42039 · DOI
  28. 2003, Biol. Cell., 95, 141, 10.1016/S0248-4900(03)00031-5 · DOI
  29. 2003, Immunity., 18, 343, 10.1016/S1074-7613(03)00051-7 · DOI · Paper page
  30. 2006, J. Biol. Chem., 281, 392, 10.1074/jbc.M509126200 · DOI
  31. 2006, J. Immunol., 177, 227, 10.4049/jimmunol.177.1.227 · DOI
  32. 2000, EMBO J., 19, 434, 10.1093/emboj/19.3.434 · DOI
  33. 2005, Oncogene., 24, 7426, 10.1038/sj.onc.1209098 · DOI
  34. 2006, Nat. Immunol., 7, 644
  35. 2005, Cell Death Differ., 12, 585, 10.1038/sj.cdd.4401642 · DOI
  36. 1997, Mol. Cell. Biol., 17, 5426, 10.1128/MCB.17.9.5426 · DOI
  37. 2004, Cancer Res., 64, 1293, 10.1158/0008-5472.CAN-03-2517 · DOI

Cited by

Sorted by citations

See all 88

Metadata

Authors
Lelouard, H., Schmidt, E. K., Camosseto, V., Clavarino, G., Ceppi, M., Hsu, H.-T., & Pierre, P.
Affiliations
1Centre d'Immunologie de Marseille-Luminy, Université de la Méditerranée, Case 906, 13288 Marseille, France
Venue
The Journal of Cell Biology
Published
2007-12-31
Volume
179
Issue
7
Pages
1427-1439
ISSN
  • 1540-8140
  • 0021-9525
Cited by
88
References
0
Language
en

About these checks

Registry, retraction, Cites and statistics results are computed, not judged, with one exception: a printed reference that no index lists is read once by a model before it counts as a citation error. Claims are extracted by a model and kept only when their quote appears verbatim in the text; each cited source is then checked, with a model’s help, for whether it says what the claim relies on. Those verdicts can be wrong — read the claim’s quote and the cited source before relying on one.

Statistics and arithmetic are recomputed, not judged.

Confidence bands are shown only for fields calibrated on our annotated test set. None is calibrated yet, so no band is shown.

What counts as a claim ›How we measure confidence ›How we check this ›

Are you an author, or do you see a problem with this page? Request a review

How to cite

Cite CoChat for the checks on this page, and the paper for its own findings.

This page
CoChat. (2026). Citation check: Regulation of translation is required for dendritic cell function and survival during activation. https://app.cochat.ai/papers/10.1083/jcb.200707166
The paper
Lelouard, H., Schmidt, E. K., Camosseto, V., Clavarino, G., Ceppi, M., Hsu, H.-T., & Pierre, P. (2007). Regulation of translation is required for dendritic cell function and survival during activation. The Journal of Cell Biology. https://doi.org/10.1083/jcb.200707166