

The DOI matches its Crossref record; 83 of the 83 references it cites were found in a registry or an index.
CCM1–ICAP-1 complex controls β1 integrin–dependent endothelial contractility and fibronectin remodeling
Open accessAbstract
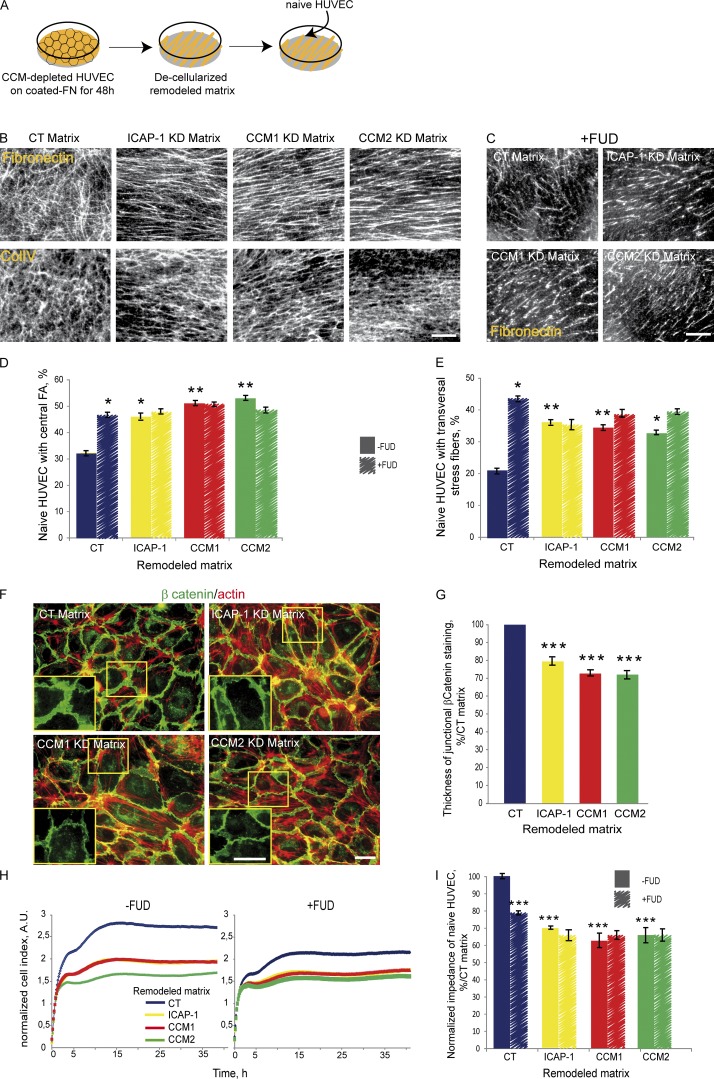
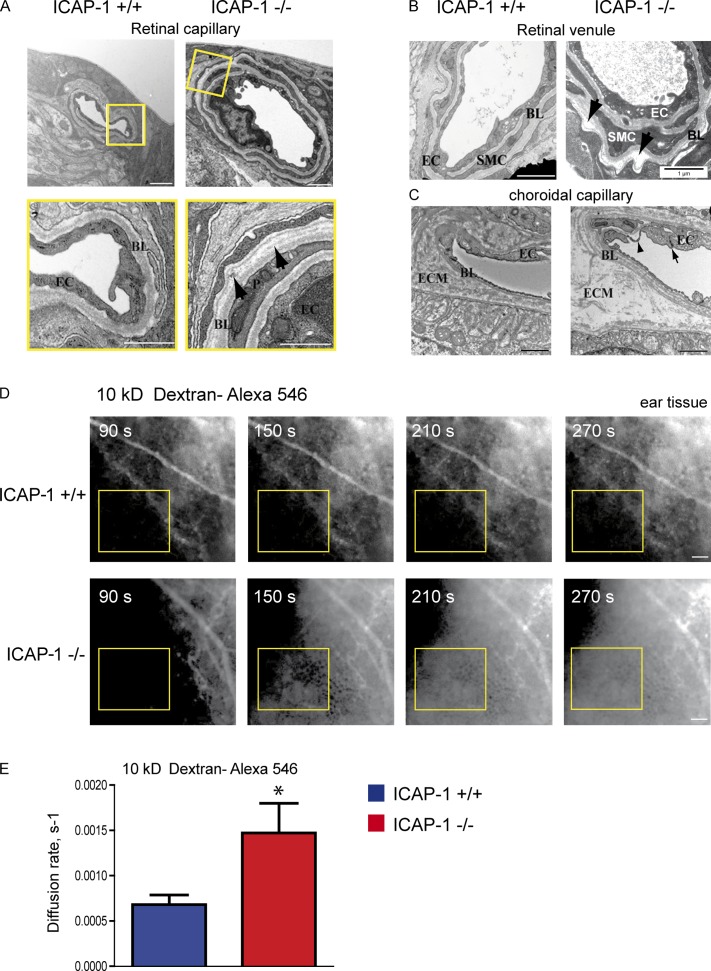
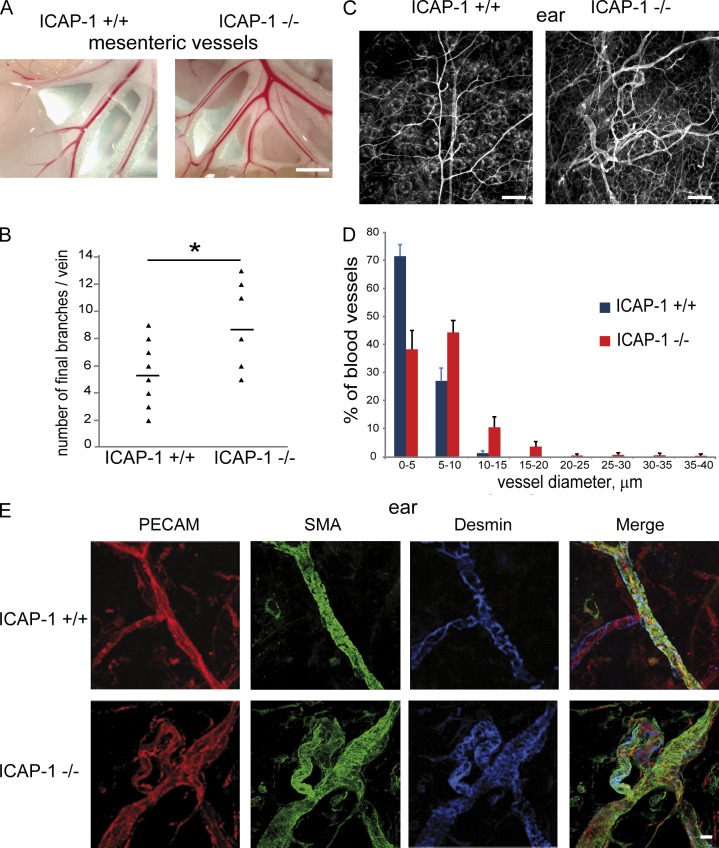
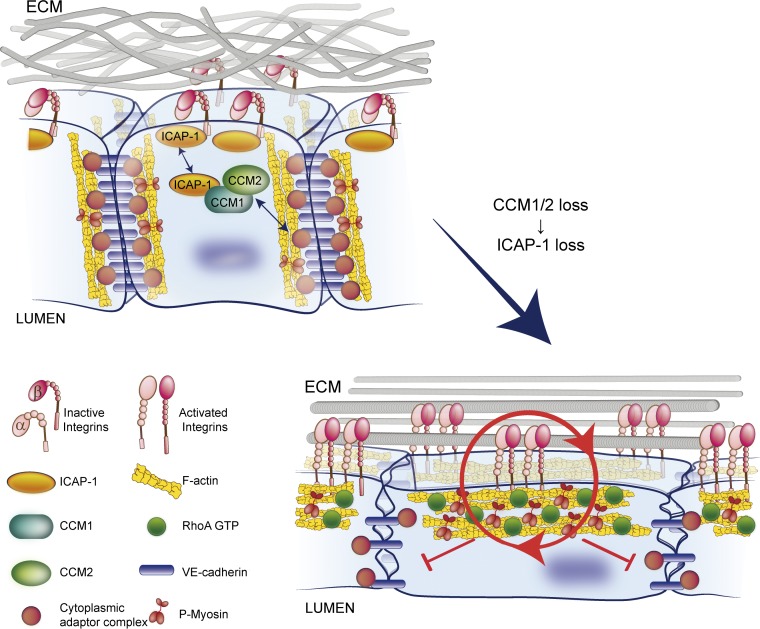
The endothelial CCM complex regulates blood vessel stability and permeability. Loss-of-function mutations in CCM genes are responsible for human cerebral cavernous malformations (CCMs), which are characterized by clusters of hemorrhagic dilated capillaries composed of endothelium lacking mural cells and altered sub-endothelial extracellular matrix (ECM). Association of the CCM1/2 complex with ICAP-1, an inhibitor of β1 integrin, prompted us to investigate whether the CCM complex interferes with integrin signaling. We demonstrate that CCM1/2 loss resulted in ICAP-1 destabilization, which increased β1 integrin activation and led to increased RhoA-dependent contractility. The resulting abnormal distribution of forces led to aberrant ECM remodeling around lesions of CCM1- and CCM2-deficient mice. ICAP-1–deficient vessels displayed similar defects. We demonstrate that a positive feedback loop between the aberrant ECM and internal cellular tension led to decreased endothelial barrier function. Our data support that up-regulation of β1 integrin activation participates in the progression of CCM lesions by destabilizing intercellular junctions through increased cell contractility and aberrant ECM remodeling.
Overview
The claims and statistics of this paper haven’t been checked yet.
Run the check — free, no account needed. It reads the open-access text and checks the sources it cites.
Integrity signals
Registry
Cites
Statistics
Figures
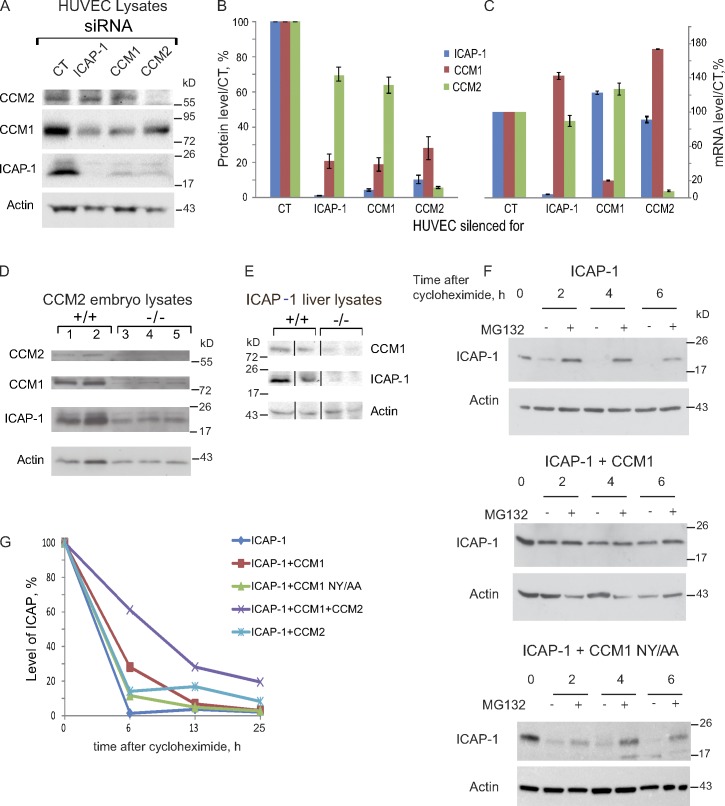
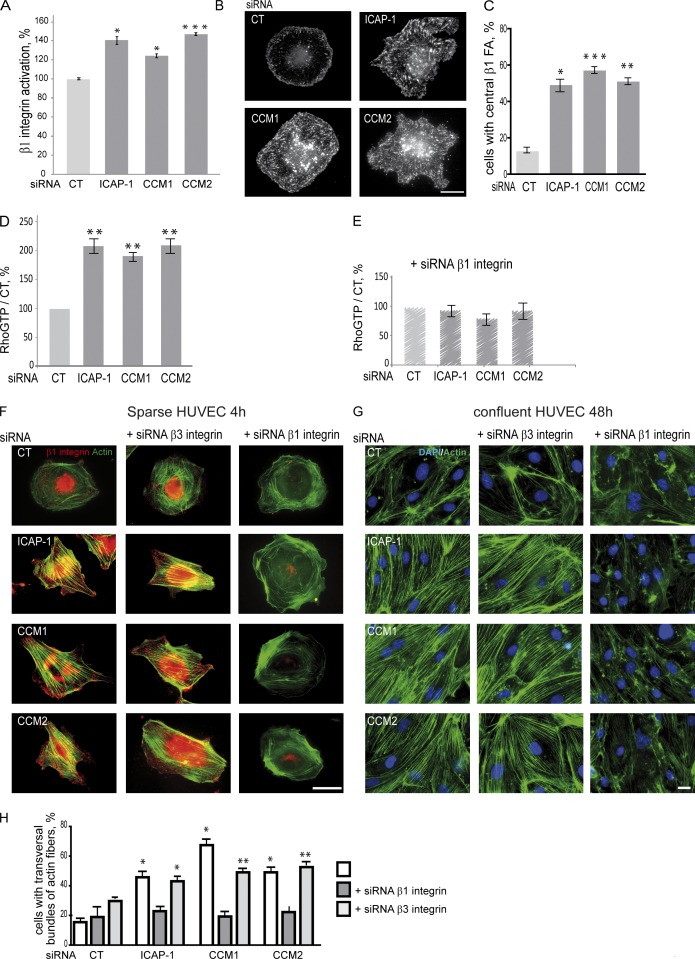
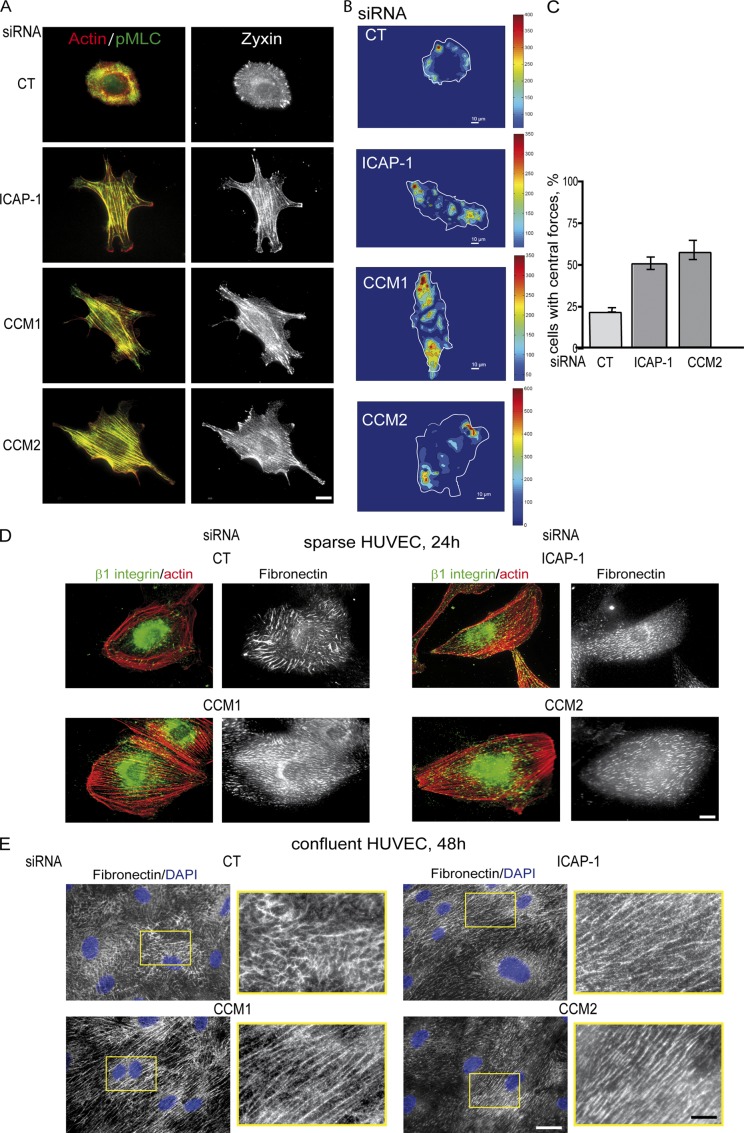
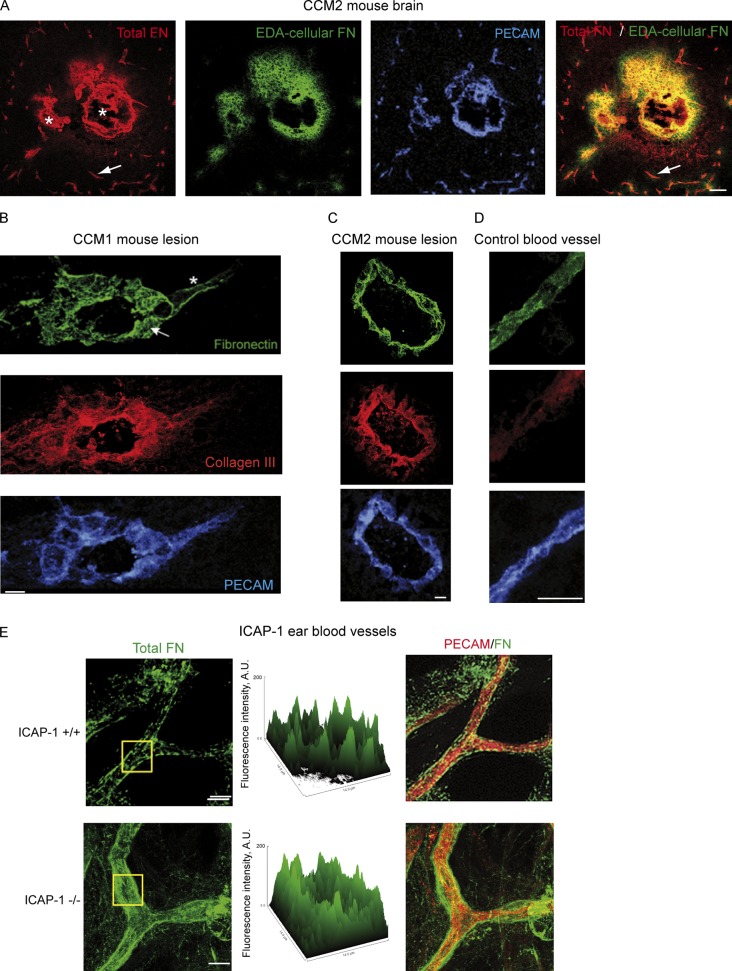
Verification
Claims the paper makes
The claims and statistics of this paper haven’t been checked yet.
Run the check — free, no account needed. It reads the open-access text and checks the sources it cites.
Claims other papers make about this one
Each is checked against this paper’s own text: does it say what the citing paper says it does?
The source backs part of the claim, not all of it — or backs it for a different population, condition or comparison.
In the citing paper
“A recent report demonstrated that activation of β1-integrin due to loss of its inhibitor, ICAP-1, in human cerebral cavernous malformations, results in β1-integrin deposition in fibrillar adhesions, increased actin stress fibres and reduced endothelial barrier function35, suggesting that increased β1-integrin activity destabilizes intercellular junctions via increased cell contractility and”
From Endothelial destabilization by angiopoietin-2 via integrin β1 activation (2015) · cites this paper as [35]
Experimental — accuracy not yet measured
Self-check
Percentages, sums and reported differences re-computed from the paper’s own numbers.
The self-check needs the paper’s full text.
Citations
Cites
Hynes (2002) · doi:10.1016/s0092-8674(02)00971-6 · Cited by 8,606
Cell adhesion: integrating cytoskeletal dynamics and cellular tension
Parsons, J. T., Horwitz, A. R., & Schwartz, M. A. (2010) · Nature Reviews Molecular Cell Biology · doi:10.1038/nrm2957 · Cited by 2,081
Binding of soluble form of fibroblast surface protein, fibronectin, to collagen
Engvall, E., & Ruoslahti, E. (1977) · International Journal of Cancer · doi:10.1002/ijc.2910200102 · Cited by 1,947
Signaling Mechanisms Regulating Endothelial Permeability
Mehta, D., & Malik, A. B. (2005) · Physiological Reviews · doi:10.1152/physrev.00012.2005 · Cited by 1,754
Gaggioli, C., Hooper, S., Hidalgo-Carcedo, C., Grosse, R., Marshall, J. F., Harrington, K., & Sahai, E. (2007) · Nature Cell Biology · doi:10.1038/ncb1658 · Cited by 1,589 · cited 1×
“Interestingly, highly aligned and organized collagen fibers are also found around tumors in vivo and generate a stiff microenvironment favorable for tumor cell invasiveness (Gaggioli et al., 2007; Provenzano et al., 2008; Goetz et al., 2011).”
Permanent cell line expressing human factor VIII-related antigen established by hybridization.
Edgell, C. J., McDonald, C., & Graham, J. B. (1983) · Proceedings of the National Academy of Sciences · doi:10.1073/pnas.80.12.3734 · Cited by 1,495
Balancing forces: architectural control of mechanotransduction
DuFort, C. C., Paszek, M. J., & Weaver, V. M. (2011) · Nature Reviews Molecular Cell Biology · doi:10.1038/nrm3112 · Cited by 1,013
Assembly of Fibronectin Extracellular Matrix
Singh, P., Carraher, C. L., & Schwarzbauer, J. E. (2010) · Annual Review of Cell and Developmental Biology · doi:10.1146/annurev-cellbio-100109-104020 · Cited by 964
Adhesion signaling – crosstalk between integrins, Src and Rho
Huveneers, S., & Danen, E. H. J. (2009) · Journal of Cell Science · doi:10.1242/jcs.039446 · Cited by 845
Goetz, J. G., Minguet, S., Navarro-Lérida, I., Lazcano, J. J., Samaniego, R., Calvo, E., Tello, M., Osteso-Ibáñez, T., Pellinen, T., Echarri, A., et al. (2011) · Cell · doi:10.1016/j.cell.2011.05.040 · Cited by 720
Sottile, J., & Hocking, D. C. (2002) · Molecular Biology of the Cell · doi:10.1091/mbc.e02-01-0048 · Cited by 637
Spatial organization of the extracellular matrix regulates cell–cell junction positioning
Tseng, Q., Duchemin-Pelletier, E., Deshière, A., Balland, M., Guillou, H., Filhol, O., & Théry, M. (2012) · Proceedings of the National Academy of Sciences · doi:10.1073/pnas.1106377109 · Cited by 611
Self-citationStratman, A. N., Malotte, K. M., Mahan, R. D., Davis, M. J., & Davis, G. E. (2009) · Blood · doi:10.1182/blood-2009-05-222364 · Cited by 581
The matrix reorganized: extracellular matrix remodeling and integrin signaling
Larsen, M., Artym, V. V., Green, J. A., & Yamada, K. M. (2006) · Current Opinion in Cell Biology · doi:10.1016/j.ceb.2006.08.009 · Cited by 541
Cell-ECM traction force modulates endogenous tension at cell–cell contacts
Maruthamuthu, V., Sabass, B., Schwarz, U. S., & Gardel, M. L. (2011) · Proceedings of the National Academy of Sciences · doi:10.1073/pnas.1011123108 · Cited by 520
Provenzano, P. P., Inman, D. R., Eliceiri, K. W., Trier, S. M., & Keely, P. J. (2008) · Biophysical Journal · doi:10.1529/biophysj.108.133116 · Cited by 493
Fibronectins, Their Fibrillogenesis, and In Vivo FunctionsPreprint
Schwarzbauer, J. E., & DeSimone, D. W. (2011) · Cold Spring Harbor Perspectives in Biology · doi:10.1101/cshperspect.a005041 · Cited by 445
The Rho GEFs LARG and GEF-H1 regulate the mechanical response to force on integrins
Guilluy, C., Swaminathan, V., García‐Mata, R., O’Brien, E. T., Superfine, R., & Burridge, K. (2011) · Nature Cell Biology · doi:10.1038/ncb2254 · Cited by 396
The cerebral cavernous malformation signaling pathway promotes vascular integrity via Rho GTPases
Whitehead, K. J., Chan, A. C., Navankasattusas, S., Koh, W., London, N. R., Jing, L., Mayo, A. H., Drakos, S. G., Jones, C. A., Zhu, W., et al. (2009) · Nature Medicine · doi:10.1038/nm.1911 · Cited by 377
Modulation of cell migration by integrin-mediated cytoskeletal linkages and ligand-binding affinity.
Huttenlocher, A., Ginsberg, M. H., & Horwitz, A. F. (1996) · The Journal of Cell Biology · doi:10.1083/jcb.134.6.1551 · Cited by 368
Lebrin, F., Srun, S., Raymond, K., Martín, S., van den Brink, S., Freitas, C., Bréant, C., Mathivet, T., Larrivée, B., Thomas, J., et al. (2010) · Nature Medicine · doi:10.1038/nm.2131 · Cited by 365
Cerebral cavernous malformations proteins inhibit Rho kinase to stabilize vascular integrity
Stockton, R. A., Shenkar, R., Awad, I. A., & Ginsberg, M. H. (2010) · The Journal of Experimental Medicine · doi:10.1084/jem.20091258 · Cited by 353
Velling, T., Risteli, J., Wennerberg, K., Mosher, D., & Johansson, S. (2002) · Journal of Biological Chemistry · doi:10.1074/jbc.m206286200 · Cited by 339
Clatterbuck, R. E. (2001) · Journal of Neurology Neurosurgery & Psychiatry · doi:10.1136/jnnp.71.2.188 · Cited by 327
KRIT-1/CCM1 is a Rap1 effector that regulates endothelial cell–cell junctions
Glading, A., Han, J., Stockton, R. A., & Ginsberg, M. H. (2007) · The Journal of Cell Biology · doi:10.1083/jcb.200705175 · Cited by 317
Bazzoni, G., Shih, D.-T., Buck, C. A., & Hemler, M. E. (1995) · Journal of Biological Chemistry · doi:10.1074/jbc.270.43.25570 · Cited by 276
Colombelli, J., Besser, A., Kress, H., Reynaud, E. G., Girard, P. P., Caussinus, E., Haselmann, U., Small, J. V., Schwarz, U. S., & Stelzer, E. H. K. (2009) · Journal of Cell Science · doi:10.1242/jcs.042986 · Cited by 276
Control of cell adhesion dynamics by Rap1 signaling
Boettner, B., & Aelst, L. V. (2009) · Current Opinion in Cell Biology · doi:10.1016/j.ceb.2009.06.004 · Cited by 270
Tseng, Q., Wang, I., Duchemin-Pelletier, E., Azioune, A., Carpi, N., Gao, J., Filhol, O., Piel, M., Théry, M., & Balland, M. (2011) · Lab on a Chip · doi:10.1039/c0lc00641f · Cited by 268
Self-citationZovein, A. C., Luque, A., Turlo, K. A., Hofmann, J. J., Yee, K. M., Becker, M. S., Fassler, R., Mellman, I., Lane, T. F., & Iruela-Arispe, M. L. (2010) · Developmental Cell · doi:10.1016/j.devcel.2009.12.006 · Cited by 256
Zawistowski, J. S., Stalheim, L., Uhlik, M. T., Abell, A. N., Ancrile, B. B., Johnson, G. L., & Marchuk, D. A. (2005) · Human Molecular Genetics · doi:10.1093/hmg/ddi256 · Cited by 254
Kleaveland, B., Zheng, X., Liu, J., Blum, Y., Tung, J. J., Zou, Z., Sweeney, S. M., Chen, M., Guo, L., Lu, M., et al. (2009) · Nature Medicine · doi:10.1038/nm.1918 · Cited by 248
Substrate stiffening promotes endothelial monolayer disruption through enhanced physical forces
Krishnan, R., Klumpers, D. D., Park, C. Y., Rajendran, K., Trepat, X., van Bezu, J. S. M., van Hinsbergh, V. W. M., Carman, C. V., Brain, J. D., Fredberg, J. J., et al. (2010) · American Journal of Physiology-Cell Physiology · doi:10.1152/ajpcell.00195.2010 · Cited by 229
Fibronectin fibrillogenesis regulates three-dimensional neovessel formationPreprint
Zhou, X., Rowe, R. G., Hiraoka, N., George, J. P., Wirtz, D., Mosher, D. F., Virtanen, I., Chernousov, M. A., & Weiss, S. J. (2008) · Genes & Development · doi:10.1101/gad.1643308 · Cited by 217
The Extra-domain A of Fibronectin Is a Vascular Marker of Solid Tumors and Metastases
Rybak, J., Roesli, C., Kaspar, M., Villa, A., & Neri, D. (2007) · Cancer Research · doi:10.1158/0008-5472.can-07-1436 · Cited by 212
Pagenstecher, A., Stahl, S., Sure, U., & Felbor, U. (2008) · Human Molecular Genetics · doi:10.1093/hmg/ddn420 · Cited by 209
Whitehead, K. J., Plummer, N. W., Adams, J. A., Marchuk, D. A., & Li, D. Y. (2004) · Development · doi:10.1242/dev.01036 · Cited by 200
Zhang, J. (2001) · Human Molecular Genetics · doi:10.1093/hmg/10.25.2953 · Cited by 200
Zawistowski, J. S. (2002) · Human Molecular Genetics · doi:10.1093/hmg/11.4.389 · Cited by 197
Fibronectin-dependent collagen I deposition modulates the cell response to fibronectin
Sottile, J., Shi, F., Rublyevska, I., Chiang, H., Lust, J., & Chandler, J. (2007) · American Journal of Physiology-Cell Physiology · doi:10.1152/ajpcell.00130.2007 · Cited by 191
Chang, D. D., Wong, C., Smith, H., & Liu, J. X. (1997) · The Journal of Cell Biology · doi:10.1083/jcb.138.5.1149 · Cited by 185
Recent insights into cerebral cavernous malformations: the molecular genetics of CCM
Riant, F., Bergametti, F., Ayrignac, X., Boulday, G., & Tournier‐Lasserve, E. (2010) · FEBS Journal · doi:10.1111/j.1742-4658.2009.07535.x · Cited by 184
Self-citationUltrastructural Pathological Features of Cerebrovascular Malformations: A Preliminary Report
Wong, J. H., Awad, I. A., & Kim, J. H. (2000) · Neurosurgery · doi:10.1097/00006123-200006000-00027 · Cited by 183
Specific Association Of CD63 with the VLA-3 and VLA-6 Integrins
Berditchevski, F., Bazzoni, G., & Hemler, M. E. (1995) · Journal of Biological Chemistry · doi:10.1074/jbc.270.30.17784 · Cited by 181
β1-Integrin: A Potential Therapeutic Target in the Battle against Cancer Recurrence
Barkan, D., & Chambers, A. F. (2011) · Clinical Cancer Research · doi:10.1158/1078-0432.ccr-11-0642 · Cited by 181
CCM1 regulates vascular-lumen organization by inducing endothelial polarity
Lampugnani, M. G., Orsenigo, F., Rudini, N., Maddaluno, L., Boulday, G., Chapon, F., & Dejana, E. (2010) · Journal of Cell Science · doi:10.1242/jcs.059329 · Cited by 180
Self-citationDynamic and Label-Free Cell-Based Assays Using the Real-Time Cell Electronic Sensing System
Atienza, J. M., Yu, N., Kirstein, S. L., Xi, B., Wang, X., Xu, X. Y., & Abassi, Y. A. (2006) · Assay and Drug Development Technologies · doi:10.1089/adt.2006.4.597 · Cited by 179
Cell Traction Forces Direct Fibronectin Matrix Assembly
Lemmon, C. A., Chen, C. S., & Romer, L. H. (2009) · Biophysical Journal · doi:10.1016/j.bpj.2008.10.009 · Cited by 168
Second Harmonic Generation Confocal Microscopy of Collagen Type I from Rat Tendon Cryosections
Theodossiou, T. A., Thrasivoulou, C., Ekwobi, C. C., & Becker, D. L. (2006) · Biophysical Journal · doi:10.1529/biophysj.106.093740 · Cited by 166
Fasudil Decreases Lesion Burden in a Murine Model of Cerebral Cavernous Malformation Disease
McDonald, D. A., Shi, C., Shenkar, R., Stockton, R. A., Liu, F., Ginsberg, M. H., Marchuk, D. A., & Awad, I. A. (2011) · Stroke · doi:10.1161/strokeaha.111.625467 · Cited by 151
Proteomic Identification of the Cerebral Cavernous Malformation Signaling Complex
Hilder, T. L., Malone, M. H., Bencharit, S., Colicelli, J., Haystead, T., Johnson, G. L., & Wu, C. C. (2007) · Journal of Proteome Research · doi:10.1021/pr0704276 · Cited by 149
Huveneers, S., Truong, H. H., Fässler, R., Sonnenberg, A., & Danen, E. H. J. (2008) · Journal of Cell Science · doi:10.1242/jcs.033001 · Cited by 146
Mutations in 2 distinct genetic pathways result in cerebral cavernous malformations in mice
Chan, A. C., Drakos, S. G., Ruiz, O. E., Smith, A. C. H., Gibson, C. C., Jing, L., Passi, S. F., Stratman, A. N., Sacharidou, A., Revelo, M. P., et al. (2011) · Journal of Clinical Investigation · doi:10.1172/jci44393 · Cited by 145
Obberghen‐Schilling, E. V., Tucker, R. P., Saupe, F., Gasser, I., Cseh, B., & Orend, G. (2011) · The International Journal of Developmental Biology · doi:10.1387/ijdb.103243eo · Cited by 144
Rho Kinase Inhibition Rescues the Endothelial Cell Cerebral Cavernous Malformation Phenotype
Borikova, A. L., Dibble, C. F., Sciaky, N., Welch, C. M., Abell, A. N., Bencharit, S., & Johnson, G. L. (2010) · Journal of Biological Chemistry · doi:10.1074/jbc.c109.097220 · Cited by 140
Developmental timing of CCM2 loss influences cerebral cavernous malformations in mice
Boulday, G., Rudini, N., Maddaluno, L., Blécon, A., Arnould, M., Gaudric, A., Chapon, F., Adams, R. H., Dejana, E., & Tournier‐Lasserve, E. (2011) · The Journal of Experimental Medicine · doi:10.1084/jem.20110571 · Cited by 138
Self-citationSpatial organization of adhesion: force‐dependent regulation and function in tissue morphogenesis
Papusheva, E., & Heisenberg, C. (2010) · The EMBO Journal · doi:10.1038/emboj.2010.182 · Cited by 133
McDonald, D. A., Shenkar, R., Shi, C., Stockton, R. A., Akers, A. L., Kucherlapati, M. H., Kucherlapati, R., Brainer, J., Ginsberg, M. H., Awad, I. A., et al. (2010) · Human Molecular Genetics · doi:10.1093/hmg/ddq433 · Cited by 132
Clark, K., Pankov, R. G., Travis, M. A., Askari, J. A., Mould, A. P., Craig, S. E., Newham, P., Yamada, K. M., & Humphries, M. J. (2004) · Journal of Cell Science · doi:10.1242/jcs.01623 · Cited by 131
A 49-Residue Peptide from Adhesin F1 of Streptococcus pyogenes Inhibits Fibronectin Matrix Assembly
Tomasini-Johansson, B. R., Kaufman, N. R., Ensenberger, M. G., Ozeri, V., Hanski, E., & Mosher, D. F. (2001) · Journal of Biological Chemistry · doi:10.1074/jbc.m103467200 · Cited by 126
Integrin β1 Subunit Controls Mural Cell Adhesion, Spreading, and Blood Vessel Wall Stability
Abraham, S., Kogata, N., Fässler, R., & Adams, R. H. (2008) · Circulation Research · doi:10.1161/circresaha.107.167908 · Cited by 124
Interaction of the Integrin β1 Cytoplasmic Domain with ICAP-1 Protein
Zhang, X. A., & Hemler, M. E. (1999) · Journal of Biological Chemistry · doi:10.1074/jbc.274.1.11 · Cited by 118
Osteoblast mineralization requires β1 integrin/ICAP-1–dependent fibronectin deposition
Brunner, M., Millon‐Frémillon, A., Chevalier, G., Nakchbandi, I. A., Mosher, D. F., Block, M. R., Albigès‐Rizo, C., & Bouvard, D. (2011) · The Journal of Cell Biology · doi:10.1083/jcb.201007108 · Cited by 118
Self-citationBoulday, G., Blécon, A., Petit, N., Chareyre, F., Garcı́a, L., Niwa‐Kawakita, M., Giovannini, M., & Tournier‐Lasserve, E. (2009) · Disease Models & Mechanisms · doi:10.1242/dmm.001263 · Cited by 112
Self-citationDown regulation of talin alters cell adhesion and the processing of the α5β1 integrin
Albigès‐Rizo, C., Frachet, P., & Block, M. R. (1995) · Journal of Cell Science · doi:10.1242/jcs.108.10.3317 · Cited by 110
Recent insights into cerebral cavernous malformations: a complex jigsaw puzzle under construction
Faurobert, E., & Albigès‐Rizo, C. (2010) · FEBS Journal · doi:10.1111/j.1742-4658.2009.07537.x · Cited by 103
Self-citationMillon‐Frémillon, A., Bouvard, D., Grichine, A., Manet, S., Block, M. R., & Albigès‐Rizo, C. (2008) · The Journal of Cell Biology · doi:10.1083/jcb.200707142 · Cited by 100
Self-citationOsteoblast mineralization requires β1 integrin/ICAP-1–dependent fibronectin deposition
Brunner, M., Millon‐Frémillon, A., Chevalier, G., Nakchbandi, I. A., Mosher, D. F., Block, M. R., Albigès‐Rizo, C., & Bouvard, D. (2013) · The Journal of Cell Biology · doi:10.1083/jcb.20100710804302013c · Cited by 100
Self-citationDisruption of Focal Adhesions by Integrin Cytoplasmic Domain-associated Protein-1α
Bouvard, D., Vignoud, L., Manet, S., Abed, N., Fournier, H.-N., Vincent-Monégat, C., Retta, S. F., Fässler, R., & Block, M. R. (2003) · Journal of Biological Chemistry · doi:10.1074/jbc.m211258200 · Cited by 95
Self-citationMechanism for KRIT1 Release of ICAP1-Mediated Suppression of Integrin Activation
Liu, W., Draheim, K., Zhang, R., Calderwood, D., & Boggon, T. J. (2013) · Molecular Cell · doi:10.1016/j.molcel.2012.12.005 · Cited by 90
Yadla, S., Jabbour, P. M., Shenkar, R., Shi, C., Campbell, P. G., & Awad, I. A. (2010) · Neurosurgical FOCUS · doi:10.3171/2010.5.focus10121 · Cited by 85
Béraud-Dufour, S., Gautier, R., Albigès‐Rizo, C., Chardin, P., & Faurobert, E. (2007) · FEBS Journal · doi:10.1111/j.1742-4658.2007.06068.x · Cited by 83
Self-citationKhan, M. M., Gandhi, C., Chauhan, N., Stevens, J. W., Motto, D. G., Lentz, S. R., & Chauhan, A. K. (2012) · Stroke · doi:10.1161/strokeaha.111.635516 · Cited by 73
Spatial segregation between cell–cell and cell–matrix adhesions
Burute, M., & Théry, M. (2012) · Current Opinion in Cell Biology · doi:10.1016/j.ceb.2012.07.003 · Cited by 68
Integrin Cytoplasmic Domain–Associated Protein-1 Attenuates Sprouting Angiogenesis
Brütsch, R., Liebler, S. S., Wüstehube‐Lausch, J., Bartol, A., Herberich, S. E., Adam, M., Telzerow, A., Augustin, H. G., & Fischer, A. (2010) · Circulation Research · doi:10.1161/circresaha.110.217257 · Cited by 68
Defective osteoblast function in ICAP-1-deficient mice
Bouvard, D., Aszódi, A., Kostka, G., Block, M. R., Albigès‐Rizo, C., & Fässler, R. (2007) · Development · doi:10.1242/dev.000877 · Cited by 67
Self-citationRecipient‐derived EDA fibronectin promotes cardiac allograft fibrosis
Booth, A. J., Wood, S. C., Cornett, A. M., Dreffs, A. A., Lu, G., Muro, A. F., White, E. S., & Bishop, D. K. (2011) · The Journal of Pathology · doi:10.1002/path.3010 · Cited by 55
KRIT1 MODULATES β1-INTEGRIN-MEDIATED ENDOTHELIAL CELL PROLIFERATION
Zhang, J., Basu, S., Rigamonti, D., Dietz, H. C., & Clatterbuck, R. E. (2008) · Neurosurgery · doi:10.1227/01.neu.0000325255.30268.b0 · Cited by 51
Recent insights into cerebral cavernous malformations: animal models of CCM and the human phenotype
Chan, A. C., Li, D. Y., Berg, M. J., & Whitehead, K. J. (2010) · FEBS Journal · doi:10.1111/j.1742-4658.2009.07536.x · Cited by 48
The role of extracellular matrix in vascular branching morphogenesis
Mettouchi, A. (2012) · Cell Adhesion & Migration · doi:10.4161/cam.22862 · Cited by 42
Cunningham, K., Uchida, Y., O'Donnell, E., Claudio, E., Li, W., Soneji, K., Wang, H., Mukouyama, Y., & Siebenlist, U. K. (2011) · Human Molecular Genetics · doi:10.1093/hmg/ddr225 · Cited by 39
Unraveling ICAP-1 function: Toward a new direction?
Bouvard, D., Millon‐Frémillon, A., Manet, S., Block, M. R., & Albigès‐Rizo, C. (2005) · European Journal of Cell Biology · doi:10.1016/j.ejcb.2005.10.005 · Cited by 23
Self-citationModern induced skull deformity in adults
Gump, W. C. (2010) · Neurosurgical FOCUS · doi:10.3171/2010.10.focus10203 · Cited by 20
Cited by
Sorted by citations
Endothelial fluid shear stress sensing in vascular health and disease
Baeyens, N., Bandyopadhyay, C., Coon, B. G., Yun, S., & Schwartz, M. A. (2016) · Journal of Clinical Investigation · doi:10.1172/jci83083 · Cited by 592
Endothelial destabilization by angiopoietin-2 via integrin β1 activation
Hakanpaa, L., Sipila, T., Leppanen, V.-M., Gautam, P., Nurmi, H., Jacquemet, G., Eklund, L., Ivaska, J., Alitalo, K., & Saharinen, P. (2015) · Nature Communications · doi:10.1038/ncomms6962 · Cited by 287
Genetic Basis and Therapies for Vascular Anomalies
Queisser, A., Seront, E., Boon, L. M., & Vikkula, M. (2021) · Circulation Research · doi:10.1161/circresaha.121.318145 · Cited by 237
Integrins in cancer: Emerging mechanisms and therapeutic opportunities
Liu, F., Wu, Q., Dong, Z., & Liu, K. (2023) · Pharmacology & Therapeutics · doi:10.1016/j.pharmthera.2023.108458 · Cited by 202
KLF4 is a key determinant in the development and progression of cerebral cavernous malformations
Cuttano, R., Rudini, N., Bravi, L., Corada, M., Giampietro, C., Papa, E., Morini, M. F., Maddaluno, L., Baeyens, N., Adams, R. H., et al. (2015) · EMBO Molecular Medicine · doi:10.15252/emmm.201505433 · Cited by 188
Metadata
- Authors
- Faurobert, E., Rome, C., Lisowska, J., Manet-Dupé, S., Boulday, G., Malbouyres, M., Balland, M., Bouin, A.-P., Kéramidas, M., Bouvard, D., Coll, J.-L., Ruggiero, F., Tournier-Lasserve, E., & Albiges-Rizo, C.
- Affiliations
- Centre National de la Recherche Scientifique (FR)
- Inserm (FR)
- INSERM U823, Institut Albert Bonniot, Grenoble F-38042, France 1
- École Normale Supérieure de Lyon (FR)
- INSERM, UMR-S 740, Université Paris Diderot, Paris F-75010, France 4
- Corresponding author
- Faurobert, Eva
- ORCID
- Venue
- Journal of Cell Biology
- Publisher
- Rockefeller University Press
- Published
- 2013-08-05
- Volume
- 202
- Issue
- 3
- Pages
- 545-561
- ISSN
- 0021-9525 (ISSN-L)
- 1540-8140
- PMC
- PMC3734079
- OpenAlex
- W2117038928
- Cited by
- 114
- References
- 83
- Citations by year
- 2026: 9 · 2025: 3 · 2024: 12 · 2023: 8 · 2022: 9 · 2021: 6 · 2020: 15 · 2019: 4 · 2018: 8 · 2017: 5 · 2016: 7 · 2015: 10 · 2014: 15 · 2013: 3
- FWCI
- 7.40
- Type
- journal article
- Language
- en
- Open access
- bronze
- doi.org
- Locations
- The Journal of Cell Biology (publishedVersion)
- Europe PMC (PubMed Central) (publishedVersion, cc-by-nc-sa)
- PubMed Central (publishedVersion, cc-by-nc-sa)
- PubMed (publishedVersion)
- HAL (submittedVersion)
- Funders
- Institut National de la Santé et de la Recherche Médicale
- Ligue Contre le Cancer
- Centre National de la Recherche Scientifique
- Topics
- Health Sciences › Medicine › Clinical Neurology › Vascular Malformations Diagnosis and Treatment
- Life Sciences › Neuroscience › Neurology › Barrier Structure and Function Studies
- Health Sciences › Medicine › Immunology and Allergy › Cell Adhesion Molecules Research
- Keywords
- CCM1, CCM2, beta1 integrin, endothelial contractility, RhoA signaling, extracellular matrix remodeling, fibronectin, cerebral cavernous malformations, endothelial barrier function, intercellular junctions, vascular stability
- MeSH terms
- KRIT1 Protein, Animals, Cell Adhesion, Cells, Cultured, Fibronectins, Humans, Mice, Inbred Strains, Microtubule-Associated Proteins, Models, Biological, Proto-Oncogene Proteins, Mice, Knockout, Integrin beta1, Intracellular Signaling Peptides and Proteins, Mice, Human Umbilical Vein Endothelial Cells
About these checks
Registry, retraction, Cites and statistics results are computed, not judged, with one exception: a printed reference that no index lists is read once by a model before it counts as a citation error. Claims are extracted by a model and kept only when their quote appears verbatim in the text; each cited source is then checked, with a model’s help, for whether it says what the claim relies on. Those verdicts can be wrong — read the claim’s quote and the cited source before relying on one.
Statistics and arithmetic are recomputed, not judged.
Confidence bands are shown only for fields calibrated on our annotated test set. None is calibrated yet, so no band is shown.
What counts as a claim ›How we measure confidence ›How we check this ›
Are you an author, or do you see a problem with this page? Request a review
