Cited by 330Amyotrophic Lateral Sclerosis ResearchAlzheimer's disease research and treatmentsPrion Diseases and Protein Misfolding

The DOI matches its Crossref record; 48 of the 48 references it cites were found in a registry or an index.

TDP-43 is intercellularly transmitted across axon terminals

Open access

Abstract

Transactive response DNA-binding protein 43 kD (TDP-43) is an aggregation-prone prion-like domain-containing protein and component of pathological intracellular aggregates found in most amyotrophic lateral sclerosis (ALS) patients. TDP-43 oligomers have been postulated to be released and subsequently nucleate TDP-43 oligomerization in recipient cells, which might be the molecular correlate of the systematic symptom spreading observed during ALS progression. We developed a novel protein complementation assay allowing quantification of TDP-43 oligomers in living cells. We demonstrate the exchange of TDP-43 between cell somata and the presence of TDP-43 oligomers in microvesicles/exosomes and show that microvesicular TDP-43 is preferentially taken up by recipient cells where it exerts higher toxicity than free TDP-43. Moreover, studies using microfluidic neuronal cultures suggest both anterograde and retrograde trans-synaptic spreading of TDP-43. Finally, we demonstrate TDP-43 oligomer seeding by TDP-43–containing material derived from both cultured cells and ALS patient brain lysate. Thus, using an innovative detection technique, we provide evidence for preferentially microvesicular uptake as well as both soma-to-soma “horizontal” and bidirectional “vertical” synaptic intercellular transmission and prion-like seeding of TDP-43.

Overview

The claims and statistics of this paper haven’t been checked yet.

Run the check — free, no account needed. It reads the open-access text and checks the sources it cites.

A few free checks a day · papers already verified open instantly · results are public

Integrity signals

Registry

Crossref · 10.1083/jcb.201504057

Cites

48 of 48 references verified0 citation errors · 0 not checkable

Statistics

Figures

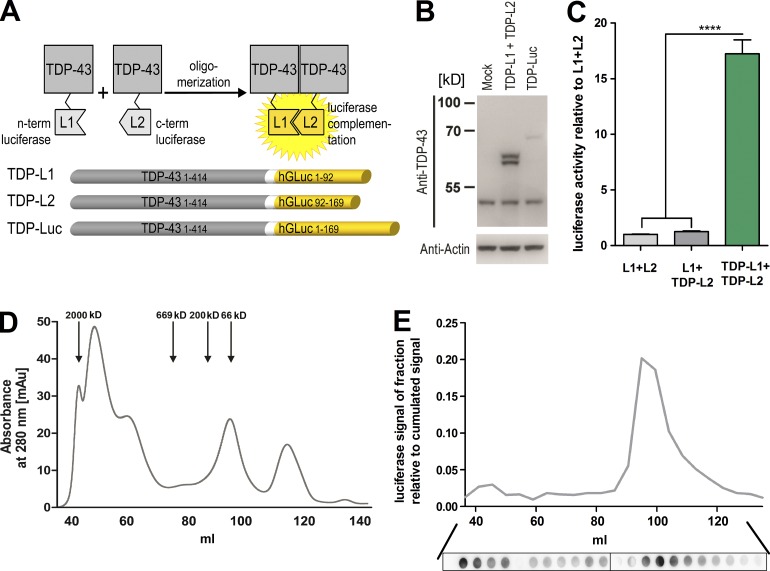
Figure 1. Quantitative detection of TDP-43 oligomers in living cells using a protein complementation approach. (A) TDP-43 split luciferase assay principle: oligomerization of TDP-43 monomers fused to nonbioluminescent G. princeps luciferase halves (L1 and L2) restores luciferase complementation, which can be quantified. (B) Western blot analysis of TDP-L1 and -L2 coexpression or TDP-Luc expression in HEK-293 cell lysates 48 h after transfection. (C) Luciferase activity measurement in living HEK-293 cells 72 h after cotransfection of either L1 + L2, L1 + TDP-L2, or TDP-L1 + TDP-L2. n = 10 per group. Mean ± SEM. ****, P < 0.0001. (D) SEC of cell lysates derived from TDP-L1 + TDP-L2–transfected HEK-293 cells. The molecular size standard proteins used were blue dextran (2,000 kD), thyroglobulin (669 kD), β-amylase (200 kD), and BSA (66 kD). (E) Luciferase activity measurement (top) and TDP-43–specific dot blot analysis (bottom) of the same SEC fractions shown in D. The data shown in D and E represent single SEC runs representative for at least three independent repeats.
Figure 1. Quantitative detection of TDP-43 oligomers in living cells using a protein complementation approach. (A) TDP-43 split luciferase assay principle: oligomerization of TDP-43 monomers fused to nonbioluminescent G. princeps luciferase halves (L1 and L2) restores luciferase complementation, which can be quantified. (B) Western blot analysis of TDP-L1 and -L2 coexpression or TDP-Luc expression in HEK-293 cell lysates 48 h after transfection. (C) Luciferase activity measurement in living HEK-293 cells 72 h after cotransfection of either L1 + L2, L1 + TDP-L2, or TDP-L1 + TDP-L2. n = 10 per group. Mean ± SEM. ****, P < 0.0001. (D) SEC of cell lysates derived from TDP-L1 + TDP-L2–transfected HEK-293 cells. The molecular size standard proteins used were blue dextran (2,000 kD), thyroglobulin (669 kD), β-amylase (200 kD), and BSA (66 kD). (E) Luciferase activity measurement (top) and TDP-43–specific dot blot analysis (bottom) of the same SEC fractions shown in D. The data shown in D and E represent single SEC runs representative for at least three independent repeats.CC BY-NC-SA · PubMed Central
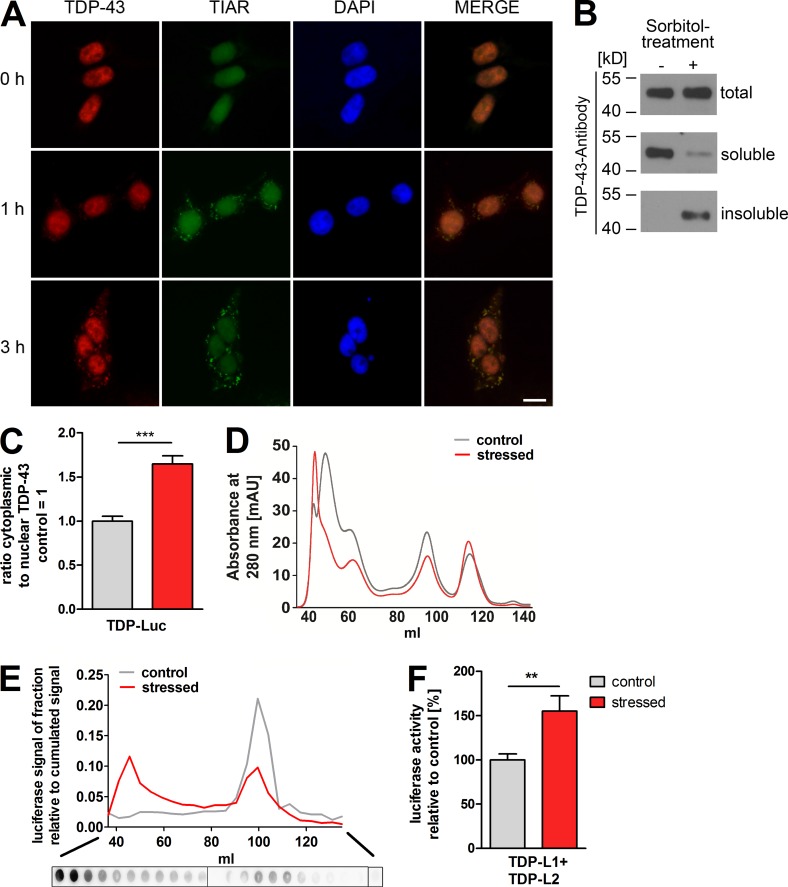
Figure 2. Detection of stress-induced TDP-43 oligomerization using the luciferase split assay. (A) Immunofluorescence of endogenous TDP-43 after 400-mM sorbitol treatment in HEK-293 cells at various time points. Stress granules were stained by coimmunolabeling with a TIAR antibody, and nuclei were stained using DAPI. After 1 h of sorbitol treatment, nucleocytoplasmic redistribution of TDP-43 and accumulation in stress granules is observed. Bar, 10 µm. (B) Sorbitol treatment induces the formation of insoluble TDP-43 as assessed by immunoblotting of soluble and insoluble cell lysate fractions. (C) Luciferase activity measurement of nuclear/cytoplasmic fractions of TDP-Luc–transfected HEK-293 cells after 1 h of sorbitol-induced stress. n = 11 per group. (D) SEC of cell lysates derived from TDP-L1 + TDP-L2–transfected HEK-293 cells after sorbitol-induced stress. Absorbance at 280 nm shows the size distribution of the total protein content. (E) Luciferase activity measurement (top) and TDP-43–specific dot blot analysis (bottom) in the SEC fractions of stressed HEK-293 cells in D. (F) Total luciferase activity measurement in living HEK-293 cells expressing TDP-L1 and TDP-L2 with or without sorbitol stress. n = 20 per group. Mean ± SEM. **, P < 0.01; ***, P < 0.001. The data shown in D and E represent single SEC runs representative for at least three independent repeats. mAU, milli absorbance units.
Figure 2. Detection of stress-induced TDP-43 oligomerization using the luciferase split assay. (A) Immunofluorescence of endogenous TDP-43 after 400-mM sorbitol treatment in HEK-293 cells at various time points. Stress granules were stained by coimmunolabeling with a TIAR antibody, and nuclei were stained using DAPI. After 1 h of sorbitol treatment, nucleocytoplasmic redistribution of TDP-43 and accumulation in stress granules is observed. Bar, 10 µm. (B) Sorbitol treatment induces the formation of insoluble TDP-43 as assessed by immunoblotting of soluble and insoluble cell lysate fractions. (C) Luciferase activity measurement of nuclear/cytoplasmic fractions of TDP-Luc–transfected HEK-293 cells after 1 h of sorbitol-induced stress. n = 11 per group. (D) SEC of cell lysates derived from TDP-L1 + TDP-L2–transfected HEK-293 cells after sorbitol-induced stress. Absorbance at 280 nm shows the size distribution of the total protein content. (E) Luciferase activity measurement (top) and TDP-43–specific dot blot analysis (bottom) in the SEC fractions of stressed HEK-293 cells in D. (F) Total luciferase activity measurement in living HEK-293 cells expressing TDP-L1 and TDP-L2 with or without sorbitol stress. n = 20 per group. Mean ± SEM. **, P < 0.01; ***, P < 0.001. The data shown in D and E represent single SEC runs representative for at least three independent repeats. mAU, milli absorbance units.CC BY-NC-SA · PubMed Central
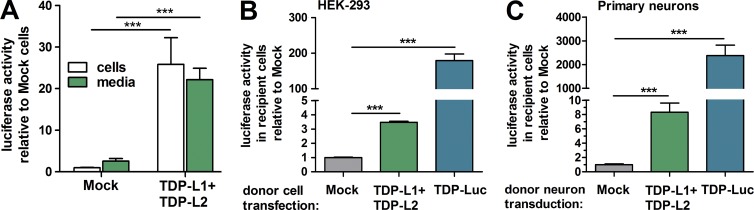
Figure 3. Intercellular transmission of TDP-43 oligomers. (A) Luciferase activity measurement of intact cells and CM from HEK-293 cells cotransfected with TDP-L1 + TDP-L2. n = 20. (B) Luciferase activity measurements after extensive washing of naive HEK-293 cells cultured for 72 h in CM. CM was obtained from HEK-293 cells transfected either with mock, TDP-L1 + TDP-L2, or TDP-Luc. n = 4 per group. (C) Luciferase activity measurements of naive primary cortical mouse neurons cultured for 72 h in CM. CM was obtained from primary neurons transduced with rAAV6.2 encoding TDP-L1 + TDP-L2 or TDP-Luc. n = 12 per group. Mean ± SEM. ***, P < 0.001.
Figure 3. Intercellular transmission of TDP-43 oligomers. (A) Luciferase activity measurement of intact cells and CM from HEK-293 cells cotransfected with TDP-L1 + TDP-L2. n = 20. (B) Luciferase activity measurements after extensive washing of naive HEK-293 cells cultured for 72 h in CM. CM was obtained from HEK-293 cells transfected either with mock, TDP-L1 + TDP-L2, or TDP-Luc. n = 4 per group. (C) Luciferase activity measurements of naive primary cortical mouse neurons cultured for 72 h in CM. CM was obtained from primary neurons transduced with rAAV6.2 encoding TDP-L1 + TDP-L2 or TDP-Luc. n = 12 per group. Mean ± SEM. ***, P < 0.001.CC BY-NC-SA · PubMed Central
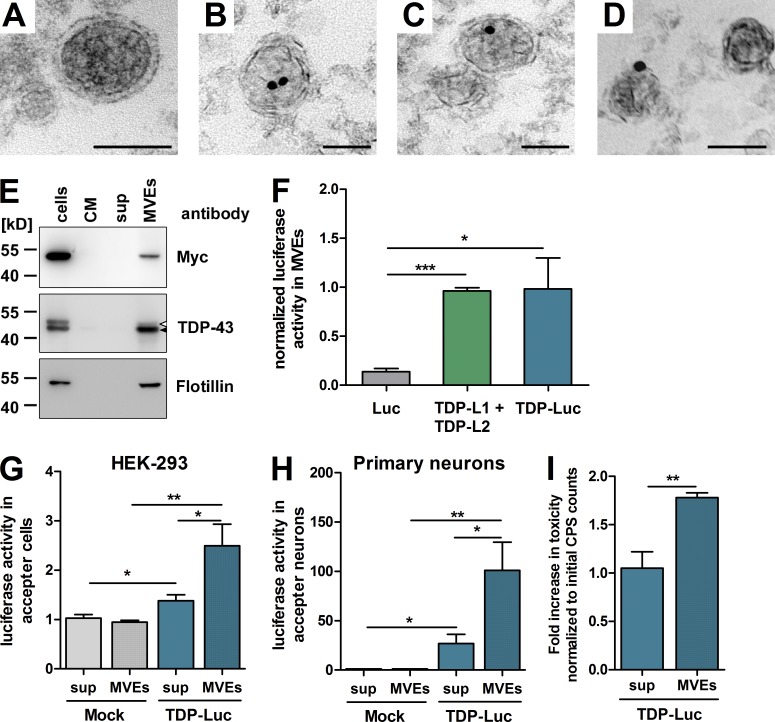
Figure 4. Preferential uptake and higher toxicity of microvesicular/exosomal TDP-43. (A) TEM pictures of ultrathin sections of MVEs. A representative micrograph of intact vesicles with a bilayered lipid membrane is shown. (B–D) Anti–TDP-43 immunogold labeling was performed on ultrathin sections of MVEs (10-nm gold particles). Intraluminal (B and C) and membrane-associated (D) TDP-43 is shown. Bars, 50 nm. (E) Immunoblotting of HEK-293 cells transfected with myc–TDP-43 and their corresponding CM MVE-free supernatant after ultracentrifugation (sup) and MVEs. Overexpressed myc–TDP-43 was detected using a Myc antibody, and endogenous TDP-43 was detected in MVEs using a TDP-43 antibody. Flotillin was used as an MVE marker. The closed arrowhead indicates endogenous TDP-43, and the open arrowhead indicates myc–TDP-43. (F) MVEs were prepared from HEK-293 cells expressing either full-length luciferase alone (Luc), TDP-L1 + TDP-L2, or TDP-43 fused to full-length luciferase (TDP-Luc). Luciferase activity of MVE fractions was normalized to the activity measured in the respective host cells. n = 12 per group. (G and H) MVE fractions (MVEs) and MVE-free supernatants (sup) from HEK-293 cells transfected with control vector (Mock) or TDP-Luc were applied to naive HEK-293 cells (G) or primary neurons (H) and incubated for 3 d. Uptake of TDP-Luc was detected by luciferase activity measurement. n = 14. (I) Caspase-3/7 toxicity assay of naive primary neurons treated with MVE fraction (MVEs) or MVE-free supernatant (sup) containing TDP-Luc. n = 9 per group. Mean ± SEM. *, P < 0.05; **, P < 0.01; ***, P < 0.001. CPS, counts per second.
Figure 4. Preferential uptake and higher toxicity of microvesicular/exosomal TDP-43. (A) TEM pictures of ultrathin sections of MVEs. A representative micrograph of intact vesicles with a bilayered lipid membrane is shown. (B–D) Anti–TDP-43 immunogold labeling was performed on ultrathin sections of MVEs (10-nm gold particles). Intraluminal (B and C) and membrane-associated (D) TDP-43 is shown. Bars, 50 nm. (E) Immunoblotting of HEK-293 cells transfected with myc–TDP-43 and their corresponding CM MVE-free supernatant after ultracentrifugation (sup) and MVEs. Overexpressed myc–TDP-43 was detected using a Myc antibody, and endogenous TDP-43 was detected in MVEs using a TDP-43 antibody. Flotillin was used as an MVE marker. The closed arrowhead indicates endogenous TDP-43, and the open arrowhead indicates myc–TDP-43. (F) MVEs were prepared from HEK-293 cells expressing either full-length luciferase alone (Luc), TDP-L1 + TDP-L2, or TDP-43 fused to full-length luciferase (TDP-Luc). Luciferase activity of MVE fractions was normalized to the activity measured in the respective host cells. n = 12 per group. (G and H) MVE fractions (MVEs) and MVE-free supernatants (sup) from HEK-293 cells transfected with control vector (Mock) or TDP-Luc were applied to naive HEK-293 cells (G) or primary neurons (H) and incubated for 3 d. Uptake of TDP-Luc was detected by luciferase activity measurement. n = 14. (I) Caspase-3/7 toxicity assay of naive primary neurons treated with MVE fraction (MVEs) or MVE-free supernatant (sup) containing TDP-Luc. n = 9 per group. Mean ± SEM. *, P < 0.05; **, P < 0.01; ***, P < 0.001. CPS, counts per second.CC BY-NC-SA · PubMed Central
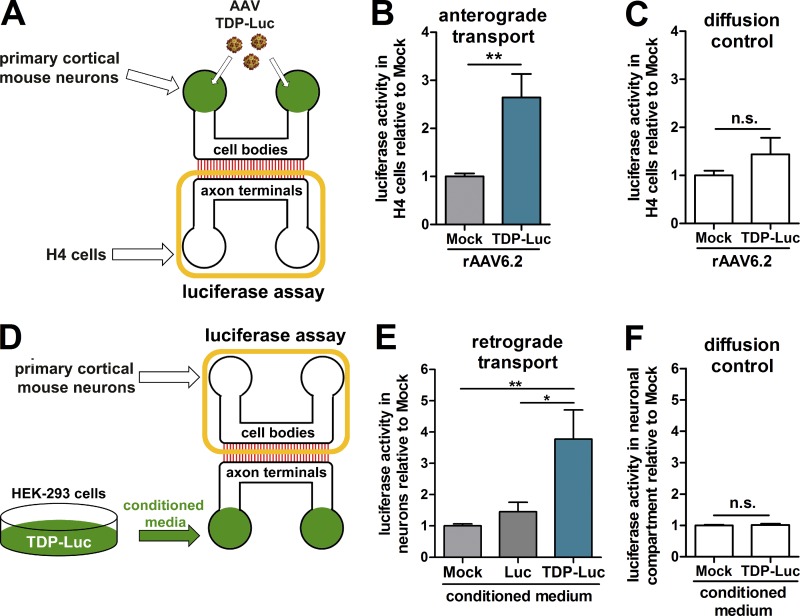
Figure 5. Axonal uptake and transmission of TDP-43. (A) Experimental design of the anterograde transmission experiment. (B) Primary cortical mouse neurons in microfluidic devices (5 DIV) were transduced with rAAV6.2 TDP-Luc. After 24 h, H4 cells were coplated in the axonal terminal compartment. Excess culture medium was added to the axonal compartment during the entire experiment to maintain a positive hydraulic pressure and prevent diffusion of TDP-43 or virus particles. After 5 d of co-culture, H4 cells were harvested, and luciferase activity was detected. (C) The same setup without primary neurons was used as a diffusion control. (D) Experimental design of the axon terminal uptake experiment. (E) CM from HEK-293 cells transfected with mock, Luc, or TDP-Luc were added to the axonal compartment of microfluidic devices containing primary cortical neurons (5 DIV). Excess culture medium was added to the cell body compartment to maintain a positive hydraulic pressure against protein diffusion during the entire experiment. After 5 d, neuron bodies were harvested, and luciferase activity was measured. (F) The same setup without primary neurons was used as a diffusion control. For all experiments, n = 9. Mean ± SEM. *, P < 0.05; **, P < 0.01. Yellow rectangles in A and D indicate compartments from which cell bodies were harvested for luciferase activity measurement in the respective experiment. n.s., not significant.
Figure 5. Axonal uptake and transmission of TDP-43. (A) Experimental design of the anterograde transmission experiment. (B) Primary cortical mouse neurons in microfluidic devices (5 DIV) were transduced with rAAV6.2 TDP-Luc. After 24 h, H4 cells were coplated in the axonal terminal compartment. Excess culture medium was added to the axonal compartment during the entire experiment to maintain a positive hydraulic pressure and prevent diffusion of TDP-43 or virus particles. After 5 d of co-culture, H4 cells were harvested, and luciferase activity was detected. (C) The same setup without primary neurons was used as a diffusion control. (D) Experimental design of the axon terminal uptake experiment. (E) CM from HEK-293 cells transfected with mock, Luc, or TDP-Luc were added to the axonal compartment of microfluidic devices containing primary cortical neurons (5 DIV). Excess culture medium was added to the cell body compartment to maintain a positive hydraulic pressure against protein diffusion during the entire experiment. After 5 d, neuron bodies were harvested, and luciferase activity was measured. (F) The same setup without primary neurons was used as a diffusion control. For all experiments, n = 9. Mean ± SEM. *, P < 0.05; **, P < 0.01. Yellow rectangles in A and D indicate compartments from which cell bodies were harvested for luciferase activity measurement in the respective experiment. n.s., not significant.CC BY-NC-SA · PubMed Central
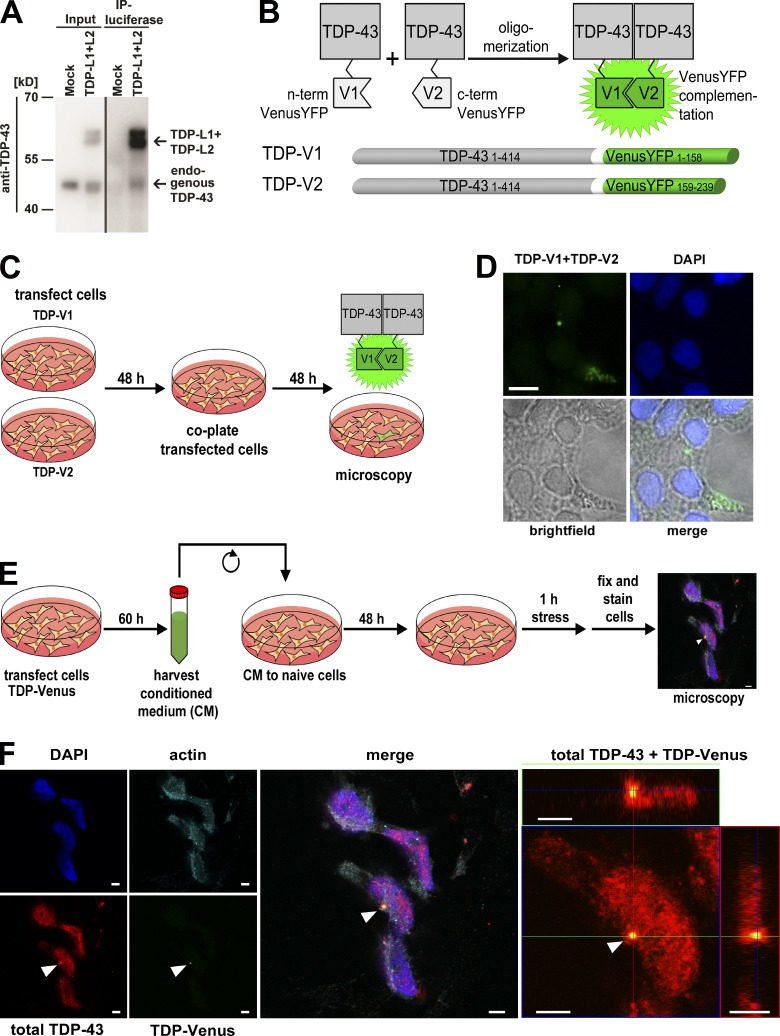
Figure 6. Transmitted and target cell–derived TDP-43 interact and are found in the same cytoplasmic granule. (A) Coimmunoprecipitation of overexpressed TDP-L1 + TDP-L2 and endogenous TDP-43 using a polyclonal luciferase antibody demonstrates that the transfected TDP-L1 and TDP-L2 constructs interact with endogenous TDP-43 in HEK-293. Cell lysate of HEK-293 cells transfected with an empty vector (mock) was used as a negative control. One representative Western blot of three replicates is shown. (B) TDP-43 split VenusYFP assay principle and constructs are shown. Oligomerization of TDP-43 monomers fused to nonfluorescent VenusYFP halves (V1 and V2) restores VenusYFP fluorescence, which is visualized by microscopy. (C) Setup for the co-culture experiment using the VenusYFP split constructs. (D) Fluorescence micrographs of co-culture experiment. After 48 h of co-culturing, HEK-293 cells originally transfected with either TDP-V1 or TDP-V2 VenusYFP-positive cells were detected. Cell nuclei were stained with DAPI. Bar, 10 µm. (E) Setup for uptake experiment using TDP full-length Venus (TDP-Venus), followed by sorbitol stress (400 mM for 1 h) and immunostaining for TDP-43. The arrowhead indicates an aggregate. Bar, 5 µm. (F) Representative micrograph of a cell that took up TDP-Venus (green) from CM. After stressing the cell with sorbitol, total TDP-43 (red) and α–smooth muscle actin (cyan) were immunolabeled, and nuclei were stained with DAPI. Arrowheads indicate an aggregate with a core containing TDP-Venus (green; labeled also by the total TDP-43 immunostaining in red) surrounded by a solely red immunostaining signal, indicating endogenously expressed, untagged TDP-43. (Right) Orthogonal projections of confocal z stacks of the aggregate-containing cell. Bars, 5 µm. IP, immunoprecipitation.
Figure 6. Transmitted and target cell–derived TDP-43 interact and are found in the same cytoplasmic granule. (A) Coimmunoprecipitation of overexpressed TDP-L1 + TDP-L2 and endogenous TDP-43 using a polyclonal luciferase antibody demonstrates that the transfected TDP-L1 and TDP-L2 constructs interact with endogenous TDP-43 in HEK-293. Cell lysate of HEK-293 cells transfected with an empty vector (mock) was used as a negative control. One representative Western blot of three replicates is shown. (B) TDP-43 split VenusYFP assay principle and constructs are shown. Oligomerization of TDP-43 monomers fused to nonfluorescent VenusYFP halves (V1 and V2) restores VenusYFP fluorescence, which is visualized by microscopy. (C) Setup for the co-culture experiment using the VenusYFP split constructs. (D) Fluorescence micrographs of co-culture experiment. After 48 h of co-culturing, HEK-293 cells originally transfected with either TDP-V1 or TDP-V2 VenusYFP-positive cells were detected. Cell nuclei were stained with DAPI. Bar, 10 µm. (E) Setup for uptake experiment using TDP full-length Venus (TDP-Venus), followed by sorbitol stress (400 mM for 1 h) and immunostaining for TDP-43. The arrowhead indicates an aggregate. Bar, 5 µm. (F) Representative micrograph of a cell that took up TDP-Venus (green) from CM. After stressing the cell with sorbitol, total TDP-43 (red) and α–smooth muscle actin (cyan) were immunolabeled, and nuclei were stained with DAPI. Arrowheads indicate an aggregate with a core containing TDP-Venus (green; labeled also by the total TDP-43 immunostaining in red) surrounded by a solely red immunostaining signal, indicating endogenously expressed, untagged TDP-43. (Right) Orthogonal projections of confocal z stacks of the aggregate-containing cell. Bars, 5 µm. IP, immunoprecipitation.CC BY-NC-SA · PubMed Central
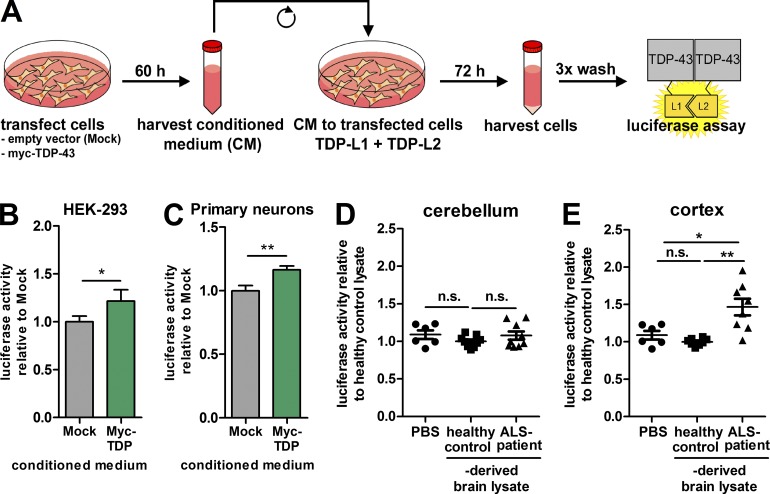
Figure 7. TDP-43 oligomer seeding in recipient cells induced by cell culture material and ALS patient–derived CNS lysates. (A) Setup for seeding experiments with CM. (B and C) Luciferase activity measurement 3 d after CM from HEK-293 cells transfected with mock or myc-TDP was added to either HEK-293 cells cotransfected with TDP-L1 + TDP-L2 (B) or primary mouse neurons cotransduced with rAAV6.2 encoding TDP-L1 and TDP-L2 (C). n = 14 and n = 27, respectively. (D and E) Luciferase activity measurement of mouse primary neurons cotransduced with rAAV6.2 encoding TDP-L1 and TDP-L2 after 4.5 h of treatment with postmortem cerebellar (n = 9 different patients and controls) or cortical (n = 8 different patients and controls) lysates, respectively. Mean ± SEM. *, P < 0.05; **, P < 0.01. n.s., not significant.
Figure 7. TDP-43 oligomer seeding in recipient cells induced by cell culture material and ALS patient–derived CNS lysates. (A) Setup for seeding experiments with CM. (B and C) Luciferase activity measurement 3 d after CM from HEK-293 cells transfected with mock or myc-TDP was added to either HEK-293 cells cotransfected with TDP-L1 + TDP-L2 (B) or primary mouse neurons cotransduced with rAAV6.2 encoding TDP-L1 and TDP-L2 (C). n = 14 and n = 27, respectively. (D and E) Luciferase activity measurement of mouse primary neurons cotransduced with rAAV6.2 encoding TDP-L1 and TDP-L2 after 4.5 h of treatment with postmortem cerebellar (n = 9 different patients and controls) or cortical (n = 8 different patients and controls) lysates, respectively. Mean ± SEM. *, P < 0.05; **, P < 0.01. n.s., not significant.CC BY-NC-SA · PubMed Central

Verification

Claims the paper makes

The claims and statistics of this paper haven’t been checked yet.

Run the check — free, no account needed. It reads the open-access text and checks the sources it cites.

A few free checks a day · papers already verified open instantly · results are public

Claims other papers make about this one

Each is checked against this paper’s own text: does it say what the citing paper says it does?

Self-check

Percentages, sums and reported differences re-computed from the paper’s own numbers.

The self-check needs the paper’s full text.

Citations

Cites

Show all 48 references

Research works printed but not linked: 1

  1. Charcot, 1874, Amyotrophies spinales deuteropathiques sclérose latérale amyotrophique & sclérose latérale amyotrophique, Bureaux du Progrès Médical., 2, 234

Cited by

Sorted by citations

See all 330

Metadata

Authors
Feiler, M. S., Strobel, B., Freischmidt, A., Helferich, A. M., Kappel, J., Brewer, B. M., Li, D., Thal, D. R., Walther, P., Ludolph, A. C., Danzer, K. M., & Weishaupt, J. H.
Affiliations
  • Universität Ulm (DE)
  • Boehringer Ingelheim (Germany) (DE)
  • Vanderbilt University (US)
Corresponding author
Weishaupt, Jochen H.
Venue
Journal of Cell Biology
Published
2015-11-23
Volume
211
Issue
4
Pages
897-911
ISSN
  • 0021-9525 (ISSN-L)
  • 1540-8140
OpenAlex
W2174491776
Cited by
329
References
48
Citations by year
2026: 16 · 2025: 35 · 2024: 22 · 2023: 31 · 2022: 33 · 2021: 39 · 2020: 35 · 2019: 30 · 2018: 29 · 2017: 28 · 2016: 30 · 2015: 1
FWCI
20.68
Type
journal article
Language
en
Open access
Licence
cc-by-nc-sa
Locations
  • The Journal of Cell Biology (publishedVersion, cc-by-nc-sa)
  • Europe PMC (PubMed Central) (publishedVersion, cc-by-nc-sa)
  • PubMed Central (publishedVersion, cc-by-nc-sa)
  • PubMed (publishedVersion)
  • Lirias (submittedVersion, other-oa)
Topics
  • Health Sciences › Medicine › Clinical Neurology › Amyotrophic Lateral Sclerosis Research
  • Life Sciences › Neuroscience › Cellular and Molecular Neuroscience › Alzheimer's disease research and treatments
  • Life Sciences › Biochemistry, Genetics and Molecular Biology › Molecular Biology › Prion Diseases and Protein Misfolding
Keywords
TDP-43, amyotrophic lateral sclerosis, intercellular protein transfer, prion-like seeding, microvesicles, exosomes, axon terminals, protein complementation assay, oligomerization, neurodegeneration
MeSH terms
Amyotrophic Lateral Sclerosis, Animals, DNA-Binding Proteins, Humans, Mice, Inbred C57BL, Synaptic Transmission, Neurons, Protein Transport, Exosomes, Protein Multimerization, HEK293 Cells

About these checks

Registry, retraction, Cites and statistics results are computed, not judged, with one exception: a printed reference that no index lists is read once by a model before it counts as a citation error. Claims are extracted by a model and kept only when their quote appears verbatim in the text; each cited source is then checked, with a model’s help, for whether it says what the claim relies on. Those verdicts can be wrong — read the claim’s quote and the cited source before relying on one.

Statistics and arithmetic are recomputed, not judged.

Confidence bands are shown only for fields calibrated on our annotated test set. None is calibrated yet, so no band is shown.

What counts as a claim ›How we measure confidence ›How we check this ›

Are you an author, or do you see a problem with this page? Request a review