

The DOI matches its Crossref record; 71 of the 72 references it cites were found in a registry or an index.
Expression of Interleukin 9 in the Lungs of Transgenic Mice Causes Airway Inflammation, Mast Cell Hyperplasia, and Bronchial Hyperresponsiveness
Open accessAbstract
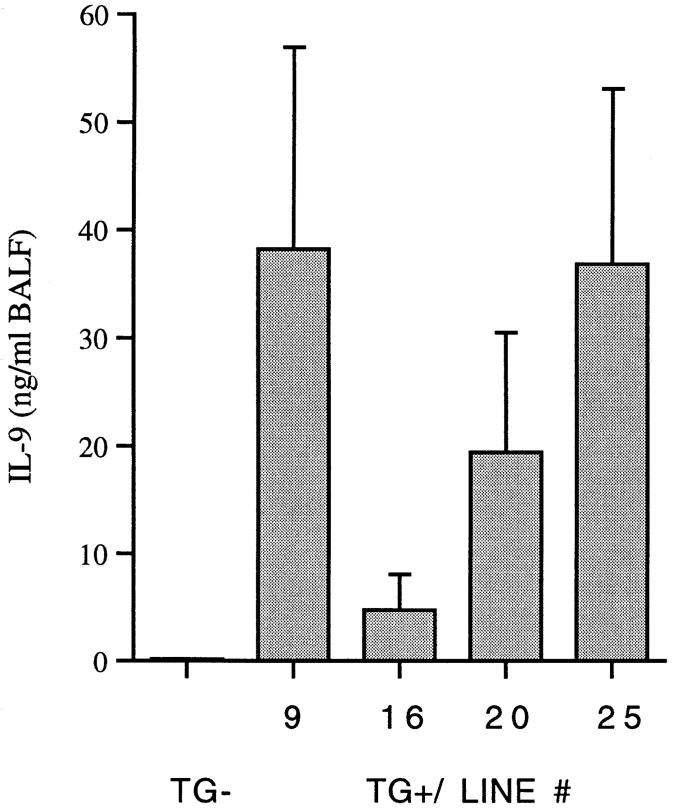
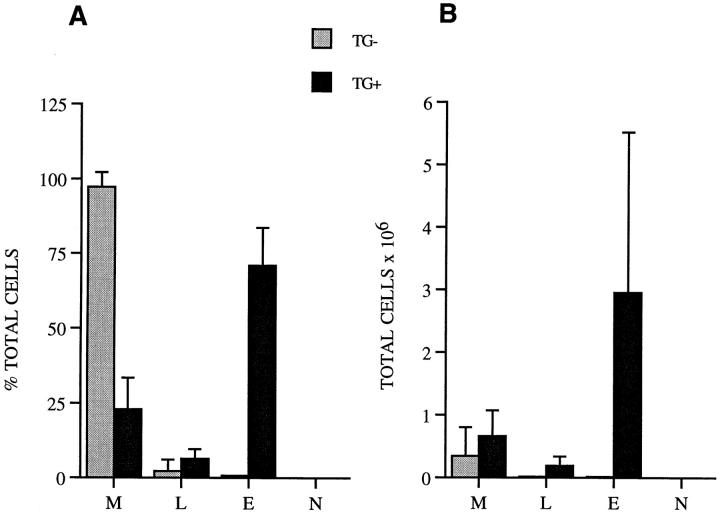
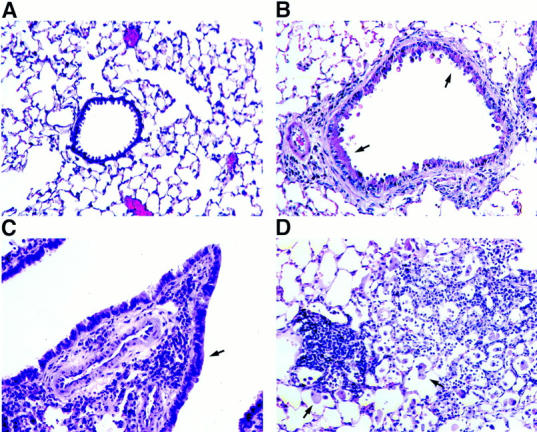
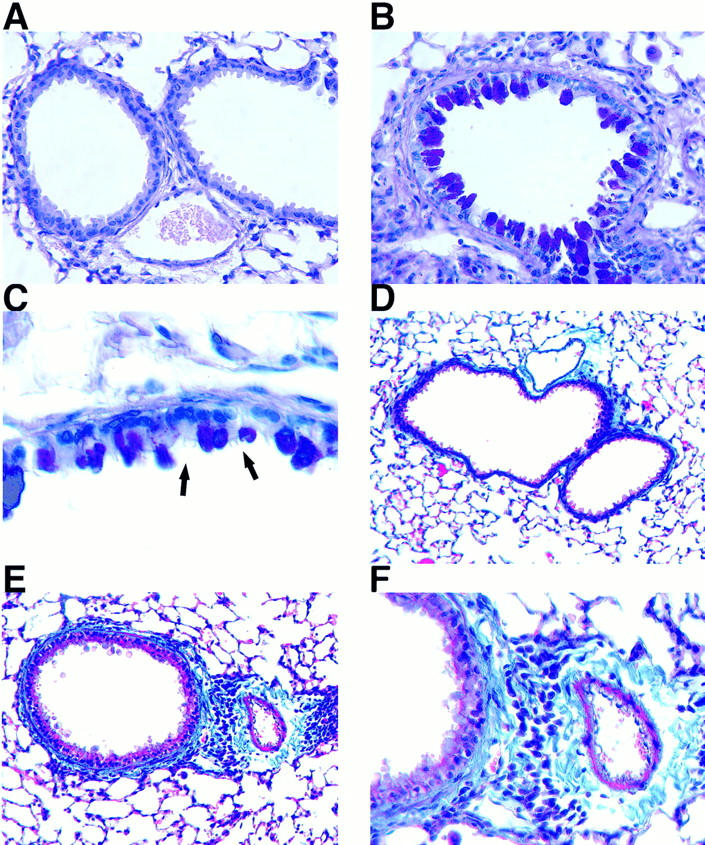
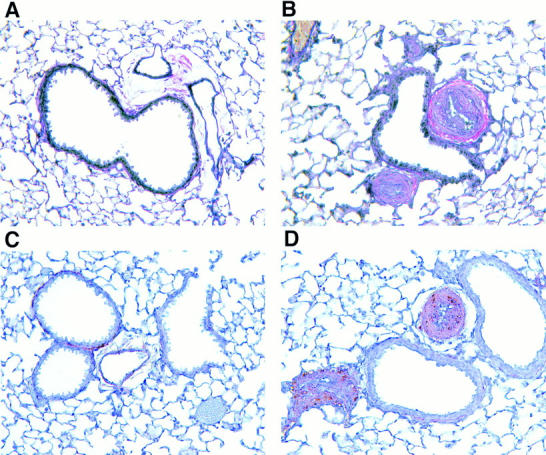
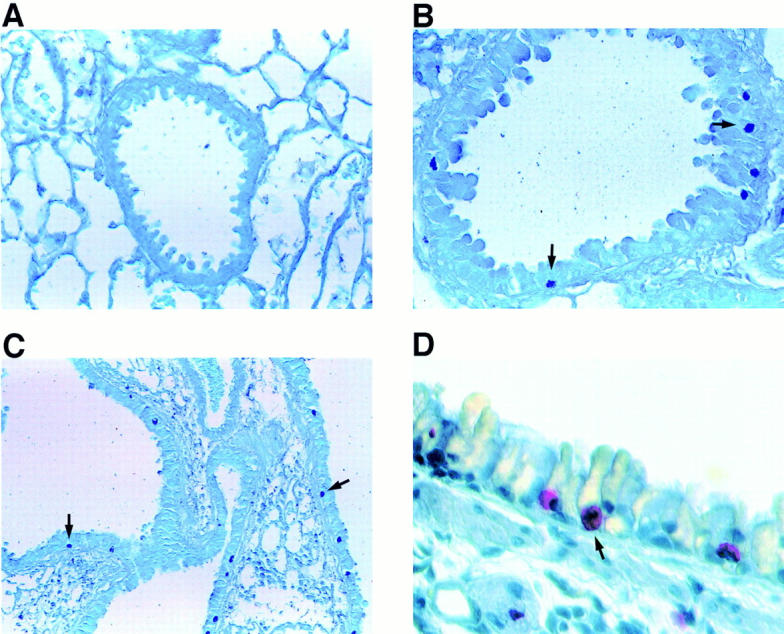
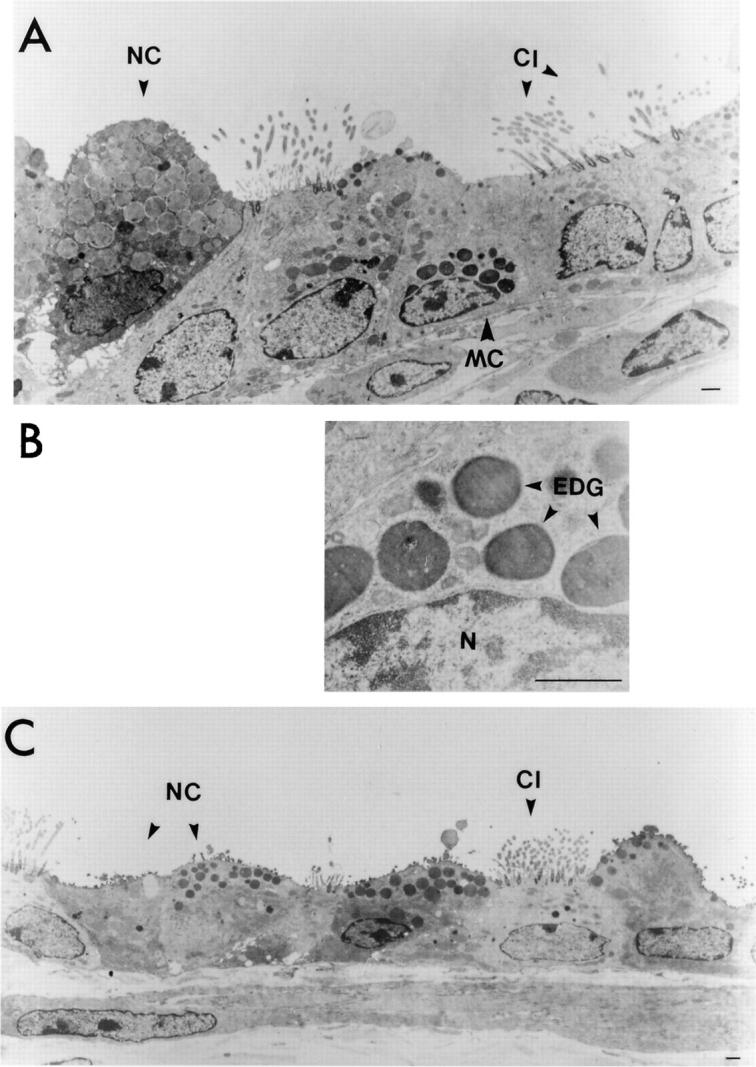
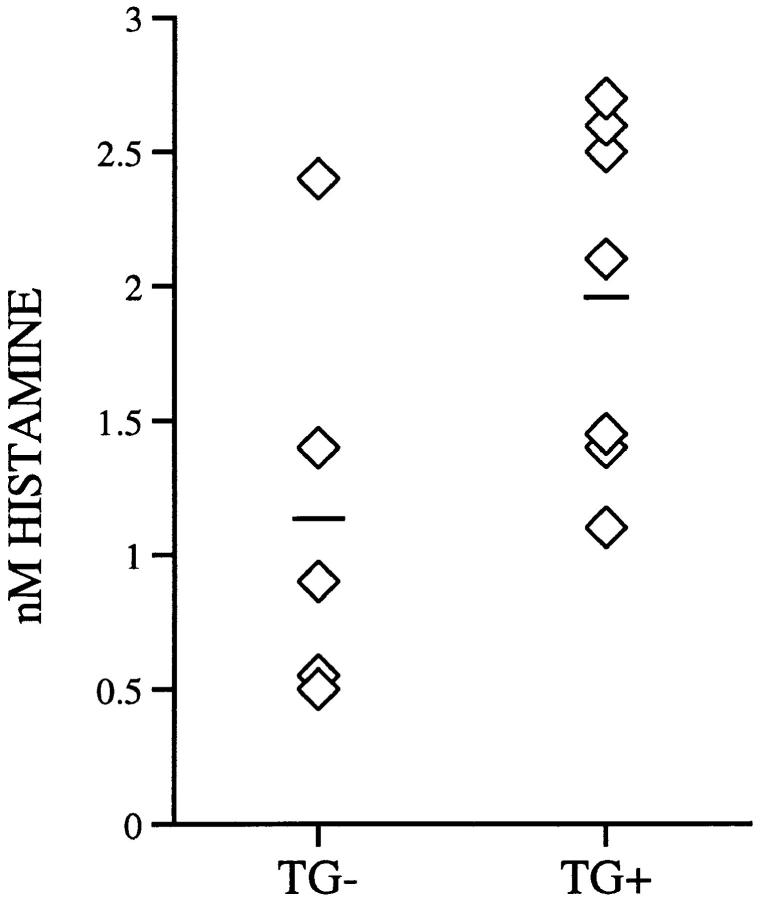
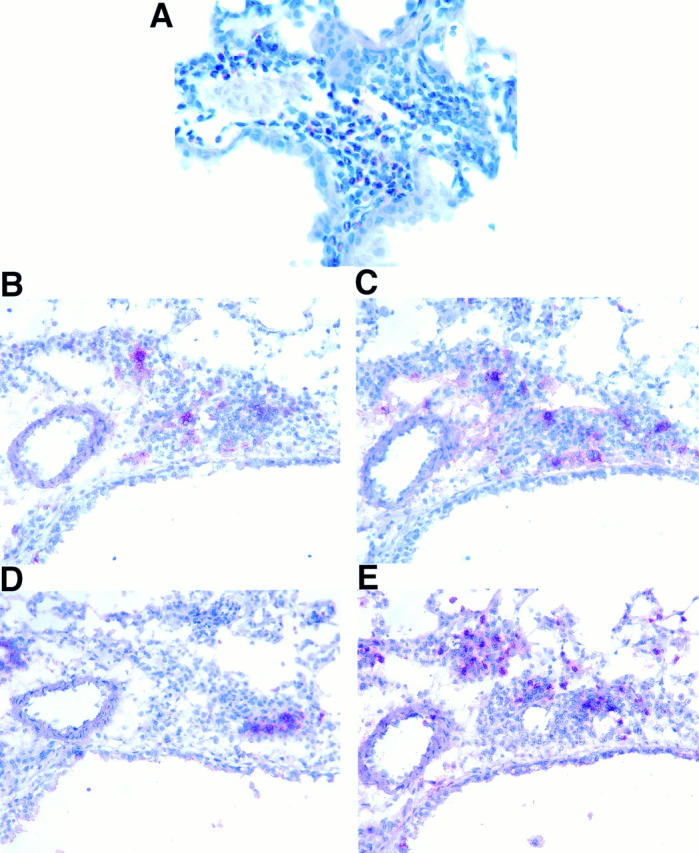
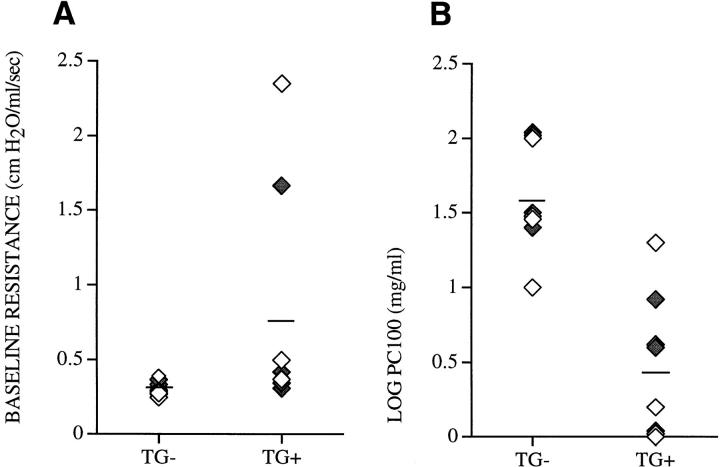
Interleukin (IL)-9, a pleiotropic cytokine produced by the Th2 subset of T lymphocytes has been proposed as product of a candidate gene responsible for asthma. Its wide range of biological functions on many cell types involved in the allergic immune response suggests a potentially important role in the complex pathogenesis of asthma. To investigate the contributions of IL-9 to airway inflammation and airway hyperresponsiveness in vivo, we created transgenic mice in which expression of the murine IL-9 cDNA was regulated by the rat Clara cell 10 protein promoter. Lung selective expression of IL-9 caused massive airway inflammation with eosinophils and lymphocytes as predominant infiltrating cell types. A striking finding was the presence of increased numbers of mast cells within the airway epithelium of IL-9–expressing mice. Other impressive pathologic changes in the airways were epithelial cell hypertrophy associated with accumulation of mucus-like material within nonciliated cells and increased subepithelial deposition of collagen. Physiologic evaluation of IL-9–expressing mice demonstrated normal baseline airway resistance and markedly increased airway hyperresponsiveness to inhaled methacholine. These findings strongly support an important role for IL-9 in the pathogenesis of asthma.
Overview
The claims and statistics of this paper haven’t been checked yet.
Run the check — free, no account needed. It reads the open-access text and checks the sources it cites.
Integrity signals
Registry
Cites
Statistics
Figures
Verification
Claims the paper makes
The claims and statistics of this paper haven’t been checked yet.
Run the check — free, no account needed. It reads the open-access text and checks the sources it cites.
Claims other papers make about this one
Each is checked against this paper’s own text: does it say what the citing paper says it does?
The cited source says what the claim attributes to it.
In the citing paper
“Transgenic expression of Il9 results in allergic inflammation11–13.”
From The transcription factor PU.1 is required for the development of IL-9-producing T cells and allergic inflammation (2010) · cites this paper as [12]
Self-check
Percentages, sums and reported differences re-computed from the paper’s own numbers.
The self-check needs the paper’s full text.
Citations
Cites
Predominant TH2-like Bronchoalveolar T-Lymphocyte Population in Atopic Asthma
Robinson, D. S., Hamid, Q. A., Ying, S., Tsicopoulos, A., Barkans, J. R., Bentley, A. M., Corrigan, C. J., Durham, S. R., & Kay, A. B. (1992) · New England Journal of Medicine · doi:10.1056/nejm199201303260504 · Cited by 2,769
IL‐4 directs the development of Th2‐like helper effectors
Swain, S. L., Weinberg, A. D., English, M., & Huston, G. (1990) · The Journal of Immunology · doi:10.4049/jimmunol.145.11.3796 · Cited by 1,254
Marsh, D. G., Neely, J. D., Breazeale, D. R., Ghosh, B., Freidhoff, L. R., Ehrlich, E., Schou, C., Krishnaswamy, G. A., & Beaty, T. H. (1994) · Science · doi:10.1126/science.8178175 · Cited by 1,003
Recombinant human interleukin 5 is a selective activator of human eosinophil function.
Lopez, A. F., Sanderson, C. J., Gamble, J. R., Campbell, H. D., Young, I., & Vadas, M. A. (1988) · The Journal of Experimental Medicine · doi:10.1084/jem.167.1.219 · Cited by 949
Wardlaw, A. J., Dunnette, S. L., Gleich, G. J., Collins, J. V., & Kay, A. B. (1988) · American Review of Respiratory Disease · doi:10.1164/ajrccm/137.1.62 · Cited by 906
Azzawi, M., Bradley, B., Jeffery, P. K., Frew, A. J., Wardlaw, A. J., Knowles, G. K., Assoufi, B., Collins, J. V., Durham, S. R., & Kay, A. B. (1990) · American Review of Respiratory Disease · doi:10.1164/ajrccm/142.6_pt_1.1407 · Cited by 873
Walker, C., Bode, E., de Boer, L. J., Hansel, T. T., Blaser, K., & Virchow, J.-C. (1992) · American Review of Respiratory Disease · doi:10.1164/ajrccm/146.1.109 · Cited by 767
Corry, D. B., Folkesson, H. G., Warnock, M. L., Erle, D. J., Matthay, M. A., Wiener-Kronish, J. P., & Locksley, R. M. (1996) · The Journal of Experimental Medicine · doi:10.1084/jem.183.1.109 · Cited by 723
A genome-wide search for asthma susceptibility loci in ethnically diverse populations
(1997) · Nature Genetics · doi:10.1038/ng0497-389 · Cited by 703
IL-4 is required to generate and sustain in vivo IgE responses.
Finkelman, F. D., Katona, I. M., Urban, J. F., Holmes, J. M., Ohara, J., Tung, A. S., Sample, J. V., & Paul, W. E. (1988) · The Journal of Immunology · doi:10.4049/jimmunol.141.7.2335 · Cited by 668
Bradley, B. L., Azzawi, M., Jacobson, M. R., Assoufi, B., Collins, J. V., IRANI, A., Schwartz, L., Durham, S. R., Jeffery, P. K., & KAY, A. (1991) · Journal of Allergy and Clinical Immunology · doi:10.1016/0091-6749(91)90160-p · Cited by 663
Eosinophils and mast cells in bronchoalveolar lavage in subjects with mild asthma
Wardlaw, A. J. (1988) · Medical Entomology and Zoology · Cited by 647
Mechanics of Respiration in Unanesthetized Guinea Pigs
Amdur, M. O., & Mead, J. (1958) · American Journal of Physiology-Legacy Content · doi:10.1152/ajplegacy.1958.192.2.364 · Cited by 629
Yamaguchi, Y., Suda, T., Suda, J., Eguchi, M., Miura, Y., Harada, N., Tominaga, A., & Takatsu, K. (1988) · Journal of Experimental Medicine · doi:10.1084/jem.167.1.43 · Cited by 566
Kay, A. B. (1991) · Journal of Allergy and Clinical Immunology · doi:10.1016/0091-6749(91)90408-g · Cited by 555
Lee, J. J., McGarry, M. P., Farmer, S. C., Denzler, K. L., Larson, K. A., Carrigan, P. E., Brenneise, I. E., Horton, M. A., Haczku, A., Gelfand, E. W., et al. (1997) · The Journal of Experimental Medicine · doi:10.1084/jem.185.12.2143 · Cited by 517
Gavett, S. H., Chen, X., Finkelman, F. D., & Wills-Karp, M. A. (1994) · American Journal of Respiratory Cell and Molecular Biology · doi:10.1165/ajrcmb.10.6.8003337 · Cited by 489
Bentley, A. M., Menz, G., Storz, C., Robinson, D. S., Bradley, B., Jeffery, P. K., Durham, S. R., & Kay, A. B. (1992) · American Review of Respiratory Disease · doi:10.1164/ajrccm/146.2.500 · Cited by 429
Evidence for a Locus Regulating Total Serum IgE Levels Mapping to Chromosome 5
Meyers, D. A., Postma, D. S., Panhuysen, C. I. M., Xu, J., Amelung, P. J., Levitt, R. C., & Bleecker, E. (1994) · Genomics · doi:10.1006/geno.1994.1524 · Cited by 386
Rankin, J. A., Picarella, D., Geba, G. P., Temann, U.-A., Prasad, B., DiCosmo, B., Tarallo, A., Stripp, B. R., Whitsett, J. A., & Flavell, R. A. (1996) · Proceedings of the National Academy of Sciences · doi:10.1073/pnas.93.15.7821 · Cited by 342
Self-citationT-Cell Cytokine Profile Evaluated at the Single Cell Level in BAL and Blood in Allergic Asthma
Krug, N., Madden, J., Redington, A. E., Lackie, P. M., Djukanović, R., Schauer, U., Holgate, S. T., Frew, A. J., & Howarth, P. H. (1996) · American Journal of Respiratory Cell and Molecular Biology · doi:10.1165/ajrcmb.14.4.8600935 · Cited by 306
Hültner, L., Druez, C., Moeller, J., Uyttenhove, C., Schmitt, E., Rüde, E., Dormer, P. G., & Snick, J. V. (1990) · European Journal of Immunology · doi:10.1002/eji.1830200632 · Cited by 301
Uyttenhove, C., Simpson, R. J., & Snick, J. V. (1988) · Proceedings of the National Academy of Sciences · doi:10.1073/pnas.85.18.6934 · Cited by 299
Evidence of ongoing mast cell and eosinophil degranulation in symptomatic asthma airway
Broide, D. H., Gleich, G. J., Cuomo, A. J., Coburn, D. A., Federman, E. C., Schwarte, L. B., & Wasserman, S. I. (1991) · Journal of Allergy and Clinical Immunology · doi:10.1016/0091-6749(91)90158-k · Cited by 283
Bentley, A. M. (1992) · Medical Entomology and Zoology · Cited by 282
Hogan, S. P., Mould, A. W., Kikutani, H., Ramsay, A. J., & Foster, P. S. (1997) · Journal of Clinical Investigation · doi:10.1172/jci119292 · Cited by 267
A Novel Role for Murine IL-4 In Vivo: Induction of MUC5AC Gene Expression and Mucin Hypersecretion
Temann, U.-A., Prasad, B., Gallup, M., Basbaum, C. B., Ho, S. B., Flavell, R. A., & Rankin, J. A. (1997) · American Journal of Respiratory Cell and Molecular Biology · doi:10.1165/ajrcmb.16.4.9115759 · Cited by 263
Self-citationDoull, I. J. M., Lawrence, S., Watson, M., BEGISHVILI, T. B., Beasley, R. W., Lampe, F. C., Holgate, T., & Morton, N. E. (1996) · American Journal of Respiratory and Critical Care Medicine · doi:10.1164/ajrccm.153.4.8616554 · Cited by 254
Pulmonary responses to bronchoconstrictor agonists in the mouse
Martin, T. R., Gerard, N. P., Galli, S. J., & Drazen, J. M. (1988) · Journal of Applied Physiology · doi:10.1152/jappl.1988.64.6.2318 · Cited by 243
Interleukin 9: A candidate gene for asthma
Nicolaides, N. C., Holroyd, K. J., Ewart, S., Eleff, S. M., Kiser, M. B., Dragwa, C. R., Sullivan, C. D., Grasso, L., Zhang, L.-Y., Messler, C. J., et al. (1997) · Proceedings of the National Academy of Sciences · doi:10.1073/pnas.94.24.13175 · Cited by 228
van Leeuwen, B., Martinson, M., Webb, G., & Young, I. (1989) · Blood · doi:10.1182/blood.v73.5.1142.1142 · Cited by 227
Svetić, A., Madden, K. B., Zhou, X. D., Lü, P., Katona, I. M., Finkelman, F. D., Urban, J. F., & Gause, W. C. (1993) · The Journal of Immunology · doi:10.4049/jimmunol.150.8.3434 · Cited by 219
Tang, W., Geba, G. P., Zheng, T., Ray, P., Homer, R. J., Kuhn, C., Flavell, R. A., & Elias, J. A. (1996) · Journal of Clinical Investigation · doi:10.1172/jci119113 · Cited by 210
Self-citationDiCosmo, B., Geba, G. P., Picarella, D., Elias, J. A., Rankin, J. A., Stripp, B. R., Whitsett, J. A., & Flavell, R. A. (1994) · Journal of Clinical Investigation · doi:10.1172/jci117556 · Cited by 208
Self-citationHogan, S. P., Koskinen, A. M. L., MATTHAEI, K. I., Young, I. G., & Foster, P. S. (1998) · American Journal of Respiratory and Critical Care Medicine · doi:10.1164/ajrccm.157.1.9702074 · Cited by 200
Dugas, B., Renauld, J., Pène, J., Bonnefoy, J. Y., Peti‐Frère, C., Braquet, P. G., Bousquet, J., Snick, J. V., & Mencia‐Huerta, J. M. (1993) · European Journal of Immunology · doi:10.1002/eji.1830230743 · Cited by 194
Hessel, E. M., van Oosterhout, A. J. M., van Ark, I., van Esch, B. C. A. M., Hofman, G. A., Loveren, H. V., Savelkoul, H. F. J., & Nijkamp, F. P. (1997) · American Journal of Respiratory Cell and Molecular Biology · doi:10.1165/ajrcmb.16.3.9070618 · Cited by 191
Cytokines as Mediators of Chronic Asthma
Barnes, P. J. (1994) · American Journal of Respiratory and Critical Care Medicine · doi:10.1164/ajrccm/150.5_pt_2.s42 · Cited by 188
Interleukin‐9 is involved in host protective immunity to intestinal nematode infection
Faulkner, H., Humphreys, N. E., Renauld, J., Snick, J. V., & Grencis, R. K. (1997) · European Journal of Immunology · doi:10.1002/eji.1830271011 · Cited by 186
Else, K. J., Hültner, L., & Grencis, R. K. (1992) · PubMed Central · Cited by 170
Grencis, R. K., Hültner, L., & Else, K. J. (1991) · PubMed Central · Cited by 166
Gessner, A., Blum, H., & Röllinghoff, M. (1993) · Immunobiology · doi:10.1016/s0171-2985(11)80414-6 · Cited by 162
Induction of IL-4-producing CD4+ T cells by antigenic peptides altered for TCR binding
Tao, X., Grant, C., Constant, S. L., & Bottomly, K. (1997) · The Journal of Immunology · doi:10.4049/jimmunol.158.9.4237 · Cited by 159
Peripheral blood eosinophil counts and bronchial responsiveness.
Taylor, K. J., & Luksza, A. R. (1987) · Thorax · doi:10.1136/thx.42.6.452 · Cited by 152
cis-acting elements that confer lung epithelial cell expression of the CC10 gene.
Stripp, B. R., Sawaya, P. L., Luse, D. S., Wikenheiser‐Brokamp, K. A., Wert, S. E., Huffman, J. A., Lattier, D. L., Singh, G., Katyal, S. L., & Whitsett, J. A. (1992) · Journal of Biological Chemistry · doi:10.1016/s0021-9258(18)42098-4 · Cited by 142
Pesci, A., Foresi, A., Bertorelli, G., Chetta, A. A., & Oliveri, D. (1993) · American Review of Respiratory Disease · doi:10.1164/ajrccm/147.3.684 · Cited by 141
Characterization of inflammatory mediator release from purified human lung mast cells.
Schleimer, R. P., MacGlashan, D. W., Peters, S. P., Pinckard, R. N., Adkinson, N. F., & Lichtenstein, L. M. (1986) · PubMed · doi:10.1164/arrd.1986.133.4.614 · Cited by 137
Eklund, K. K., Ghildyal, N., Austen, K. F., & Stevens, R. L. (1993) · The Journal of Immunology · doi:10.4049/jimmunol.151.8.4266 · Cited by 137
Thymic lymphomas in interleukin 9 transgenic mice.
Renauld, J., van der Lugt, N. M. T., Vink, A., van ROON, M. A., Godfraind, C., Warnier, G., Merz, H., Feller, A. C., Berns, A. J. M., & SNICK, J. V. (1994) · PubMed · Cited by 134
Interleukin-9 potentiates the interleukin-4-induced IgE and IgG1 release from murine B lymphocytes.
Petit-Frère, C., Dugas, B., Braquet, P. G., & Mencia‐Huerta, J. M. (1993) · PubMed Central · Cited by 116
Tcgfiii/p40 is produced by naive murine cd4+ t cells but is not a general t cell growth factor*
Schmitt, E., Brandwijk, R. V., Snick, J. V., SIEBOLD, B., & Rüde, E. (1989) · European Journal of Immunology · doi:10.1002/eji.1830191130 · Cited by 115
Interleukin-9 and its receptor: involvement in mast cell differentiation and T cell oncogenesis
Renauld, J., Kermouni, A., Vink, A., Louahed, J., & Snick, J. V. (1995) · Journal of Leukocyte Biology · doi:10.1002/jlb.57.3.353 · Cited by 112
Human P40 T-cell growth factor (interleukin-9) supports erythroid colony formation
Donahue, R., Yang, Y., & Clark, S. (1990) · Blood · doi:10.1182/blood.v75.12.2271.2271 · Cited by 110
Renauld, J., Goethals, A., Houssiau, F., Merz, H., Roost, E. V., & SNICK, J. V. (1990) · The Journal of Immunology · doi:10.4049/jimmunol.144.11.4235 · Cited by 100
Mechanisms of Persistent Airway Inflammation in Asthma. A Role for T Cells and T-Cell Products
Busse, W. W., Coffman, R. L., Gelfand, E. W., Kay, A. B., & Rosenwasser, L. J. (1995) · American Journal of Respiratory and Critical Care Medicine · doi:10.1164/ajrccm.152.1.7599853 · Cited by 96
Activation and regulation of chemokines in allergic airway inflammation
Lukacs, N. W., Strieter, R. M., Chensue, S. W., & Kunkel, S. L. (1996) · Journal of Leukocyte Biology · doi:10.1002/jlb.59.1.13 · Cited by 87
T-Cell-mediated Induction of Airway Hyperreactivity in Mice
Garssen, J., Nijkamp, F. P., Vliet, H. V. D., & Loveren, H. V. (1991) · American Review of Respiratory Disease · doi:10.1164/ajrccm/144.4.931 · Cited by 87
Leukocyte Infiltration in Allergic Airway Inflammation
Lukacs, N. W., Strieter, R. M., & Kunkel, S. L. (1995) · American Journal of Respiratory Cell and Molecular Biology · doi:10.1165/ajrcmb.13.1.7598934 · Cited by 77
Kelleher, K., Bean, K. M., Clark, S., Leung, W., Yang-Feng, T., Chen, J., Lin, P., Luo, W., & Yang, Y. (1991) · Blood · doi:10.1182/blood.v77.7.1436.1436 · Cited by 72
Williams, D. E., Morrissey, P. J., Mochizuki, D., de Vries, P., Anderson, D. M., Cosman, D. J., Boswell, H. S., Cooper, S. H., Grabstein, K. H., & Broxmeyer, H. (1990) · Blood · doi:10.1182/blood.v76.5.906.906 · Cited by 62
Interleukin-4 has basophilic and eosinophilic cell growth-promoting activity on cord blood cells
Favre, C., Saeland, S., Caux, C., Duvert, V., & de Vries, J. E. (1990) · Blood · doi:10.1182/blood.v75.1.67.67 · Cited by 60
Houssiau, F., Schandené, L., Stevens, M., Cambiaso, C. L., Goldman, M., SNICK, J. V., & Renauld, J. (1995) · The Journal of Immunology · doi:10.4049/jimmunol.154.6.2624 · Cited by 57
IL-4-independent regulation of in vivo IL-9 expression
Monteyne, P., Renauld, J., Broeck, J. V., Dunne, D. W., Brombacher, F., & Coutelier, J. P. (1997) · The Journal of Immunology · doi:10.4049/jimmunol.159.6.2616 · Cited by 57
The pathology of primary pulmonary hypertension.
Burke, A. P., Farb, A. A., & Virmani, R. (1991) · PubMed · Cited by 55
Human T cell lines and clones respond to IL-9
Houssiau, F., Renauld, J., Stevens, M., Lehmann, F. F., Lethé, B., Coulie, P. G., & SNICK, J. V. (1993) · The Journal of Immunology · doi:10.4049/jimmunol.150.7.2634 · Cited by 54
[Pathology of primary pulmonary hypertension].
Chazova, I. E., Vs, Z., Sp, B., & Mareev, V. I. (1993) · PubMed · Cited by 50
Morton, N. E. (1992) · Clinical & Experimental Allergy · doi:10.1111/j.1365-2222.1992.tb00126.x · Cited by 47
Uncoupling of Airway Inflammation and Bronchial Hyperreactivity
DiCosmo, B., Geba, G. P., Picarella, D., Elias, J. A., Rankin, J. A., Stripp, B. R., Whitsett, J. A., & Flavell, R. A. (1994) · Cited by 42
Self-citationDittel, B. N., Sant’Angelo, D. B., & Janeway, C. A. (1997) · The Journal of Immunology · doi:10.4049/jimmunol.158.9.4065 · Cited by 33
Genetic and Environmental Influences on Airway Inflammation in Asthma
Holgate, S. T., Church, M. K., Howarth, P. H., Morton, N. E., Frew, A. J., & Djukanović, R. (2009) · International Archives of Allergy and Immunology · doi:10.1159/000236921 · Cited by 27
Mast Cell Heterogeneity in Human Lung Tissue
van Overveld, F. J., Houben, L. A. M. J., Moulin, F., Bruijnzeel, P. L. B., Raaijmakers, J. A. M., & Terpstra, G. K. (1989) · Clinical Science · doi:10.1042/cs0770297 · Cited by 11
Cited by
Sorted by citations
Dardalhon, V., Awasthi, A., Kwon, H., Galileos, G., Gao, W., Sobel, R. A., Mitsdoerffer, M., Strom, T. B., Elyaman, W., Ho, I.-C., et al. (2008) · Nature Immunology · doi:10.1038/ni.1677 · Cited by 1,122
ICOS co-stimulatory receptor is essential for T-cell activation and function
Dong, C., Juedes, A. E., Temann, U.-A., Shresta, S., Allison, J. P., Ruddle, N. H., & Flavell, R. A. (2001) · Nature · doi:10.1038/35051100 · Cited by 929
Self-citationType 1/Type 2 Immunity in Infectious Diseases
Spellberg, B. J., & Edwards, J. E. (2001) · Clinical Infectious Diseases · doi:10.1086/317537 · Cited by 923
A Critical Role for Eosinophils in Allergic Airways Remodeling
Humbles, A. A., Lloyd, C. M., McMillan, S. J., Friend, D. S., Xanthou, G., McKenna, E. E., Ghiran, S., Gerard, N. P., Yu, C., Orkin, S. H., et al. (2004) · Science · doi:10.1126/science.1100283 · Cited by 856
Thymic stromal lymphopoietin as a key initiator of allergic airway inflammation in mice
Zhou, B., Comeau, M. R., Smedt, T. D., Liggitt, H. D., Dahl, M. E., Lewis, D. B., Gyarmati, D., Aye, T., Campbell, D., & Ziegler, S. F. (2005) · Nature Immunology · doi:10.1038/ni1247 · Cited by 827
Metadata
- Authors
- Temann, U.-A., Geba, G. P., Rankin, J. A., & Flavell, R. A.
- Affiliations
- Howard Hughes Medical Institute (US)
- Corresponding author
- Flavell, Richard A.
- Venue
- The Journal of Experimental Medicine
- Publisher
- Rockefeller University Press
- Published
- 1998-10-05
- Volume
- 188
- Issue
- 7
- Pages
- 1307-1320
- ISSN
- 0022-1007 (ISSN-L)
- 1540-9538
- PMC
- PMC2212487
- OpenAlex
- W2139108455
- Cited by
- 452
- References
- 72
- Citations by year
- 2026: 5 · 2025: 6 · 2024: 7 · 2023: 9 · 2022: 8 · 2021: 6 · 2020: 14 · 2019: 8 · 2018: 15 · 2017: 19 · 2016: 7 · 2015: 13 · 2014: 9 · 2013: 13 · 2012: 20
- FWCI
- 16.39
- Type
- journal article
- Language
- en
- Open access
- bronze
- doi.org
- Locations
- The Journal of Experimental Medicine (publishedVersion)
- PubMed Central (publishedVersion, cc-by-nc-sa)
- PubMed (publishedVersion)
- Funders
- Howard Hughes Medical Institute
- Yale University (CT 06520)
- National Institutes of Health (5k04hl003229-05, HL-56389)
- Raymond and Beverly Sackler Institute for Biological, Physical and Engineering Sciences, Yale University
- National Heart, Lung, and Blood Institute (P01HL056389, R01HL054450, HL-03229, P50HL056389, HL-56389)
- Topics
- Health Sciences › Medicine › Pulmonary and Respiratory Medicine › Asthma and respiratory diseases
- Life Sciences › Immunology and Microbiology › Immunology › IL-33, ST2, and ILC Pathways
- Life Sciences › Immunology and Microbiology › Immunology › Mast cells and histamine
- Keywords
- IL-9, asthma, airway inflammation, mast cell hyperplasia, airway hyperresponsiveness, transgenic mice, eosinophils, mucus hypersecretion, subepithelial collagen deposition, methacholine responsiveness, Th2 cytokines
- MeSH terms
- Animals, Bronchi, Epithelium, Female, Flow Cytometry, Histamine, Hyperplasia, Therapeutic Irrigation, Lung, Mast Cells, Mice, Inbred C3H, Mice, Inbred C57BL, Mice, Transgenic, Gene Expression, Bronchial Hyperreactivity, Interleukin-9, Mice, Rats
About these checks
Registry, retraction, Cites and statistics results are computed, not judged, with one exception: a printed reference that no index lists is read once by a model before it counts as a citation error. Claims are extracted by a model and kept only when their quote appears verbatim in the text; each cited source is then checked, with a model’s help, for whether it says what the claim relies on. Those verdicts can be wrong — read the claim’s quote and the cited source before relying on one.
Statistics and arithmetic are recomputed, not judged.
Confidence bands are shown only for fields calibrated on our annotated test set. None is calibrated yet, so no band is shown.
What counts as a claim ›How we measure confidence ›How we check this ›
Are you an author, or do you see a problem with this page? Request a review
