

The DOI matches its Crossref record; 51 of the 53 references it cites were found in a registry or an index.
Telomere Fluorescence Measurements in Granulocytes and T Lymphocyte Subsets Point to a High Turnover of Hematopoietic Stem Cells and Memory T Cells in Early Childhood
Open accessAbstract
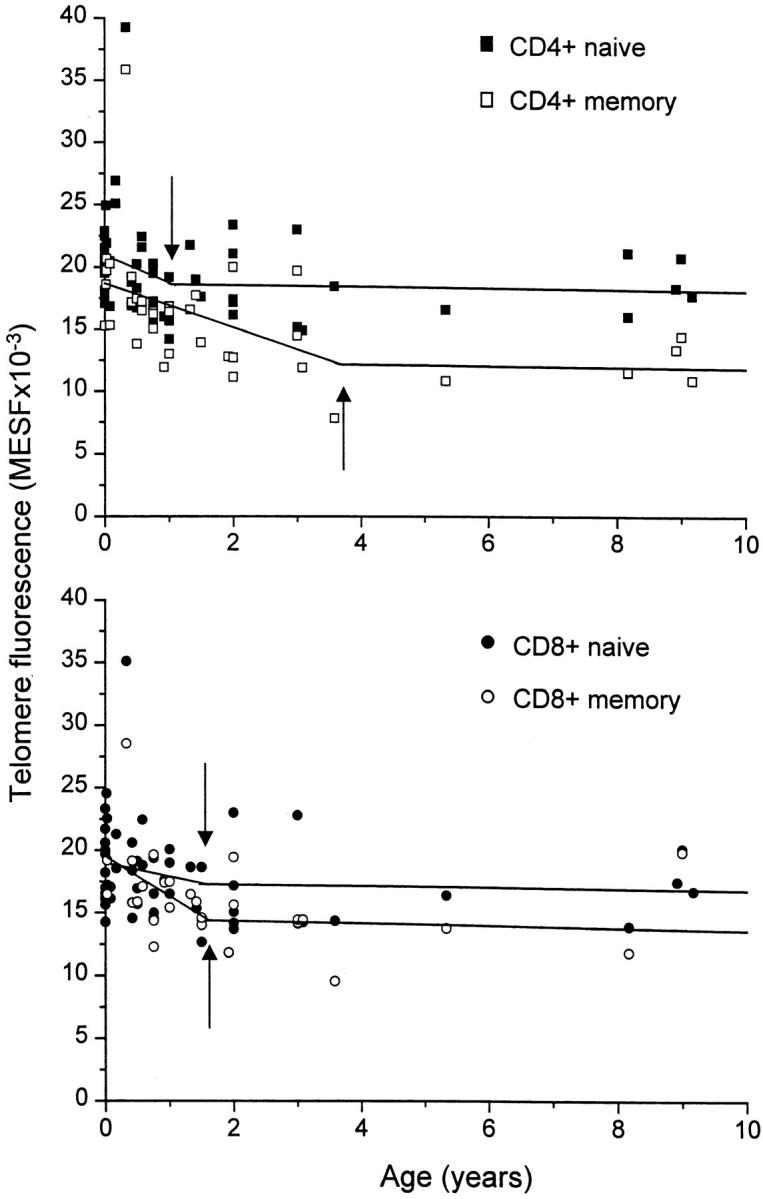
To study telomere length dynamics in hematopoietic cells with age, we analyzed the average length of telomere repeat sequences in diverse populations of nucleated blood cells. More than 500 individuals ranging in age from 0 to 90 yr, including 36 pairs of monozygous and dizygotic twins, were analyzed using quantitative fluorescence in situ hybridization and flow cytometry. Granulocytes and naive T cells showed a parallel biphasic decline in telomere length with age that most likely reflected accumulated cell divisions in the common precursors of both cell types: hematopoietic stem cells. Telomere loss was very rapid in the first year, and continued for more than eight decades at a 30-fold lower rate. Memory T cells also showed an initial rapid decline in telomere length with age. However, in contrast to naive T cells, this decline continued for several years, and in older individuals lymphocytes typically had shorter telomeres than did granulocytes. Our findings point to a dramatic decline in stem cell turnover in early childhood and support the notion that cell divisions in hematopoietic stem cells and T cells result in loss of telomeric DNA.
Overview
The claims and statistics of this paper haven’t been checked yet.
Run the check — free, no account needed. It reads the open-access text and checks the sources it cites.
Integrity signals
Registry
Cites
Statistics
Figures
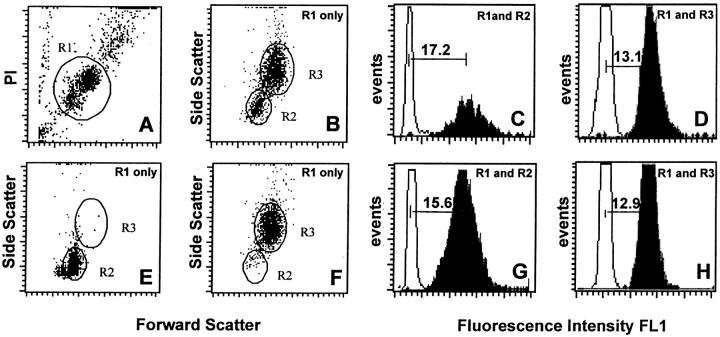
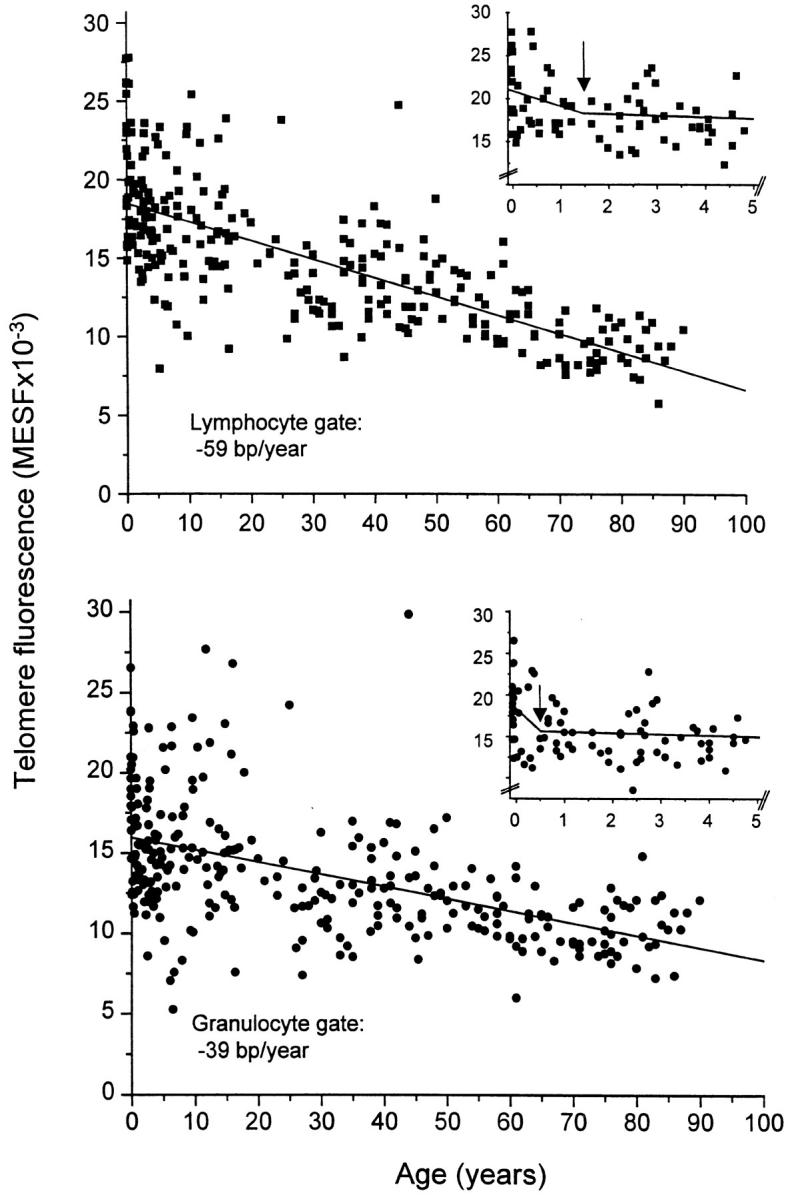
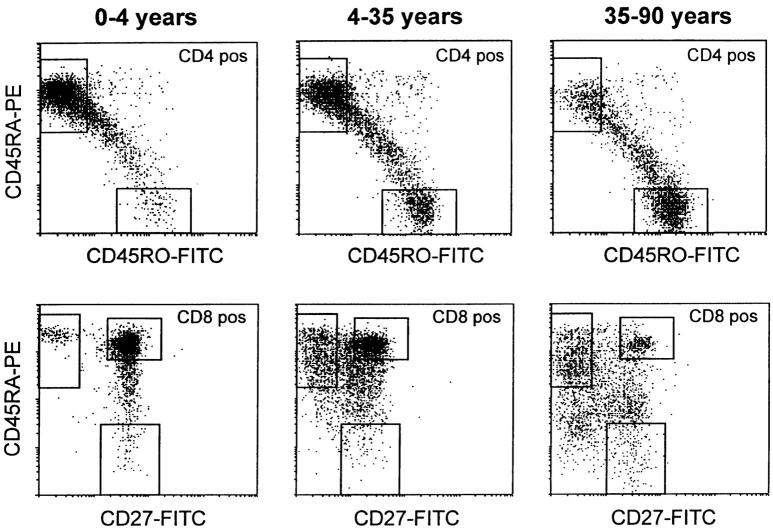
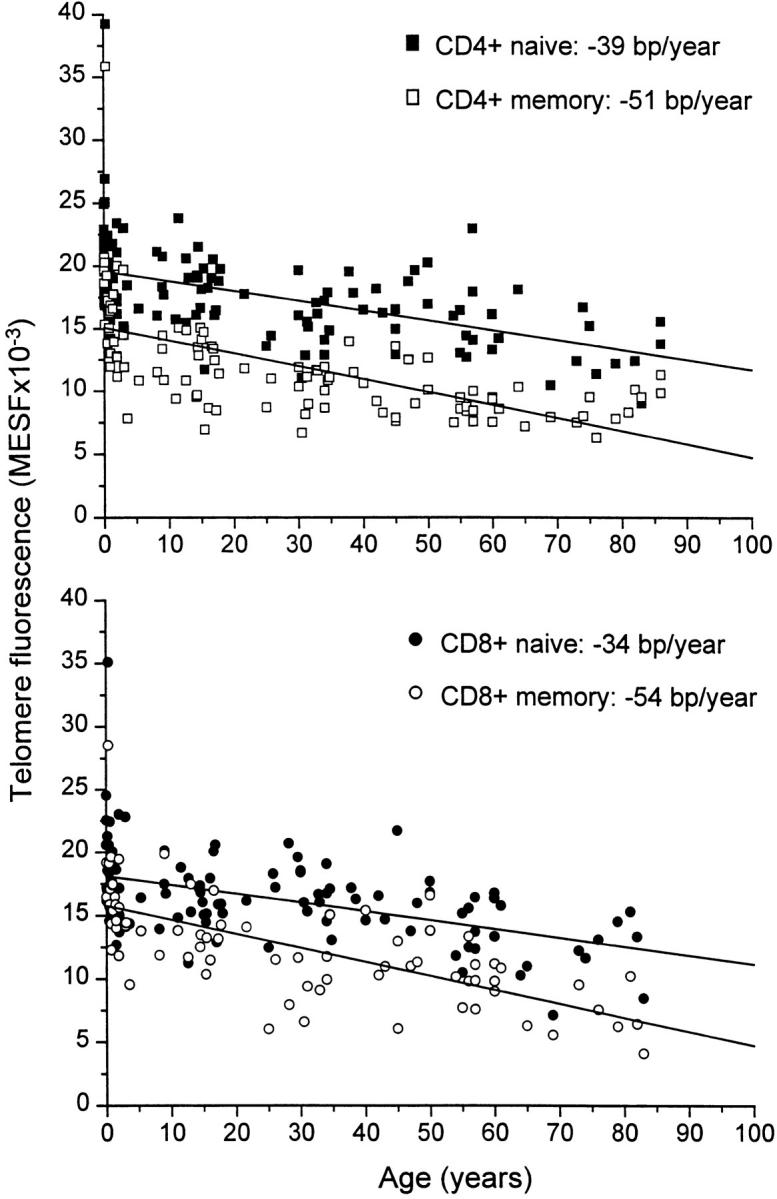
Verification
Claims the paper makes
The claims and statistics of this paper haven’t been checked yet.
Run the check — free, no account needed. It reads the open-access text and checks the sources it cites.
Claims other papers make about this one
Each is checked against this paper’s own text: does it say what the citing paper says it does?
In the citing paper
“Moreover, TL naive T cells are longer than that of memory T cells [224].”
From Current and Future Trends of Colorectal Cancer Treatment: Exploring Advances in Immunotherapy (2024) · cites this paper as [224]
In the citing paper
“T‐cell telomere length declines with age (Rufer et al, 1999), suggesting they have undergone replicative senescence from repetitive divisions.”
From The struggle of a good friend getting old: cellular senescence in viral responses and therapy (2021) · cites this paper as Rufer et al, 1999
In the citing paper
“When examining telomere measurements within a mixed cell population, it is important to note that this is a surrogate marker of the mean in a heterogeneous cell population and that telomere length is mosaic, reflecting the telomere length regulation and replicative history of each cell type51,52.”
From The telomere syndromes (2012) · cites this paper as [52]
Self-check
Percentages, sums and reported differences re-computed from the paper’s own numbers.
The self-check needs the paper’s full text.
Citations
Cites
Telomeres shorten during ageing of human fibroblasts
Harley, C. B., Futcher, A. B., & Greider, C. W. (1990) · Nature · doi:10.1038/345458a0 · Cited by 5,750
Draper, N. R., & Smith, H. (1998) · Wiley series in probability and statistics · doi:10.1002/9781118625590 · Cited by 5,086
Gunst, R. F., Draper, N. R., & Smith, H. C. (1999) · Technometrics · doi:10.2307/1270576 · Cited by 4,071
Telomere length predicts replicative capacity of human fibroblasts.
Allsopp, R. C., Vaziri, H., Patterson, C., Goldstein, S., Younglai, E. V., Futcher, A. B., Greider, C. W., & Harley, C. B. (1992) · Proceedings of the National Academy of Sciences · doi:10.1073/pnas.89.21.10114 · Cited by 2,200
Changes in thymic function with age and during the treatment of HIV infection
Douek, D. C., McFarland, R. D., Keiser, P. H., Gage, E. A., Massey, J. M., Haynes, B. F., Polis, M. A., Haase, A. T., Feinberg, M. B., Sullivan#, J. L., et al. (1998) · Nature · doi:10.1038/25374 · Cited by 1,893
Telomere reduction in human colorectal carcinoma and with ageing
Hastie, N. D., Dempster, M., Dunlop, M. G., Thompson, A. M., Green, D. K., & Allshire, R. C. (1990) · Nature · doi:10.1038/346866a0 · Cited by 1,650
Phenotypic and functional separation of memory and effector human CD8+ T cells
Hamann, D., Baars, P. A., Rep, M. H. G., Hooibrink, B., Kerkhof-Garde, S. R., Klein, M. R., & Lier, R. A. W. V. (1997) · The Journal of Experimental Medicine · doi:10.1084/jem.186.9.1407 · Cited by 1,366
Evidence for a mitotic clock in human hematopoietic stem cells: loss of telomeric DNA with age.
Vaziri, H., Dragowska, W., Allsopp, R. C., Thomas, T. E., Harley, C. B., & Lansdorp, P. M. (1994) · Proceedings of the National Academy of Sciences · doi:10.1073/pnas.91.21.9857 · Cited by 1,132
Self-citationHeterogeneity in telomere length of human chromosomes
Lansdorp, P. M. (1996) · Human Molecular Genetics · doi:10.1093/hmg/5.5.685 · Cited by 886
Self-citationTurnover of naive- and memory-phenotype T cells.
Tough, D. F., & Sprent, J. (1994) · The Journal of experimental medicine · doi:10.1084/jem.179.4.1127 · Cited by 869
Research works printed but not linked: 1
- Rosendaal, 1979, Organization of haemopoietic stem cellsthe generation-age hypothesis, Cell Tissue Kinet., 12, 17
Cited by
Sorted by citations
Accelerated telomere shortening in response to life stress
Epel, E. S., Blackburn, E. H., Lin, J., Dhabhar, F. S., Adler, N. E., Morrow, J. D., & Cawthon, R. M. (2004) · Proceedings of the National Academy of Sciences · doi:10.1073/pnas.0407162101 · Cited by 3,002
Aubert, G., & Lansdorp, P. M. (2008) · Physiological Reviews · doi:10.1152/physrev.00026.2007 · Cited by 1,188
Self-citationBrenchley, J. M., Karandikar, N. J., Betts, M. R., Ambrozak, D. R., Hill, B. J., Crotty, L. E., Casazza, J. P., Kuruppu, J., Migueles, S. A., Connors, M., et al. (2003) · Blood · doi:10.1182/blood-2002-07-2103 · Cited by 1,073
Armanios, M., & Blackburn, E. H. (2012) · Nature Reviews Genetics · doi:10.1038/nrg3246 · Cited by 982
Aging of blood can be tracked by DNA methylation changes at just three CpG sites
Weidner, C. I., Lin, Q., Koch, C. M., Eisele, L., Beier, F., Ziegler, P., Bauerschlag, D. O., Jöckel, K.-H., Erbel, R., Mühleisen, T. W., et al. (2014) · Genome Biology · doi:10.1186/gb-2014-15-2-r24 · Cited by 837
Self-citation
Metadata
- Authors
- Rufer, N., Brümmendorf, T. H., Kolvraa, S., Bischoff, C., Christensen, K., Wadsworth, L., Schulzer, M., & Lansdorp, P. M.
- Affiliations
- aFrom the Terry Fox Laboratory, British Columbia Cancer Research Centre, Vancouver, British Columbia V5Z 1L3, Canada
- bInstitute of Human Genetics, University of Aarhus, 8000 Aarhus, Denmark
- Aarhus University (DK)
- University of Southern Denmark (DK)
- University of British Columbia (CA)
- Venue
- The Journal of Experimental Medicine
- Publisher
- Rockefeller University Press
- Published
- 1999-07-19
- Volume
- 190
- Issue
- 2
- Pages
- 157-168
- ISSN
- 0022-1007 (ISSN-L)
- 1540-9538
- PMC
- PMC2195579
- OpenAlex
- W2064651531
- Cited by
- 709
- References
- 53
- Citations by year
- 2026: 8 · 2025: 8 · 2024: 17 · 2023: 21 · 2022: 45 · 2021: 24 · 2020: 17 · 2019: 18 · 2018: 25 · 2017: 21 · 2016: 16 · 2015: 30 · 2014: 21 · 2013: 19 · 2012: 31
- FWCI
- 18.55
- Type
- journal article
- Language
- en
- Open access
- bronze
- doi.org
- Locations
- The Journal of Experimental Medicine (publishedVersion)
- PubMed Central (publishedVersion, cc-by-nc-sa)
- PubMed (publishedVersion)
- SERVAL (Université de Lausanne) (publishedVersion, cc-by-nc-sa)
- IRIS (submittedVersion, cc-by-nc-sa)
- University of Southern Denmark Research Portal (University of Southern Denmark) (submittedVersion)
- Funders
- National Research Foundation
- Deutsche Forschungsgemeinschaft
- Schweizerischer Nationalfonds zur Förderung der Wissenschaftlichen Forschung
- Danmarks Grundforskningsfond (PO1-AG08761)
- National Institutes of Health (1r01gm056162-01)
- National Institute on Aging (PO1-AG08761, NIA-PO1-AG08761, P01AG008761)
- National Cancer Institute
- National Institute of General Medical Sciences (GM56162)
- National Institute of Allergy and Infectious Diseases (AI 29524, R21AI029524, R01AI029524)
- Topics
- Life Sciences › Biochemistry, Genetics and Molecular Biology › Cell Biology › Telomeres, Telomerase, and Senescence
- Health Sciences › Medicine › Hematology › Hematopoietic Stem Cell Transplantation
- Life Sciences › Biochemistry, Genetics and Molecular Biology › Aging › Genetics, Aging, and Longevity in Model Organisms
- Keywords
- telomere length, hematopoietic stem cells, memory T cells, naive T cells, granulocytes, aging, cell division, early childhood, telomere shortening
- MeSH terms
- Adolescent, Adult, Aged, Aged, 80 and over, Aging, Child, Child, Preschool, Female, Flow Cytometry, Granulocytes, Hematopoietic Stem Cells, Humans, Immunologic Memory, Infant, Infant, Newborn, Male, Middle Aged, Twins, Dizygotic, Twins, Monozygotic, T-Lymphocyte Subsets, Telomere, In Situ Hybridization, Fluorescence, Terminal Repeat Sequences
About these checks
Registry, retraction, Cites and statistics results are computed, not judged, with one exception: a printed reference that no index lists is read once by a model before it counts as a citation error. Claims are extracted by a model and kept only when their quote appears verbatim in the text; each cited source is then checked, with a model’s help, for whether it says what the claim relies on. Those verdicts can be wrong — read the claim’s quote and the cited source before relying on one.
Statistics and arithmetic are recomputed, not judged.
Confidence bands are shown only for fields calibrated on our annotated test set. None is calibrated yet, so no band is shown.
What counts as a claim ›How we measure confidence ›How we check this ›
Are you an author, or do you see a problem with this page? Request a review
