

The DOI matches its Crossref record; 48 of the 48 references it cites were found in a registry or an index.
Oligosaccharides of Hyaluronan Activate Dendritic Cells via Toll-like Receptor 4
Open accessAbstract
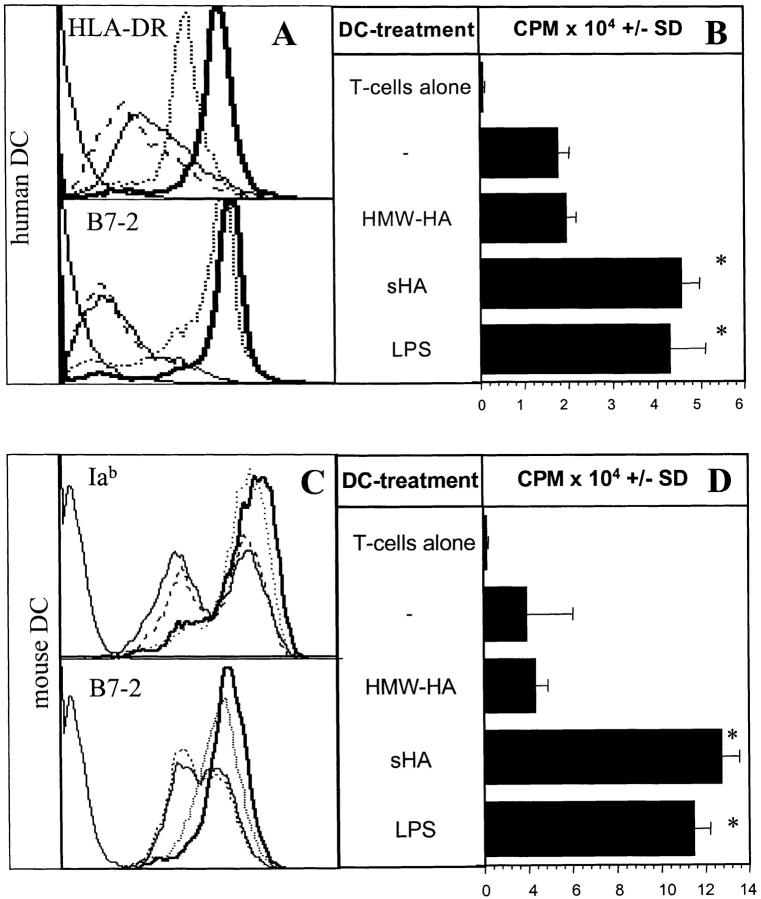
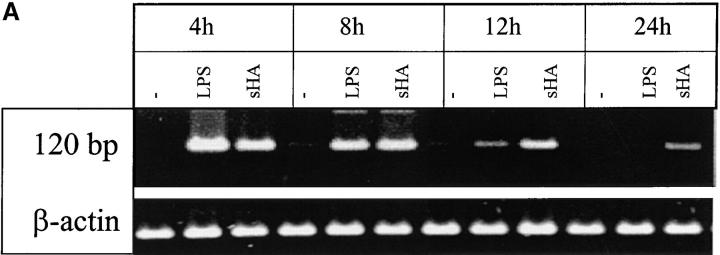
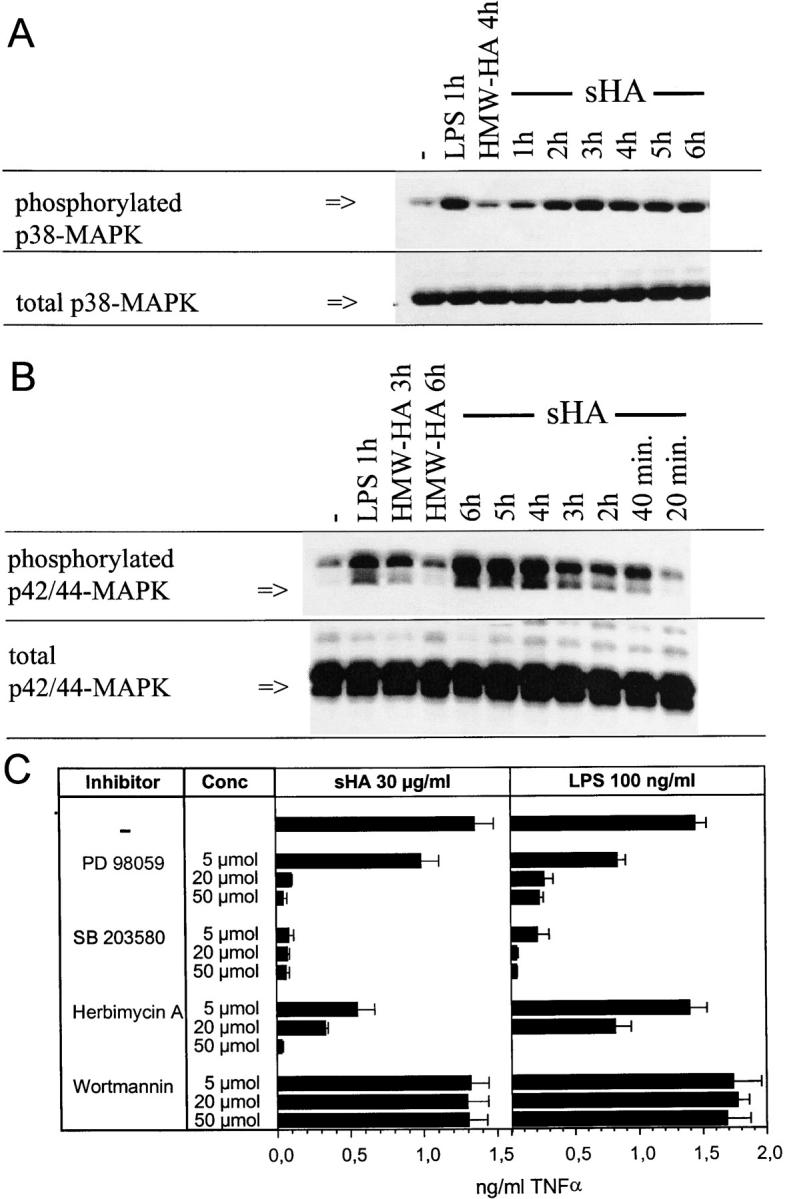
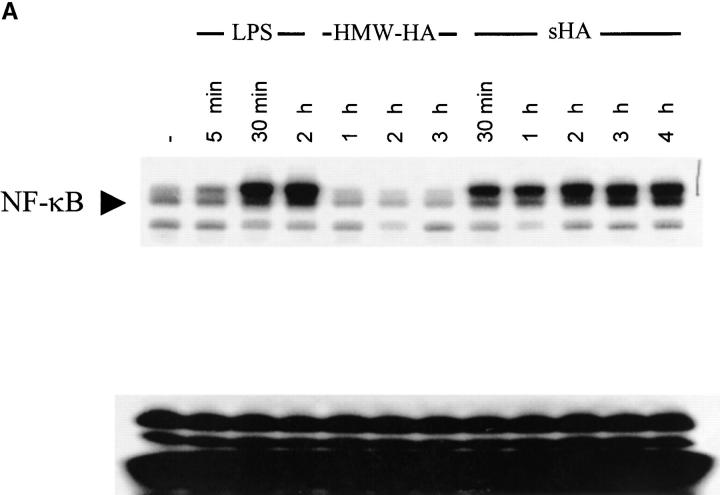
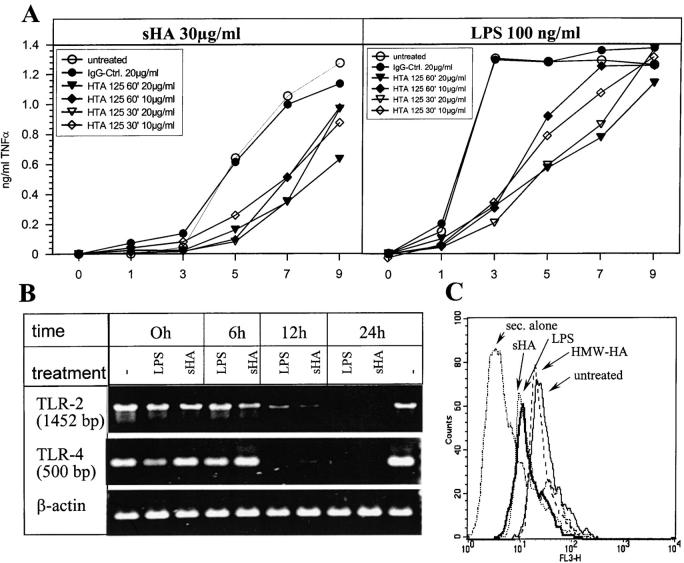
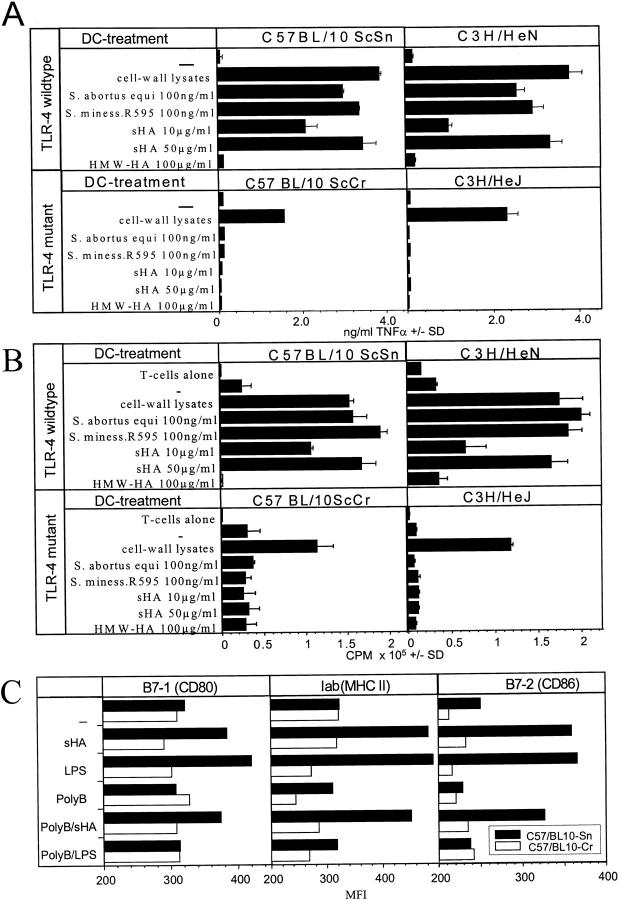
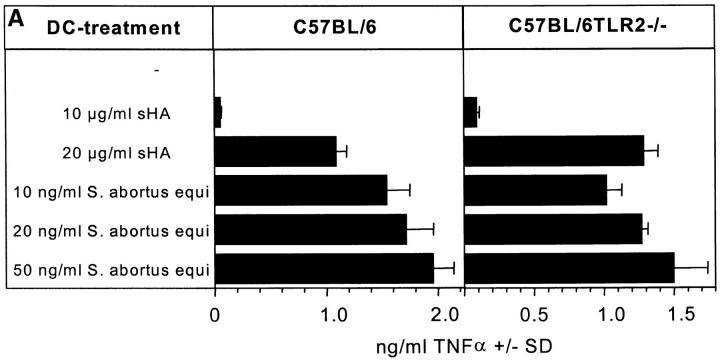
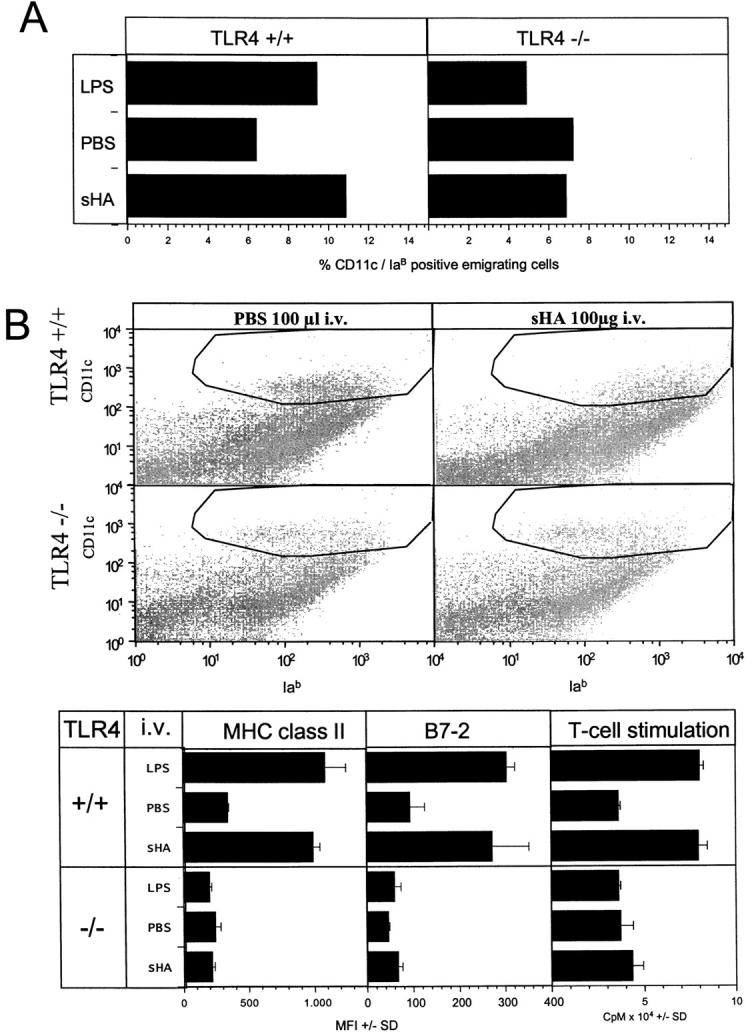
Low molecular weight fragmentation products of the polysaccharide of Hyaluronic acid (sHA) produced during inflammation have been shown to be potent activators of immunocompetent cells such as dendritic cells (DCs) and macrophages. Here we report that sHA induces maturation of DCs via the Toll-like receptor (TLR)-4, a receptor complex associated with innate immunity and host defense against bacterial infection. Bone marrow–derived DCs from C3H/HeJ and C57BL/10ScCr mice carrying mutant TLR-4 alleles were nonresponsive to sHA-induced phenotypic and functional maturation. Conversely, DCs from TLR-2–deficient mice were still susceptible to sHA. In accordance, addition of an anti–TLR-4 mAb to human monocyte–derived DCs blocked sHA-induced tumor necrosis factor α production. Western blot analysis revealed that sHA treatment resulted in distinct phosphorylation of p38/p42/44 MAP-kinases and nuclear translocation of nuclear factor (NF)-κB, all components of the TLR-4 signaling pathway. Blockade of this pathway by specific inhibitors completely abrogated the sHA-induced DC maturation. Finally, intravenous injection of sHA-induced DC emigration from the skin and their phenotypic and functional maturation in the spleen, again depending on the expression of TLR-4. In conclusion, this is the first report that polysaccharide degradation products of the extracellular matrix produced during inflammation might serve as an endogenous ligand for the TLR-4 complex on DCs.
Overview
The claims and statistics of this paper haven’t been checked yet.
Run the check — free, no account needed. It reads the open-access text and checks the sources it cites.
Integrity signals
Registry
Cites
Statistics
Figures
Verification
Claims the paper makes
The claims and statistics of this paper haven’t been checked yet.
Run the check — free, no account needed. It reads the open-access text and checks the sources it cites.
Claims other papers make about this one
Each is checked against this paper’s own text: does it say what the citing paper says it does?
The source backs part of the claim, not all of it — or backs it for a different population, condition or comparison.
In the citing paper
“ECM-bioscaffold degradation products function as damage-associated molecular patterns (DAMPs) that ligate pattern-recognition and scavenger receptors on dendritic cells and macrophages; in some contexts, they also signal via integrins [2,26,28,29].”
From Immune Response to Extracellular Matrix Bioscaffolds: A Comprehensive Review (2025) · cites this paper as [28]
Experimental — accuracy not yet measured
Self-check
Percentages, sums and reported differences re-computed from the paper’s own numbers.
The self-check needs the paper’s full text.
Citations
Cites
Defective LPS Signaling in C3H/HeJ and C57BL/10ScCr Mice: Mutations in Tlr4 Gene
Poltorak, A., He, X., Smirnova, I., Liu, M.-Y., Huffel, C. V., Du, X., Birdwell, D., Alejos, E., Silva, M., Galanos, C., et al. (1998) · Science · doi:10.1126/science.282.5396.2085 · Cited by 7,631
Self-citationTakeuchi, O., Hoshino, K., Kawai, T., Sanjo, H., Takada, H., Ogawa, T., Takeda, K., & Akira, S. (1999) · Immunity · doi:10.1016/s1074-7613(00)80119-3 · Cited by 3,680
Alessi, D. R., Cuenda, A., Cohen, P., Dudley, D. T., & Saltiel, A. R. (1995) · Journal of Biological Chemistry · doi:10.1074/jbc.270.46.27489 · Cited by 3,374
Toll-like receptors in the induction of the innate immune response
Aderem, A. A., & Ulevitch, R. J. (2000) · Nature · doi:10.1038/35021228 · Cited by 3,082
MD-2, a Molecule that Confers Lipopolysaccharide Responsiveness on Toll-like Receptor 4
Shimazu, R., Akashi, S., Ogata, H., Nagai, Y., Fukudome, K., Miyake, K., & Kimoto, M. (1999) · The Journal of Experimental Medicine · doi:10.1084/jem.189.11.1777 · Cited by 2,187
Self-citationA family of human receptors structurally related to Drosophila Toll.
Rock, F., Hardiman, G., Timans, J., Kastelein, R., & Bazan, J. (1998) · Proceedings of the National Academy of Sciences of the United States of America · doi:10.1073/pnas.95.2.588 · Cited by 2,009
Laurent, T. C., & Fraser, J. R. E. (1992) · The FASEB Journal · doi:10.1096/fasebj.6.7.1563592 · Cited by 2,004
MyD88 is an adaptor protein in the hToll/IL-1 receptor family signaling pathways.
Medzhitov, R., Preston-Hurlburt, P., Kopp, E., Stadlen, A., Chen, C.-Q., Ghosh, S., & Janeway, C. (1998) · Molecules and Cells · doi:10.1016/s1097-2765(00)80136-7 · Cited by 1,783
Ohashi, K., Burkart, V., Flohé, S. B., & Kolb, H. (2000) · The Journal of Immunology · doi:10.4049/jimmunol.164.2.558 · Cited by 1,607
Toll-like Receptor 2 Functions as a Pattern Recognition Receptor for Diverse Bacterial Products*
Lien, E., Sellati, T., Yoshimura, A., Flo, T., Rawadi, G., Finberg, R., Carroll, J. D., Espevik, T., Ingalls, R., Radolf, J., et al. (1999) · Journal of Biological Chemistry · doi:10.1074/jbc.274.47.33419 · Cited by 1,062
Cadherin-catenin complex: Protein interactions and their implications for cadherin function
Aberle, H., Schwartz, H. T., & Kemler, R. (1996) · Journal of Cellular Biochemistry · doi:10.1002/(sici)1097-4644(19960616)61:4 · Cited by 806
Toll-like receptor 4 imparts ligand-specific recognition of bacterial lipopolysaccharide.
Lien, E., Means, T., Heine, H., Yoshimura, A., Kusumoto, S., Fukase, K., Fenton, M., Oikawa, M., Qureshi, N., Monks, B., et al. (2000) · Journal of Clinical Investigation · doi:10.1172/jci8541 · Cited by 798
Polysaccharides : structural diversity and functional versatility
Dumitriu, S. (1998) · Marcel Dekker eBooks · Cited by 780
Nomura, F., Akashi, S., Sakao, Y., Sato, S., Kawai, T., Matsumoto, M., Nakanishi, K., Kimoto, M., Miyake, K., Takeda, K., et al. (2000) · The Journal of Immunology · doi:10.4049/jimmunol.164.7.3476 · Cited by 765
Self-citationCario, E., Rosenberg, I. M., Brandwein, S. L., Beck, P. L., Reinecker, H., & Podolsky, D. K. (2000) · The Journal of Immunology · doi:10.4049/jimmunol.164.2.966 · Cited by 751
Zhang, F. X., Kirschning, C., Mancinelli, R., Xu, X.-P., Jin, Y., Faure, E., Mantovani, A., Rothe, M., Muzio, M., & Arditi, M. (1999) · Journal of Biological Chemistry · doi:10.1074/jbc.274.12.7611 · Cited by 702
Wortmannin, a potent and selective inhibitor of phosphatidylinositol-3-kinase.
Powis, G., Bonjouklian, R., Berggren, M. M., Gallegos, A. C., Abraham, R. T., Ashendel, C. L., Zalkow, L. H., Matter, W. F., Dodge, J. A., & Grindey, G. B. (1994) · PubMed · Cited by 687
Regulation of Toll-Like Receptors in Human Monocytes and Dendritic Cells
Visintin, A., Mazzoni, A., Spitzer, J. H., Wyllie, D. H., Dower, S., & Segal, D. M. (2001) · The Journal of Immunology · doi:10.4049/jimmunol.166.1.249 · Cited by 611
Laurent, T. C., & Fraser, J. R. E. (1992) · PubMed · Cited by 550
Akashi, S., Shimazu, R., Ogata, H., Nagai, Y., Takeda, K., Kimoto, M., & Miyake, K. (2000) · The Journal of Immunology · doi:10.4049/jimmunol.164.7.3471 · Cited by 459
Self-citationArdeshna, K. M., Pizzey, A. R., Devereux, S., & Khwaja, A. (2000) · Blood · doi:10.1182/blood.v96.3.1039 · Cited by 430
Poltorak, A. N., Ricciardi‐Castagnoli, P., Citterio, S., & Beutler, B. (2000) · Proceedings of the National Academy of Sciences · doi:10.1073/pnas.040565397 · Cited by 430
Inaba, K., Inaba, M., Deguchi, M., Hagi, K., Yasumizu, R., Ikehara, S., Muramatsu, S., & Steinman, R. M. (1993) · Proceedings of the National Academy of Sciences · doi:10.1073/pnas.90.7.3038 · Cited by 417
Oligosaccharides of Hyaluronan Are Potent Activators of Dendritic Cells
Termeer, C., Hennies, J., Voith, U., Ahrens, T., Weiss, J. M., Prehm, P., & Simon, J. C. (2000) · The Journal of Immunology · doi:10.4049/jimmunol.165.4.1863 · Cited by 388
Self-citationWeigel, P. H., Fuller, G. M., & LeBœuf, R. D. (1986) · Journal of Theoretical Biology · doi:10.1016/s0022-5193(86)80076-5 · Cited by 381
Kawasaki, K., Akashi, S., Shimazu, R., Yoshida, T., Miyake, K., & Nishijima, M. (2000) · Journal of Biological Chemistry · doi:10.1074/jbc.275.4.2251 · Cited by 355
Self-citationTakeuchi, O., Takeda, K., Hoshino, K., Adachi, O., Ogawa, T., & Akira, S. (2000) · International Immunology · doi:10.1093/intimm/12.1.113 · Cited by 326
Noble, P. W., McKee, C. M., Cowman, M. K., & Shin, H. S. (1996) · The Journal of Experimental Medicine · doi:10.1084/jem.183.5.2373 · Cited by 323
Coordinated events during bacteria-induced DC maturation
Rescigno, M., Granucci, F., Citterio, S., Foti, M., & Ricciardi‐Castagnoli, P. (1999) · Immunology Today · doi:10.1016/s0167-5699(98)01427-3 · Cited by 212
Role of CD14 in Cellular Recognition of Bacterial Lipopolysaccharides
Kitchens, R. L. (1999) · KARGER eBooks · doi:10.1159/000058750 · Cited by 197
Activation and interaction of CD44 and hyaluronan in immunological systems
Siegelman, M. H., DeGrendele, H. C., & Estess, P. (1999) · Journal of Leukocyte Biology · doi:10.1002/jlb.66.2.315 · Cited by 193
SLEVIN, M. A., Krupiński, J., Kumar, S., & Gaffney, J. J. (1998) · PubMed · Cited by 184
Weinstein, S. L., June, C. H., & DeFranco, A. L. (1993) · The Journal of Immunology · doi:10.4049/jimmunol.151.7.3829 · Cited by 168
Oertli, B., Beck‐Schimmer, B., Fan, X., & Wuthrich, R. P. (1998) · The Journal of Immunology · doi:10.4049/jimmunol.161.7.3431 · Cited by 147
Oertli, B., Beck‐Schimmer, B., Fan, X., & Wuthrich, R. P. (1998) · PubMed · Cited by 145
Reactive Oxygen Species Contribute to Epidermal Hyaluronan Catabolism in Human Skin Organ Culture
Ågren, U. M., Tammi, R., & Tammi, M. (1997) · Free Radical Biology and Medicine · doi:10.1016/s0891-5849(97)00098-1 · Cited by 144
Tammi, R., MacCallum, D. K., Hascall, V., Pienimäki, J., Hyttinen, M., & Tammi, M. (1998) · Journal of Biological Chemistry · doi:10.1074/jbc.273.44.28878 · Cited by 140
Waterman, W. H., Molski, T. F. P., Huang, C., Adams, J. L., & Sha'afi, R. I. (1996) · Biochemical Journal · doi:10.1042/bj3190017 · Cited by 127
Phase I trial of intravenously administered endotoxin (Salmonella abortus equi) in cancer patients.
Engelhardt, R., Mackensen, A., & Galanos, C. (1991) · PubMed · Cited by 114
Self-citationStimulation of inducible nitric oxide synthase in rat liver by hyaluronan fragments
Rockey, D. C., Chung, J. J., McKee, C. M., & Noble, P. W. (1998) · Hepatology · doi:10.1002/hep.510270115 · Cited by 99
von Leoprechting, A., van der Bruggen, P., Pahl, H. L., Aruffo, A. A., & Simon, J. C. (1999) · PubMed · Cited by 90
Self-citationChen, B.-G., Shi, Y., Smith, J. D., Choi, D., Geiger, J. D., & Mulé, J. J. (1998) · Blood · doi:10.1182/blood.v91.12.4652 · Cited by 81
Graber, M., June, C. H., Samelson, L. E., & Weiss, A. (1992) · International Immunology · doi:10.1093/intimm/4.11.1201 · Cited by 58
Penc, S. F., Pomahač, B., Eriksson, E. K., Detmar, M. J., & Gallo, R. L. (1999) · Journal of Clinical Investigation · doi:10.1172/jci4742 · Cited by 51
Hyaluronan turnover in relation to infection and sepsis
Berg, S. (1997) · Journal of Internal Medicine · doi:10.1046/j.1365-2796.1997.00177.x · Cited by 30
Langerhans cell migration is modulated by N-sulfated glucosamine moieties in heparin
O'Sullivan, G. M., Boswell, C. M., & Halliday, G. M. (2000) · Experimental Dermatology · doi:10.1034/j.1600-0625.2000.009001025.x · Cited by 13
Sonographic Diagnosis of Papillary Thyroid Carcinoma
Al-Tamami, M. A.-T., Al-Khawari, H., Al-Sayer, H. M., et al. (2000) · Medical Principles and Practice · doi:10.1159/000026116 · Cited by 1
Research works printed but not linked: 5
- 1998, Lab. Invest., 78, 987
- 2000, Chem. Immunol., 74, 61
- 1991, Cancer Res., 51, 2524
- 1999, Cancer Res., 59, 1287
- 1994, Cancer Res., 54, 2419
Cited by
Sorted by citations
Akira, S., & Takeda, K. (2004) · Nature reviews. Immunology · doi:10.1038/nri1391 · Cited by 8,312
Takeda, K., Kaisho, T., & Akira, S. (2003) · Annual Review of Immunology · doi:10.1146/annurev.immunol.21.120601.141126 · Cited by 6,143
LPS/TLR4 signal transduction pathway
Lu, Y.-C., Yeh, W.-C., & Ohashi, P. S. (2008) · Cytokine · doi:10.1016/j.cyto.2008.01.006 · Cited by 3,301
The Immunobiology of Cancer Immunosurveillance and Immunoediting
Dunn, G. P., Old, L. J., & Schreiber, R. D. (2004) · Immunity · doi:10.1016/j.immuni.2004.07.017 · Cited by 3,192
CD44: From adhesion molecules to signalling regulators
Ponta, H., Sherman, L. S., & Herrlich, P. A. (2003) · Nature Reviews Molecular Cell Biology · doi:10.1038/nrm1004 · Cited by 2,458
Metadata
- Authors
- Termeer, C., Benedix, F., Sleeman, J., Fieber, C., Voith, U., Ahrens, T., Miyake, K., Freudenberg, M., Galanos, C., & Simon, J. C.
- Affiliations
- University of Freiburg (DE)
- 2Institute for Genetics, Forschungszentrum Karlsruhe, Karlsruhe D-76021, Germany
- University of Basel (CH)
- Institute of Medical Science, The University of Tokyo (JP)
- Max Planck Society (DE)
- 3Max-Planck Institute for Immunobiology, Freiburg D-79011, Germany
- Venue
- The Journal of Experimental Medicine
- Publisher
- Rockefeller University Press
- Published
- 2002-01-07
- Volume
- 195
- Issue
- 1
- Pages
- 99-111
- ISSN
- 0022-1007 (ISSN-L)
- 1540-9538
- PMC
- PMC2196009
- OpenAlex
- W2126659405
- Semantic Scholar
- 44579905bd40557fb010b65248e3194bbd6a995d
- Cited by
- 1,378
- References
- 48
- Citations by year
- 2026: 19 · 2025: 29 · 2024: 28 · 2023: 28 · 2022: 32 · 2021: 54 · 2020: 46 · 2019: 40 · 2018: 40 · 2017: 41 · 2016: 54 · 2015: 59 · 2014: 71 · 2013: 61 · 2012: 69
- FWCI
- 18.95
- Type
- journal article
- Language
- en
- Open access
- green
- www.ncbi.nlm.nih.gov
- Licence
- cc-by-nc-sa
- Locations
- The Journal of Experimental Medicine (publishedVersion)
- PubMed Central (publishedVersion, cc-by-nc-sa)
- PubMed (publishedVersion)
- Max Planck Digital Library (submittedVersion)
- FreiDok plus (Universitätsbibliothek Freiburg) (submittedVersion)
- MPG.PuRe (Max Planck Society) (submittedVersion)
- Topics
- Life Sciences › Immunology and Microbiology › Immunology › Immune Response and Inflammation
- Life Sciences › Biochemistry, Genetics and Molecular Biology › Cell Biology › Proteoglycans and glycosaminoglycans research
- Life Sciences › Immunology and Microbiology › Immunology › Immunotherapy and Immune Responses
- Keywords
- hyaluronic acid, oligosaccharides, dendritic cell maturation, TLR4, TLR2, innate immunity, endogenous ligands, MAPK signaling, TNF-α, extracellular matrix degradation, inflammation
- MeSH terms
- Animals, Cell Differentiation, Dendritic Cells, Female, Humans, Hyaluronic Acid, Membrane Glycoproteins, Mice, Inbred C3H, Mice, Inbred C57BL, Oligosaccharides, Receptors, Cell Surface, Tumor Necrosis Factor-alpha, Signal Transduction, Down-Regulation, NF-kappa B, Mitogen-Activated Protein Kinases, Drosophila Proteins, Toll-Like Receptors, Toll-Like Receptor 2, Toll-Like Receptor 4, Mice
About these checks
Registry, retraction, Cites and statistics results are computed, not judged, with one exception: a printed reference that no index lists is read once by a model before it counts as a citation error. Claims are extracted by a model and kept only when their quote appears verbatim in the text; each cited source is then checked, with a model’s help, for whether it says what the claim relies on. Those verdicts can be wrong — read the claim’s quote and the cited source before relying on one.
Statistics and arithmetic are recomputed, not judged.
Confidence bands are shown only for fields calibrated on our annotated test set. None is calibrated yet, so no band is shown.
What counts as a claim ›How we measure confidence ›How we check this ›
Are you an author, or do you see a problem with this page? Request a review
