Cited by 322Celiac Disease Research and ManagementImmune Cell Function and InteractionT-cell and B-cell Immunology

The DOI matches its Crossref record; 70 of the 70 references it cites were found in a registry or an index.

Reprogramming of CTLs into natural killer–like cells in celiac disease

Open access

Abstract

Celiac disease is an intestinal inflammatory disorder induced by dietary gluten in genetically susceptible individuals. The mechanisms underlying the massive expansion of interferon γ–producing intraepithelial cytotoxic T lymphocytes (CTLs) and the destruction of the epithelial cells lining the small intestine of celiac patients have remained elusive. We report massive oligoclonal expansions of intraepithelial CTLs that exhibit a profound genetic reprogramming of natural killer (NK) functions. These CTLs aberrantly expressed cytolytic NK lineage receptors, such as NKG2C, NKp44, and NKp46, which associate with adaptor molecules bearing immunoreceptor tyrosine-based activation motifs and induce ZAP-70 phosphorylation, cytokine secretion, and proliferation independently of T cell receptor signaling. This NK transformation of CTLs may underlie both the self-perpetuating, gluten-independent tissue damage and the uncontrolled CTL expansion leading to malignant lymphomas in severe forms of celiac disease. Because similar changes were detected in a subset of CTLs from cytomegalovirus-seropositive patients, we suggest that a stepwise transformation of CTLs into NK-like cells may underlie immunopathology in various chronic infectious and inflammatory diseases.

Overview

The claims and statistics of this paper haven’t been checked yet.

Run the check — free, no account needed. It reads the open-access text and checks the sources it cites.

A few free checks a day · papers already verified open instantly · results are public

Integrity signals

Registry

Crossref · 10.1084/jem.20060028

Cites

70 of 70 references verified0 citation errors · 0 not checkable

Statistics

Figures

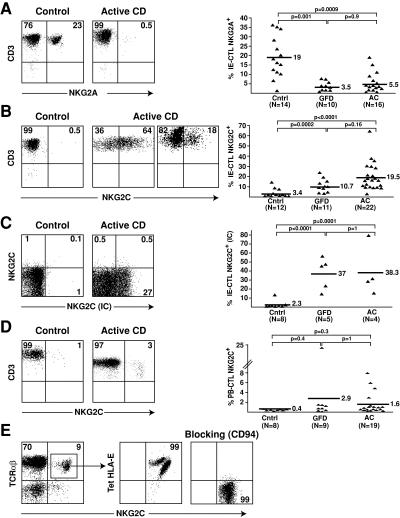
Figure 1. Selective expansion of IE-CTLs expressing activating CD94/NKG2C receptors in celiac disease. Representative flow cytometric data on freshly isolated TCR-αβ+CD8+ IE-CTLs or PB-CTLs from normal controls (Cntrl), AC patients, and celiac patients on a GFD are shown in the right panels. A scatter plot graph summarizing all samples investigated is shown on the right in A–D. (A) Decreased frequency of IE-CTLs expressing inhibitory CD94/NKG2A receptors in AC patients and GFD patients. (B) Increased frequency of IE-CTLs expressing surface CD94/NKG2C receptors in AC patients and GFD compared with controls. (C) Increased frequency of IE-CTLs expressing intracellular NKG2C protein (NKG2C IC) in AC patients and GFD compared with controls. (D) Propensity toward an increased frequency of PB-CTLs expressing surface CD94/NKG2C receptors in AC patients and GFD compared with controls. (E) CD94-dependent HLA-E recognition by CD94/NKG2C+ CTLs. A representative example of HLA-E staining on gated TCR-αβ+CD8+ NKG2C+ CTLs is shown on freshly isolated PBLs. Left panel shows that incubation with anti-CD94 antibody before incubation with a HLA-E tetramer prevents staining with the HLA-E tetramer.
Figure 1. Selective expansion of IE-CTLs expressing activating CD94/NKG2C receptors in celiac disease. Representative flow cytometric data on freshly isolated TCR-αβ+CD8+ IE-CTLs or PB-CTLs from normal controls (Cntrl), AC patients, and celiac patients on a GFD are shown in the right panels. A scatter plot graph summarizing all samples investigated is shown on the right in A–D. (A) Decreased frequency of IE-CTLs expressing inhibitory CD94/NKG2A receptors in AC patients and GFD patients. (B) Increased frequency of IE-CTLs expressing surface CD94/NKG2C receptors in AC patients and GFD compared with controls. (C) Increased frequency of IE-CTLs expressing intracellular NKG2C protein (NKG2C IC) in AC patients and GFD compared with controls. (D) Propensity toward an increased frequency of PB-CTLs expressing surface CD94/NKG2C receptors in AC patients and GFD compared with controls. (E) CD94-dependent HLA-E recognition by CD94/NKG2C+ CTLs. A representative example of HLA-E staining on gated TCR-αβ+CD8+ NKG2C+ CTLs is shown on freshly isolated PBLs. Left panel shows that incubation with anti-CD94 antibody before incubation with a HLA-E tetramer prevents staining with the HLA-E tetramer.CC BY-NC-SA · PubMed Central
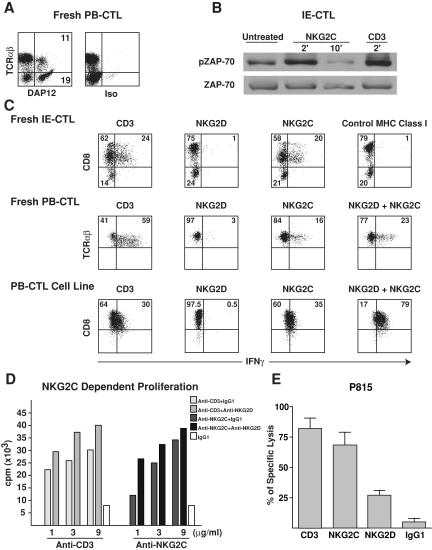
Figure 2. Expression of functional CD94/NKG2C/DAP12 immunoreceptor complexes by celiac CTLs. (A) A representative intracellular DAP12 staining in TCR-αβ T cells is shown on celiac PB-CTLs. Similar results were obtained with freshly purified celiac NKG2C+ IE-CTLs and IE-CTL clones as well as NKG2C+ PB-CTLs from a CMV-seropositive individual. (B) Ligation of NKG2C, similarly to CD3, induced ZAP-70 phosphorylation in NKG2C+ IE-CTLs. Staining with total anti–ZAP-70 mAb demonstrates equal loading. (C and D) NKG2D costimulates NKG2C-mediated cytokine secretion and proliferation. Fresh NKG2C+ CTLs and NKG2C+ CTL lines and clones were incubated with plate-bound mAb, and IFN-γ secretion (C) and proliferation (D) were determined by flow cytometry or [3H]thymidine uptake, respectively. Experiments were performed in triplicate, and error bars were <10%. Representative examples of three independent experiments are shown. Of interest, CD8 was down-regulated upon TCR and NKG2C, but not NKG2D, stimulation in freshly isolated IE-CTLs. (E) Anti-NKG2C, similarly to anti-CD3 cross-linking, induced redirected lysis of P815 target cells by NKG2C+ IE-CTL and PB-CTL clones. In all the clones tested, NKG2C was always more efficient in inducing lysis of P815 targets than NKG2D. In contrast, cross-linking with isotype-matched control mAb was ineffective. A representative experiment using four NKG2C+ IE-CTL clones from the same patient is shown.
Figure 2. Expression of functional CD94/NKG2C/DAP12 immunoreceptor complexes by celiac CTLs. (A) A representative intracellular DAP12 staining in TCR-αβ T cells is shown on celiac PB-CTLs. Similar results were obtained with freshly purified celiac NKG2C+ IE-CTLs and IE-CTL clones as well as NKG2C+ PB-CTLs from a CMV-seropositive individual. (B) Ligation of NKG2C, similarly to CD3, induced ZAP-70 phosphorylation in NKG2C+ IE-CTLs. Staining with total anti–ZAP-70 mAb demonstrates equal loading. (C and D) NKG2D costimulates NKG2C-mediated cytokine secretion and proliferation. Fresh NKG2C+ CTLs and NKG2C+ CTL lines and clones were incubated with plate-bound mAb, and IFN-γ secretion (C) and proliferation (D) were determined by flow cytometry or [3H]thymidine uptake, respectively. Experiments were performed in triplicate, and error bars were <10%. Representative examples of three independent experiments are shown. Of interest, CD8 was down-regulated upon TCR and NKG2C, but not NKG2D, stimulation in freshly isolated IE-CTLs. (E) Anti-NKG2C, similarly to anti-CD3 cross-linking, induced redirected lysis of P815 target cells by NKG2C+ IE-CTL and PB-CTL clones. In all the clones tested, NKG2C was always more efficient in inducing lysis of P815 targets than NKG2D. In contrast, cross-linking with isotype-matched control mAb was ineffective. A representative experiment using four NKG2C+ IE-CTL clones from the same patient is shown.CC BY-NC-SA · PubMed Central
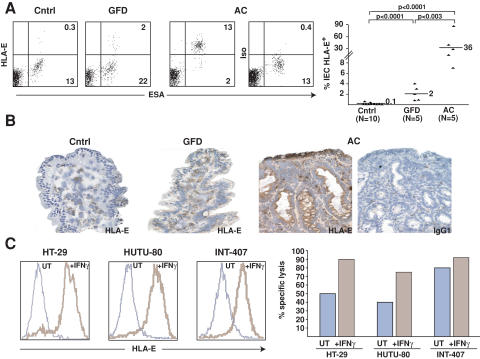
Figure 3. HLA-E up-regulation in celiac enterocytes and killing of HLA-E+ enterocytes by celiac CTLs. (A) Flow cytometric analysis of freshly isolated enterocytes (ESA+) from AC patients shows surface HLA-E expression. The scatter plot summarizes the percentage of HLA-E+ enterocytes in control (Cntrl), GFD, and AC patients. (B) Immunohistochemical analysis of HLA-E expression in enterocytes of AC, GFD and control patients. A representative example out of five is shown. (C) HLA-E expression by enterocytes cultured overnight in medium alone (UT) or with IFN-γ was determined by flow cytometry using anti–HLA-E mAb (brown line) or isotype control (blue line). Note that HLA-E was expressed significantly only after stimulation with IFN-γ in the three enterocyte lines tested. Interestingly, specific killing of 51Cr-labeled enterocyte lines by IE-CTL lines was increased when enterocytes were preincubated with IFN-γ.
Figure 3. HLA-E up-regulation in celiac enterocytes and killing of HLA-E+ enterocytes by celiac CTLs. (A) Flow cytometric analysis of freshly isolated enterocytes (ESA+) from AC patients shows surface HLA-E expression. The scatter plot summarizes the percentage of HLA-E+ enterocytes in control (Cntrl), GFD, and AC patients. (B) Immunohistochemical analysis of HLA-E expression in enterocytes of AC, GFD and control patients. A representative example out of five is shown. (C) HLA-E expression by enterocytes cultured overnight in medium alone (UT) or with IFN-γ was determined by flow cytometry using anti–HLA-E mAb (brown line) or isotype control (blue line). Note that HLA-E was expressed significantly only after stimulation with IFN-γ in the three enterocyte lines tested. Interestingly, specific killing of 51Cr-labeled enterocyte lines by IE-CTL lines was increased when enterocytes were preincubated with IFN-γ.CC BY-NC-SA · PubMed Central
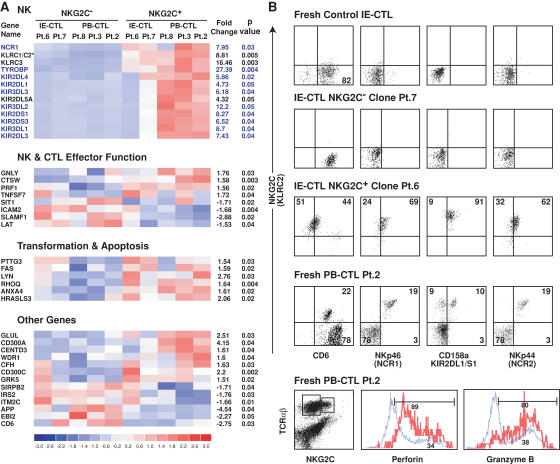
Figure 4. NK reprogramming in NKG2C+ CTLs. (A) The 40 significant genes obtained by global pairwise microarray analysis of NKG2C+ and NKG2C− IE-CTL and PB-CTL clones generated from four celiac patients and one CMV-seropositive patient are illustrated. 27 of the 40 genes could be clustered into three distinct groups based on their associated function. The remaining 13 genes are listed under “Other Genes.” On the left hand side of the cluster analysis is the gene name as designated by HGNC. An asterisk (*) indicates the inability of the GeneChip to distinguish between the two genes (KLRC1 and KLRC2). However, based on data presented in Fig. 1 and analysis of NKG2A and NKG2C transcripts by RT-PCR using specific primers, this gene was identified as KLRC2 (NKG2C). On the right hand side of the cluster analysis, the fold change between the NKG2C+ and NKG2C− populations is shown along with the p-value for a paired t test. Of interest, 10 out of 13 genes in the NK cluster (highlighted in blue) are all located within the NK receptor cluster on chromosome 19q13. (B) This panel highlights the phenotypic correlation of the microarray data by multicolor flow cytometry. Representative dot plots of NKp46 (NCR1), CD158a (KIR2DL1/KIR2DS1), and CD6 expression gated on TCR-αβ+ NKG2C+ populations from fresh normal IE-CTLs, NKG2C+ and NKG2C− IE-CTL clones, and fresh PB-CTLs from a CMV-seropositive patient are shown. Because CD6 expression in the NKG2C− CTL subset of patient 2 (Pt.2) was high, the compensation criteria were distinct from those used with the NK receptors NKp46, CD158a, and NKp44. This resulted in a lower level of NKG2C staining when anti-NKG2C antibody was associated with anti-CD6 antibody. Interestingly, NKG2C+ but not NKG2C− CTLs also express NKp44 (NCR2), a result that was not anticipated by microarray analysis. In addition, NKG2C+ CTLs (in red) show increased expression of both perforin and granzyme B compared with NKG2C− CTLs (in blue), as suggested by the microarray analysis.
Figure 4. NK reprogramming in NKG2C+ CTLs. (A) The 40 significant genes obtained by global pairwise microarray analysis of NKG2C+ and NKG2C− IE-CTL and PB-CTL clones generated from four celiac patients and one CMV-seropositive patient are illustrated. 27 of the 40 genes could be clustered into three distinct groups based on their associated function. The remaining 13 genes are listed under “Other Genes.” On the left hand side of the cluster analysis is the gene name as designated by HGNC. An asterisk (*) indicates the inability of the GeneChip to distinguish between the two genes (KLRC1 and KLRC2). However, based on data presented in Fig. 1 and analysis of NKG2A and NKG2C transcripts by RT-PCR using specific primers, this gene was identified as KLRC2 (NKG2C). On the right hand side of the cluster analysis, the fold change between the NKG2C+ and NKG2C− populations is shown along with the p-value for a paired t test. Of interest, 10 out of 13 genes in the NK cluster (highlighted in blue) are all located within the NK receptor cluster on chromosome 19q13. (B) This panel highlights the phenotypic correlation of the microarray data by multicolor flow cytometry. Representative dot plots of NKp46 (NCR1), CD158a (KIR2DL1/KIR2DS1), and CD6 expression gated on TCR-αβ+ NKG2C+ populations from fresh normal IE-CTLs, NKG2C+ and NKG2C− IE-CTL clones, and fresh PB-CTLs from a CMV-seropositive patient are shown. Because CD6 expression in the NKG2C− CTL subset of patient 2 (Pt.2) was high, the compensation criteria were distinct from those used with the NK receptors NKp46, CD158a, and NKp44. This resulted in a lower level of NKG2C staining when anti-NKG2C antibody was associated with anti-CD6 antibody. Interestingly, NKG2C+ but not NKG2C− CTLs also express NKp44 (NCR2), a result that was not anticipated by microarray analysis. In addition, NKG2C+ CTLs (in red) show increased expression of both perforin and granzyme B compared with NKG2C− CTLs (in blue), as suggested by the microarray analysis.CC BY-NC-SA · PubMed Central
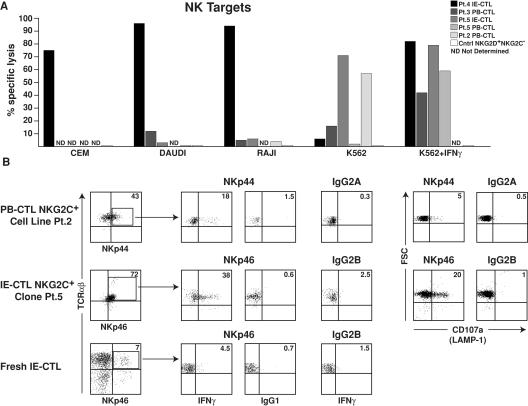
Figure 5. NKG2C+ CTLs kill NK targets and express functional Nkp44 and NKp46 receptors. (A) Cytolytic activity of five NKG2C+ CTL clones and one NKG2C−NKG2D+ CTL clone used as control against 51Cr-labeled NK targets, CEM, DAUDI, RAJI, and K562 is shown at an E/T ratio of 50:1. Note that different NKG2C+ CTL clones, similarly to what is observed with NK cells, display distinct pattern of target cell lysis. Interestingly, IFN-γ treatment of K562 augmented their killing by NKG2C+ CTL clones. ND, not determined. Experiments were performed in triplicate, and error bars were <10%. (B) NKG2C+ PB-CTLs and IE-CTLs were incubated with 5 μg/ml plate-bound antibody or isotype control as indicated. IFN-γ production was assessed after overnight stimulation by intracellular flow cytometric analysis, and degranulation of cytolytic granules was determined by analysis of surface CD107a expression upon 4 h of stimulation.
Figure 5. NKG2C+ CTLs kill NK targets and express functional Nkp44 and NKp46 receptors. (A) Cytolytic activity of five NKG2C+ CTL clones and one NKG2C−NKG2D+ CTL clone used as control against 51Cr-labeled NK targets, CEM, DAUDI, RAJI, and K562 is shown at an E/T ratio of 50:1. Note that different NKG2C+ CTL clones, similarly to what is observed with NK cells, display distinct pattern of target cell lysis. Interestingly, IFN-γ treatment of K562 augmented their killing by NKG2C+ CTL clones. ND, not determined. Experiments were performed in triplicate, and error bars were <10%. (B) NKG2C+ PB-CTLs and IE-CTLs were incubated with 5 μg/ml plate-bound antibody or isotype control as indicated. IFN-γ production was assessed after overnight stimulation by intracellular flow cytometric analysis, and degranulation of cytolytic granules was determined by analysis of surface CD107a expression upon 4 h of stimulation.CC BY-NC-SA · PubMed Central
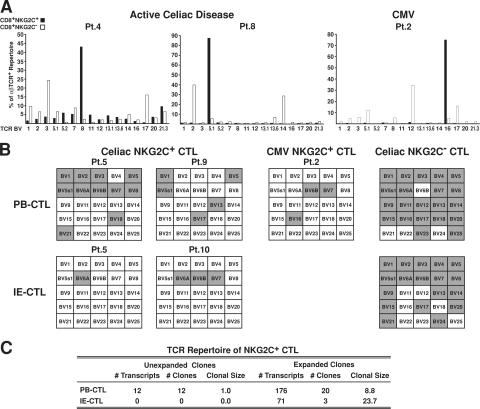
Figure 6. NKG2C+ CTLs display a highly restricted TCR repertoire. (A) TCR-β chain repertoire analysis of CD8+ NKG2C+ and NKG2C− populations from two AC disease samples and one PB-CTL sample from a CMV-seropositive patient by flow cytometry is shown. Results are expressed as percentages of TCR-β chain+ cells among CD8+TCR-αβ+ T cells. (B) TCR-β chain repertoire analysis by RT-PCR analysis of representative PB-CTL and IE-CTL samples from AC patients, PB-CTLs from a CMV-seropositive patient, and representative CD94+ NKG2C− control CTL samples matched for the effector/memory status (expression of CD45 RO and RA, CCR7, CD62L, and capacity to mediate TCR cytolysis). The TCR repertoire is represented by a grid that contains 25 separate boxes, each signifying a TCR-β chain variable region (BV) gene family (BV1-BV25). Gray shaded boxes indicate that the corresponding TCR BV gene is expressed. Patient 5 (Pt.5) has paired PB-CTL and IE-CTL samples obtained at the same time. Notably, patient 2 (Pt.2) illustrates that a similar result was obtained by both flow cytometry and RT-PCR. TCR nomenclature is designated by Arden et al. (reference 66). (C) This panel summarizes the 295 β chain nucleotide sequences obtained by sequencing 10 TCR BV families from three PB-CTL and two IE-CTL celiac samples. The CTL populations are represented by both the number of transcripts (TCR-β chain sequences) and the number of clones. Expanded clones contain two or more identical β chain sequences, whereas clonal size represents the average number of sequences per clone.
Figure 6. NKG2C+ CTLs display a highly restricted TCR repertoire. (A) TCR-β chain repertoire analysis of CD8+ NKG2C+ and NKG2C− populations from two AC disease samples and one PB-CTL sample from a CMV-seropositive patient by flow cytometry is shown. Results are expressed as percentages of TCR-β chain+ cells among CD8+TCR-αβ+ T cells. (B) TCR-β chain repertoire analysis by RT-PCR analysis of representative PB-CTL and IE-CTL samples from AC patients, PB-CTLs from a CMV-seropositive patient, and representative CD94+ NKG2C− control CTL samples matched for the effector/memory status (expression of CD45 RO and RA, CCR7, CD62L, and capacity to mediate TCR cytolysis). The TCR repertoire is represented by a grid that contains 25 separate boxes, each signifying a TCR-β chain variable region (BV) gene family (BV1-BV25). Gray shaded boxes indicate that the corresponding TCR BV gene is expressed. Patient 5 (Pt.5) has paired PB-CTL and IE-CTL samples obtained at the same time. Notably, patient 2 (Pt.2) illustrates that a similar result was obtained by both flow cytometry and RT-PCR. TCR nomenclature is designated by Arden et al. (reference 66). (C) This panel summarizes the 295 β chain nucleotide sequences obtained by sequencing 10 TCR BV families from three PB-CTL and two IE-CTL celiac samples. The CTL populations are represented by both the number of transcripts (TCR-β chain sequences) and the number of clones. Expanded clones contain two or more identical β chain sequences, whereas clonal size represents the average number of sequences per clone.CC BY-NC-SA · PubMed Central

Verification

Claims the paper makes

The claims and statistics of this paper haven’t been checked yet.

Run the check — free, no account needed. It reads the open-access text and checks the sources it cites.

A few free checks a day · papers already verified open instantly · results are public

Claims other papers make about this one

Each is checked against this paper’s own text: does it say what the citing paper says it does?

Self-check

Percentages, sums and reported differences re-computed from the paper’s own numbers.

The self-check needs the paper’s full text.

Citations

Cites

Show all 68 references

Research works printed but not linked: 4

  1. 2006, Curr. Top. Microbiol. Immunol., 298, 139
  2. 2004, Blood., 104, 3664
  3. 1995, Immunogenetics., 42, 455
  4. 2005, Nucleic Acids Res., 33, D593

Cited by

Sorted by citations

See all 322

Metadata

Authors
Meresse, B., Curran, S. A., Ciszewski, C., Orbelyan, G., Setty, M., Bhagat, G., Lee, L., Tretiakova, M., Semrad, C., Kistner, E., Winchester, R. J., Braud, V., Lanier, L. L., Geraghty, D. E., Green, P. H., Guandalini, S., & Jabri, B.
Affiliations
  • 1Department of Pathology,
  • 2Department of Pediatrics,
  • 6Department of Pathology, and
  • 3Department of Medicine, and
  • University of Chicago (US)
  • 5Division of Autoimmune and Molecular Diseases,
  • 8Institut de Pharmacologie Moleculaire et Cellulaire, Centre National de la Recherche Scientifique/Université de Nice-Sophia Antipolis, UMR6097, 06560 Valbonne, France
  • University of California, San Francisco (US)
  • Fred Hutch Cancer Center (US)
  • Columbia University (US)
Venue
The Journal of Experimental Medicine
Published
2006-05-08
Volume
203
Issue
5
Pages
1343-1355
ISSN
  • 0022-1007 (ISSN-L)
  • 1540-9538
OpenAlex
W2128452798
Cited by
322
References
68
Citations by year
2026: 8 · 2025: 12 · 2024: 22 · 2023: 13 · 2022: 10 · 2021: 27 · 2020: 16 · 2019: 13 · 2018: 12 · 2017: 12 · 2016: 13 · 2015: 14 · 2014: 15 · 2013: 16 · 2012: 16
FWCI
21.13
Type
journal article
Language
en
Open access
Locations
  • The Journal of Experimental Medicine (publishedVersion)
  • Europe PMC (PubMed Central) (publishedVersion, cc-by-nc-sa)
  • PubMed Central (publishedVersion, cc-by-nc-sa)
  • PubMed (publishedVersion)
  • HAL (submittedVersion)
  • eScholarship (California Digital Library) (submittedVersion)
Funders
  • National Cancer Institute (R01 CA89294, R01CA089294)
  • National Institute of Diabetes and Digestive and Kidney Diseases (R01DK058727, R01DK58727, R01DK063158)
Topics
  • Health Sciences › Medicine › Gastroenterology › Celiac Disease Research and Management
  • Life Sciences › Immunology and Microbiology › Immunology › Immune Cell Function and Interaction
  • Life Sciences › Immunology and Microbiology › Immunology › T-cell and B-cell Immunology
Keywords
celiac disease, cytotoxic T lymphocytes, NKG2C, NKp44, NKp46, ZAP-70, interferon-gamma, intraepithelial lymphocytes, cytomegalovirus, lymphoma, intestinal epithelial damage, chronic inflammation, immunopathology
MeSH terms
Base Sequence, Celiac Disease, Cell Differentiation, Chronic Disease, Cytomegalovirus Infections, Gene Expression Regulation, Humans, Interferon-gamma, Intestinal Mucosa, Intestine, Small, Killer Cells, Natural, Lymphoma, Molecular Sequence Data, Phosphorylation, Protein Processing, Post-Translational, Receptors, Immunologic, T-Lymphocytes, Cytotoxic, Signal Transduction, Gene Expression Profiling, Cell Proliferation, ZAP-70 Protein-Tyrosine Kinase

About these checks

Registry, retraction, Cites and statistics results are computed, not judged, with one exception: a printed reference that no index lists is read once by a model before it counts as a citation error. Claims are extracted by a model and kept only when their quote appears verbatim in the text; each cited source is then checked, with a model’s help, for whether it says what the claim relies on. Those verdicts can be wrong — read the claim’s quote and the cited source before relying on one.

Statistics and arithmetic are recomputed, not judged.

Confidence bands are shown only for fields calibrated on our annotated test set. None is calibrated yet, so no band is shown.

What counts as a claim ›How we measure confidence ›How we check this ›

Are you an author, or do you see a problem with this page? Request a review