

The DOI matches its Crossref record; 43 of the 43 references it cites were found in a registry or an index.
Pyroptosis triggers pore-induced intracellular traps (PITs) that capture bacteria and lead to their clearance by efferocytosis
Open accessAbstract
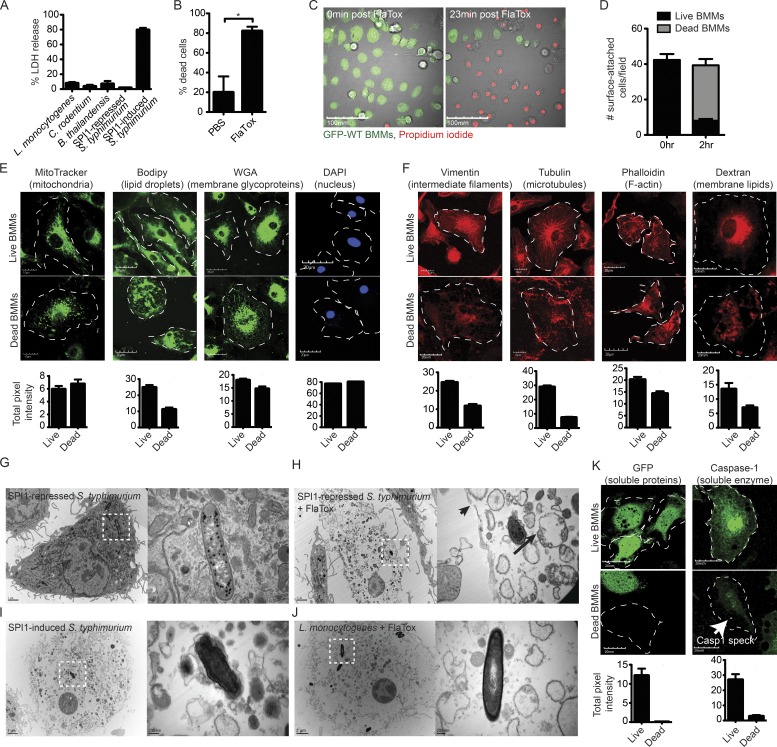
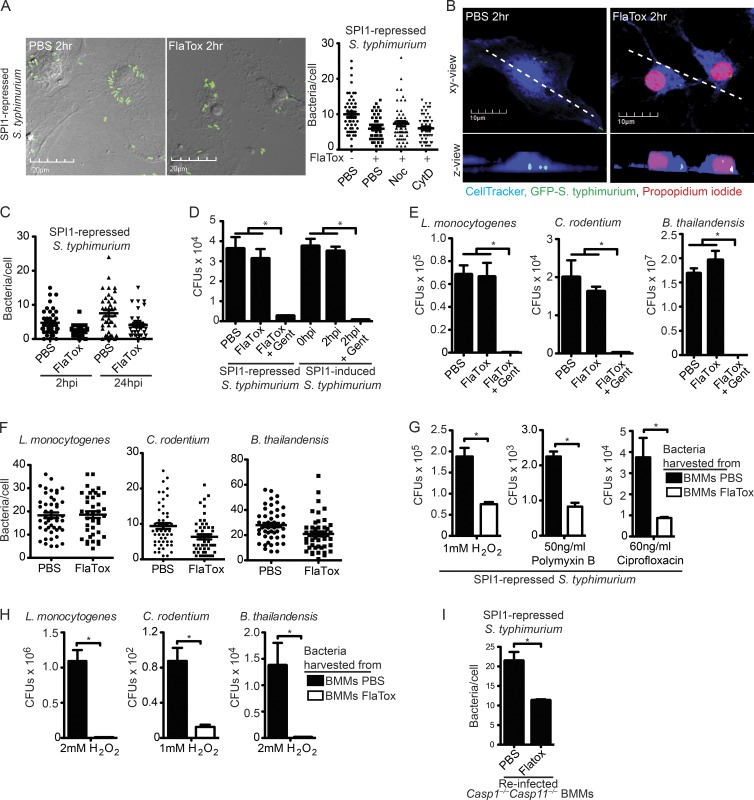
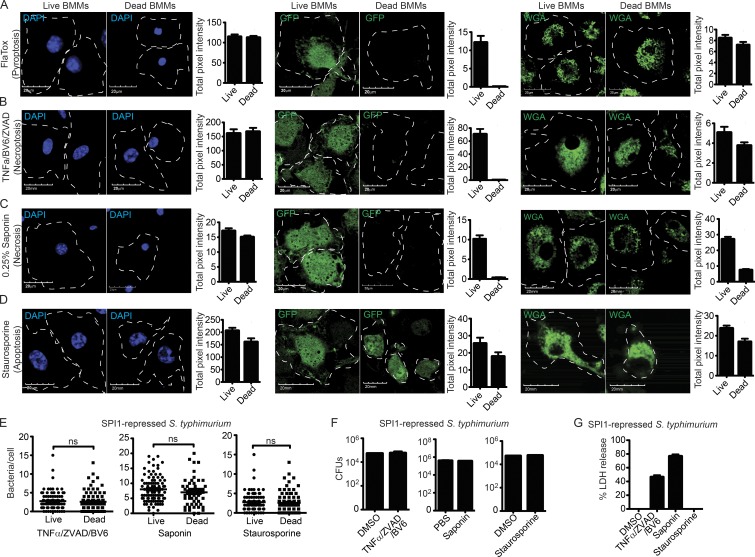
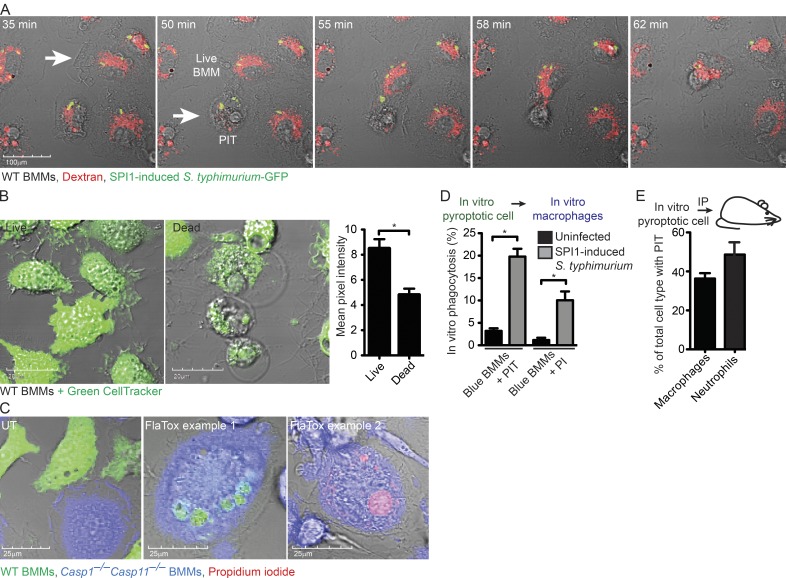
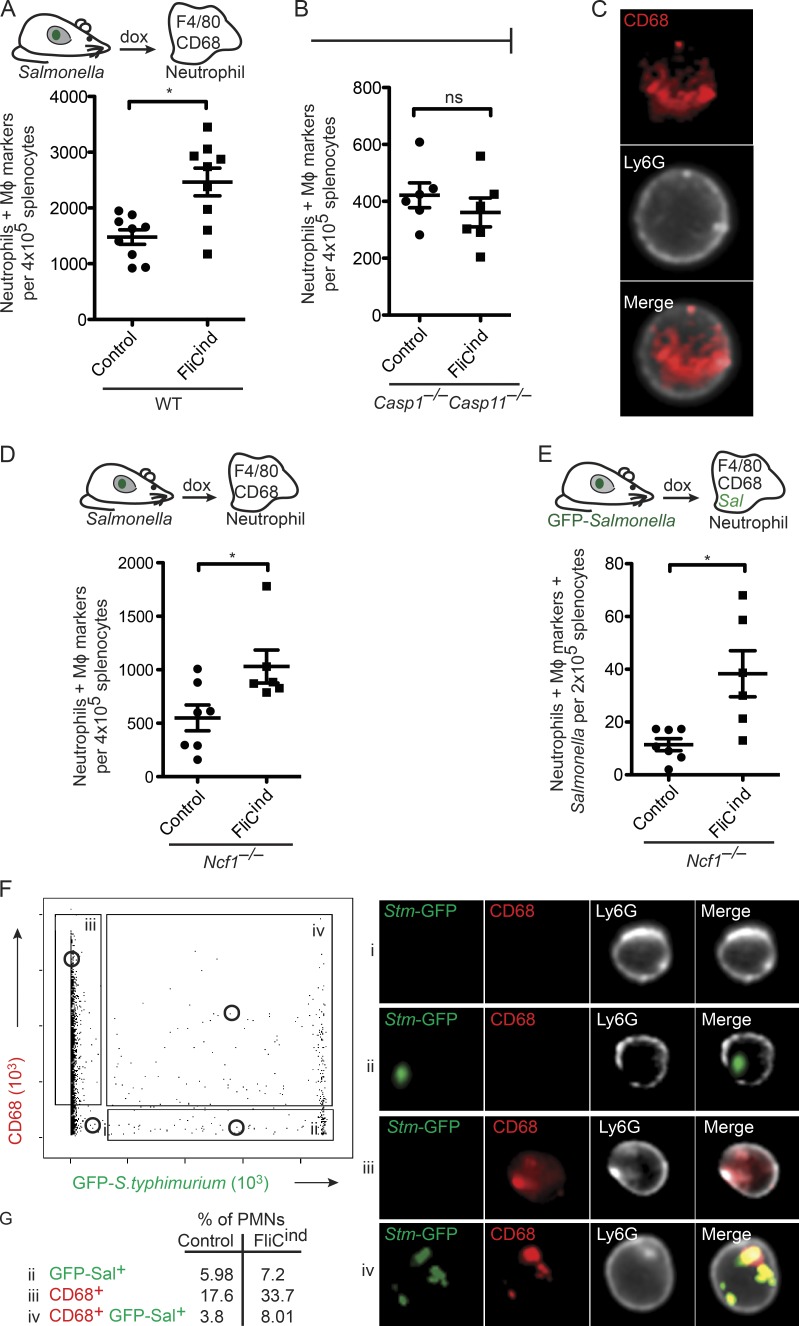
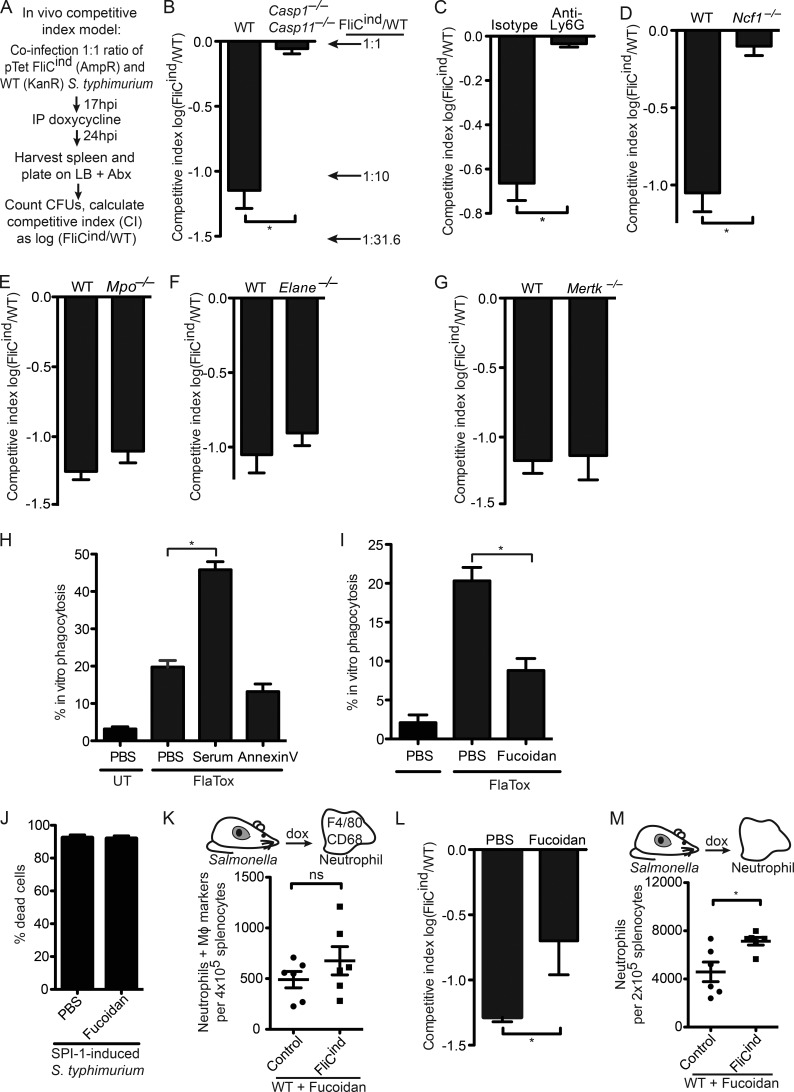
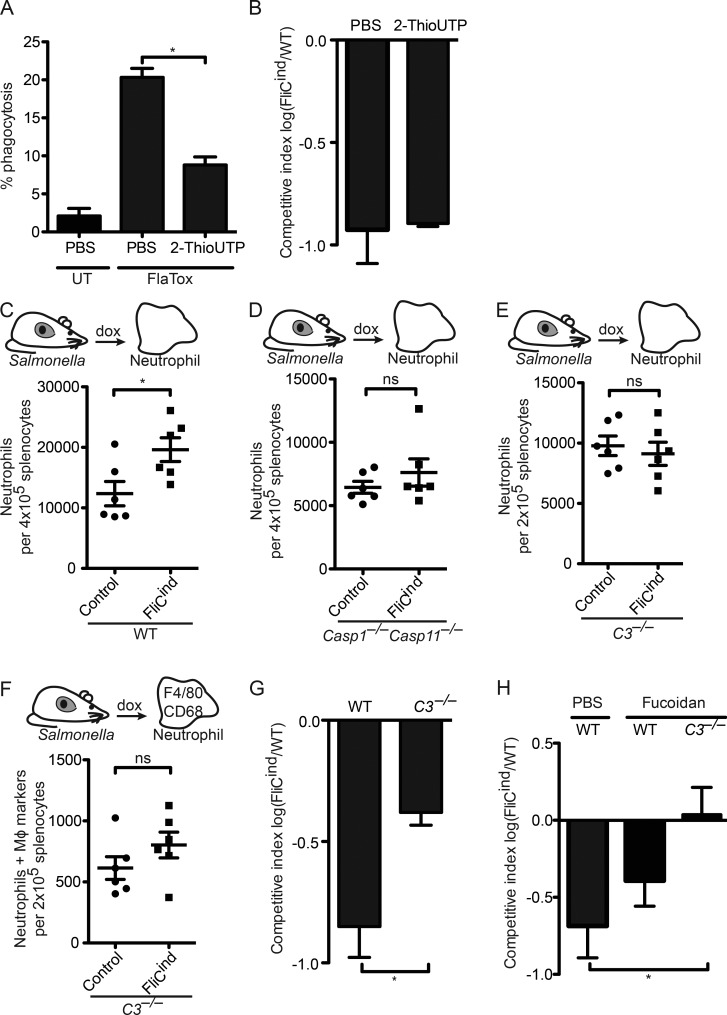
Inflammasomes activate caspase-1 in response to cytosolic contamination or perturbation. This inflammatory caspase triggers the opening of the GSDMD pore in the plasma membrane, resulting in lytic cell death called pyroptosis. We had previously assumed that pyroptosis releases intracellular bacteria to the extracellular space. Here, we find that viable bacteria instead remain trapped within the cellular debris of pyroptotic macrophages. This trapping appears to be an inevitable consequence of how osmotic lysis ruptures the plasma membrane, and may also apply to necroptosis and some forms of nonprogrammed necrosis. Although membrane tears release soluble cytosolic contents, they are small enough to retain organelles and bacteria. We call this structure the pore-induced intracellular trap (PIT), which is conceptually parallel to the neutrophil extracellular trap (NET). The PIT coordinates innate immune responses via complement and scavenger receptors to drive recruitment of and efferocytosis by neutrophils. Ultimately, this secondary phagocyte kills the bacteria. Hence, caspase-1–driven pore-induced cell death triggers a multifaceted defense against intracellular bacteria facilitated by trapping the pathogen within the cellular debris. Bona fide intracellular bacterial pathogens, such as Salmonella, must prevent or delay pyroptosis to avoid being trapped in the PIT and subsequently killed by neutrophils.
Overview
The claims and statistics of this paper haven’t been checked yet.
Run the check — free, no account needed. It reads the open-access text and checks the sources it cites.
Integrity signals
Registry
Cites
Statistics
Figures
Verification
Claims the paper makes
The claims and statistics of this paper haven’t been checked yet.
Run the check — free, no account needed. It reads the open-access text and checks the sources it cites.
Claims other papers make about this one
Each is checked against this paper’s own text: does it say what the citing paper says it does?
In the citing paper
“CASP1-driven pyroptosis limits the spreading of intracellular bacteria by (1) killing the host cell [637], and (2) generating so-called “pore-induced intracellular traps (PITs)”, which essentially are dead macrophages that can be efficiently disposed of (together with the living bacteria they trap) by efferocytosis [638].”
From Molecular mechanisms of cell death: recommendations of the nomenclature committee on cell death 2018. (2018) · cites this paper as [638]
Self-check
Percentages, sums and reported differences re-computed from the paper’s own numbers.
The self-check needs the paper’s full text.
Citations
Cites
Apoptosis: A Review of Programmed Cell Death
Elmore, S. (2007) · Toxicologic Pathology · doi:10.1080/01926230701320337 · Cited by 13,853
Neutrophil Extracellular Traps Kill Bacteria
Brinkmann, V., Reichard, U., Goosmann, C., Fauler, B., Uhlemann, Y., Weiss, D. S., Weinrauch, Y., & Zychlinsky, A. (2004) · Science · doi:10.1126/science.1092385 · Cited by 10,268
Meijer, L., Nelson, D. J., Riazanski, V., Gabdoulkhakova, A. G., Héry-Arnaud, G., Berre, R. L., Loaëc, N., Oumata, N., Galons, H., Nowak, E., et al. (2016) · Journal of Innate Immunity · doi:10.1159/000444256 · Cited by 5,008
Classification of cell death: recommendations of the Nomenclature Committee on Cell Death 2009
Kroemer, G., Galluzzi, L., Vandenabeele, P., Abrams, J., Alnemri, E. S., Baehrecke, E. H., Blagosklonny, M. V., El-Deiry, W. S., Golstein, P., Green, D. R., et al. (2009) · Cell Death & Differentiation · doi:10.1038/cdd.2008.150 · Cited by 3,399
Altered Cytokine Export and Apoptosis in Mice Deficient in Interleukin-1β Converting Enzyme
Kuida, K., Lippke, J. A., Ku, G., Harding, M. W., Livingston, D. J., Su, M. S. S., & Flavell, R. A. (1995) · Science · doi:10.1126/science.7535475 · Cited by 1,631
Pro-inflammatory programmed cell death
Cookson, B. T., & Brennan, M. A. (2001) · Trends in Microbiology · doi:10.1016/s0966-842x(00)01936-3 · Cited by 1,422
Caspase-1-induced pyroptosis is an innate immune effector mechanism against intracellular bacteria
Miao, E. A., Leaf, I. A., Treuting, P. M., Mao, D. P., Dors, M., Sarkar, A., Warren, S. E., Wewers, M. D., & Aderem, A. (2010) · Nature Immunology · doi:10.1038/ni.1960 · Cited by 1,336
Self-citationThe NLRC4 inflammasome receptors for bacterial flagellin and type III secretion apparatus
Zhao, Y., Yang, J., Shi, J., Gong, Y., Lu, Q., Xu, H., Liu, L., & Shao, F. (2011) · Nature · doi:10.1038/nature10510 · Cited by 1,310
Shigella flexneri induces apoptosis in infected macrophages
Zychlinsky, A., Prévost, M., & Sansonetti, P. (1992) · Nature · doi:10.1038/358167a0 · Cited by 1,259
Neutrophil Extracellular Traps: Double-Edged Swords of Innate Immunity
Kaplan, M. J., & Radic, M. Z. (2012) · The Journal of Immunology · doi:10.4049/jimmunol.1201719 · Cited by 1,214
Cited by
Sorted by citations
Items 301–400 of 403
Ha, K. (2023) · Experimental & Molecular Medicine · doi:10.1038/s12276-023-01083-0 · Cited by 5
Wu, L., Li, C., Qiao, L., Li, L., Zhang, S., Wang, B., Sun, Y., Qiu, J., Huang, B., Qiao, X., et al. (2026) · Cell Reports · doi:10.1016/j.celrep.2025.116918 · Cited by 4
Tian, L., Piao, S., Li, X., Guo, L., Huang, L., & Gao, W. (2025) · Advanced Science · doi:10.1002/advs.202500873 · Cited by 4
Lu, F., Mai, Z., Zhang, L., Luo, H., Wang, L., Li, S., & Zhong, M. (2025) · Molecular Neurobiology · doi:10.1007/s12035-025-04931-4 · Cited by 4
Krajewski, P. K., Tsoukas, M. M., & Szepietowski, J. C. (2024) · Current Issues in Molecular Biology · doi:10.3390/cimb46010043 · Cited by 4
Santos, R. A., Cerqueira, D. M., Zamboni, D. S., & Oliveira, S. C. (2022) · Frontiers in Microbiology · doi:10.3389/fmicb.2022.1086925 · Cited by 4
A study on the level of NLRP3 inflammasome in patients with premature rupture of membranes
Xue, F., Wang, Y., Tao, X., & Su, W. (2023) · Immunity Inflammation and Disease · doi:10.1002/iid3.1018 · Cited by 4
Chan, F. H. M., Yeap, H. W., Liu, Z., Rosli, S. N., Low, K. E., Bonne, I., Wu, Y., Chong, S. Z., & Chen, K. W. (2025) · Cell Reports · doi:10.1016/j.celrep.2024.115216 · Cited by 3
Pyroptosis in acute pancreatitis: from pathogenesis to treatment
Wu, Q., & Ji, Z. (2025) · International Journal of Surgery · doi:10.1097/js9.0000000000003932 · Cited by 3
Gil, J. M. L., Pedoto, A., Conesa‐Hernández, A. M., Ocaña‐Esparza, M., Mulero, V., & Tyrkalska, S. D. (2025) · Cell Death and Disease · doi:10.1038/s41419-025-08291-8 · Cited by 3
Modulation of immune cells and metabolic reprogramming in efferocytosis
Oliveira, K. C., Marcos, C., Penteado, L. D. A., Dejani, N., Moraes-Vieira, P., & Medeiros, A. (2026) · Cell Death and Disease · doi:10.1038/s41419-026-08431-8 · Cited by 4
The influence of microorganisms on bone homeostasis in apical periodontitis
Pan, D., Hao, Y., Tao, Y., Li, B., & Cheng, L. (2024) · Archives of Oral Biology · doi:10.1016/j.archoralbio.2024.106153 · Cited by 3
Xiao, K., Zhou, B., & Liu, Y. (2025) · Journal of Nutrition · doi:10.1016/j.tjnut.2025.02.020 · Cited by 3
Ferroptosis in immune chaos: Unraveling its impact on disease and therapeutic potential
Direksunthorn, T., Ahmed, A. T., Pluetrattanabha, N., Uthirapathy, S., Ballal, S., Singh, A., Al‐Hetty, H. R. A. K., Devi, A., Sharma, G. C., & Yumashev, A. V. (2025) · Journal of Physiology and Biochemistry · doi:10.1007/s13105-025-01078-7 · Cited by 4
Geng, W., Tu, C., Chen, D., Lu, Z., Mao, W., & Zhu, H. (2022) · BMC Complementary Medicine and Therapies · doi:10.1186/s12906-022-03559-4 · Cited by 3
NLRP6 Induces Lung Injury and Inflammation Early in Brucella and Influenza Coinfection
Shi, B., Han, H., Li, H., Tan, L., Li, X., Wang, K., Li, B., He, W., Tian, C., Fang, Y., et al. (2022) · Journal of Personalized Medicine · doi:10.3390/jpm12122063 · Cited by 3
Inflammasomes primarily restrict cytosolic Salmonella replication within human macrophages
Egan, M. S., O'Rourke, E. A., Mageswaran, S. K., Zuo, B., Martynyuk, I., Demissie, T., Hunter, E. N., Bass, A. R., Chang, Y., Brodsky, I. E., et al. (2025) · eLife · doi:10.7554/elife.90107.3 · Cited by 4
The roles of microglia and astrocytes in inflammasomes and neurological disorders
Xia, Y., Huang, Y., Liu, Y., Zhang, X., Kang, H., Liu, Y., Yu, C., Gan, C., & Zhang, H. (2025) · Neural Regeneration Research · doi:10.4103/nrr.nrr-d-24-01574 · Cited by 2
Shan, X., Li, Z., & Dong, L. (2026) · Inflammation Research · doi:10.1007/s00011-025-02153-x · Cited by 2
Zeng, L., Lin, T., Liu, L., Zhao, C., Yang, R., Xiao, S., Mao, F., Qin, Y., Ma, H., Zhang, Y., et al. (2024) · Aquaculture · doi:10.1016/j.aquaculture.2024.741116 · Cited by 2
Self-citationOverexpression of T3SS translocation signals in Salmonella causes delayed attenuation
Abele, T. J., Billman, Z. P., Harvest, C. K., Bryan, A. K., Larson, H. N., Coers, J., & Miao, E. A. (2023) · Infection and Immunity · doi:10.1128/iai.00329-23 · Cited by 2
Self-citationShigella sonnei O-antigen inhibits internalisation, vacuole escape and inflammasome activationPreprint
Watson, J., Sanchez‐Garrido, J., Goddard, P. J., Torraca, V., Mostowy, S., Shenoy, A. R., & Clements, A. (2019) · bioRxiv (Cold Spring Harbor Laboratory) · doi:10.1101/799379 · Cited by 2
Bass, A. R., & Shin, S. (2020) · bioRxiv (Cold Spring Harbor Laboratory) · doi:10.1101/2020.05.27.120477 · Cited by 2
Bertocchi, I., Foglietta, F., Collotta, D., Eva, C. E., Brancaleone, V., Thiemermann, C., & Collino, M. (2020) · doi:10.22541/au.159318474.49742538 · Cited by 2
Gasdermin D Exerts Anti-Inflammatory Effects by Promoting Neutrophil DeathPreprint
Kambara, H., Liu, P., Liu, F., Bajrami, B., Teng, Y., Zhou, S., Yu, H., Zhou, W., Silberstein, L. E., Cheng, T., et al. (2018) · SSRN Electronic Journal · doi:10.2139/ssrn.3155714 · Cited by 2
Shi, F., Lv, Q., Wang, T., Xu, J., Xu, W., Shi, Y., Fu, X., Yang, T., Yang, Y., Zhuang, L., et al. (2021) · bioRxiv (Cold Spring Harbor Laboratory) · doi:10.1101/2021.02.23.432418 · Cited by 2
Inflammasomes primarily restrict cytosolic Salmonella replication within human macrophagesPreprint
Egan, M. S., O'Rourke, E. A., Mageswaran, S. K., Zuo, B., Martynyuk, I., Demissie, T., Hunter, E. N., Bass, A. R., Chang, Y., Brodsky, I. E., et al. (2023) · eLife · doi:10.7554/elife.90107.1 · Cited by 2
Bruce, J. K., Li, L., Tang, S., Winsor, N. J., Krustev, C., Keely, S., Philpott, D. J., & Girardin, S. E. (2024) · bioRxiv (Cold Spring Harbor Laboratory) · doi:10.1101/2024.02.01.578487 · Cited by 2
剛, 芝., & 八角, 高. (2019) · Nihon Shoni Arerugi Gakkaishi The Japanese Journal of Pediatric Allergy and Clinical Immunology · doi:10.3388/jspaci.33.350 · Cited by 1
Simultaneous Detection of Inflammasome Activation and Membrane Damage During Pyroptosis
den Hartigh, A. B., & Fink, S. L. (2022) · Methods in molecular biology · doi:10.1007/978-1-0716-2553-8_15 · Cited by 1
Validation of the Intermolecular Disulfide Bond in Caspase-2
Amason, M. E., Li, L., Harvest, C. K., Lacey, C. A., & Miao, E. A. (2024) · Biology · doi:10.3390/biology13010049 · Cited by 1
Self-citationAvar-Aydın, P. Ö., Yaz, İ., İnan, D., Özçakar, Z. B., Halaçlı, S. O., & Cağdaş, D. N. (2025) · The Turkish Journal of Pediatrics · doi:10.24953/turkjpediatr.2025.5389 · Cited by 1
Identification and analysis of pyroptosis-related key genes in heart failure
Zhang, J., Yue, Z., Zhu, N., & Zhao, N. (2025) · Journal of Cardiothoracic Surgery · doi:10.1186/s13019-025-03530-7 · Cited by 1
From mechanisms to markers: role of pyroptosis in revolutionizing thyroid cancer care
Wang, N., Chen, Y., Luo, G., & Luo, D. (2025) · Cell Death Discovery · doi:10.1038/s41420-025-02741-0 · Cited by 1
Kulkarni, M., Bourne, C. M., Mahale, A. B., Exconde, P. M., Murphy, C., Goodrow, H. T., Cervantes, S., Kardhashi, M., Kambayashi, M., Yoo, W., et al. (2026) · PLoS Pathogens · doi:10.1371/journal.ppat.1014178 · Cited by 2
Gasdermins against intracellular bacterial pathogens
de Souza, F. W., Liu, Y., Trujillo, J., & Miao, E. A. (2026) · Nature Microbiology · doi:10.1038/s41564-026-02272-z · Cited by 1
Self-citationZhou, Y., Wei, B., Chen, S., Ren, X., Li, R., Shen, Y., Wang, X., Xia, Y., Cao, S., & Ding, N. (2026) · Journal of Innate Immunity · doi:10.1159/000552343 · Cited by 1
Miki, T., Ito, M., Haneda, T., Okada, N., & Kim, Y. (2026) · Gut Microbes Reports · doi:10.1080/29933935.2026.2671472 · Cited by 1
Disulfidptosis: molecular mechanisms and therapeutic targets
Wang, C., Zhou, J., Jin, B., Li, G., Zhang, L., Chen, Z., & Fan, Z. (2026) · Signal Transduction and Targeted Therapy · doi:10.1038/s41392-026-03001-y · Cited by 2
Zebrafish earns its stripes for in vivo ASC speck dynamics
Bezbradica, J. S., & Schroder, K. (2017) · The Journal of Cell Biology · doi:10.1083/jcb.201708002 · Cited by 1
Hausmann, A., & Hardt, W. (2020) · John Wiley & Sons, Inc. eBooks · doi:10.1128/9781683670261.ch3 · Cited by 1
Zhu, D., Guo, J., Deng, X., Li, M., Wang, Y., Wang, Z., Sun, Z., Cao, S., Zhao, T., Xu, Y., et al. (2025) · International Immunopharmacology · doi:10.1016/j.intimp.2024.114001 · Cited by 1
Research Progress of Pyroptosis in Mycobacterium tuberculosis
赵, 悦. (2021) · Advances in Clinical Medicine · doi:10.12677/acm.2021.1112905 · Cited by 1
A Continuous IC Glaciochemical Record of the last Glacial Period from the NGRIP Ice Core
Siggaard‐Andersen, M., Hansson, M., Fischer, H., Bigler, M., Roethlisberger, R., Goto‐Azuma, K., Steffensen, J. P., Ruth, U., Andersen, K. K., Clausen, H. B., et al. (2005) · AGUFM · Cited by 1
Apoptotic signaling clears engineered Salmonella in an organ-specific mannerPreprint
Abele, T. J., Billman, Z. P., Li, L., Harvest, C. K., Bryan, A. K., Magalski, G. R., Lopez, J. P., Larson, H. N., Yin, X., & Miao, E. A. (2023) · bioRxiv (Cold Spring Harbor Laboratory) · doi:10.1101/2023.05.06.539681 · Cited by 1
Self-citationApoptotic signaling clears engineered Salmonella in an organ-specific mannerPreprint
Abele, T. J., Billman, Z. P., Li, L., Harvest, C. K., Bryan, A. K., Magalski, G. R., Lopez, J. P., Larson, H. N., Yin, X., & Miao, E. A. (2023) · eLife · doi:10.7554/elife.89210.1 · Cited by 1
Self-citationApoptotic signaling clears engineered Salmonella in an organ-specific mannerPreprint
Abele, T. J., Billman, Z. P., Li, L., Harvest, C. K., Bryan, A. K., Magalski, G. R., Lopez, J. P., Larson, H. N., Yin, X., & Miao, E. A. (2023) · eLife · doi:10.7554/elife.89210.2 · Cited by 1
Self-citationTypes of Cell Death and Their Relations to Host Immunological PathwaysPreprint
Hu, W. (2024) · Preprints.org · doi:10.20944/preprints202401.1920.v1
Inflammasomes primarily restrict cytosolic Salmonella replication within human macrophagesPreprint
Egan, M. S., O'Rourke, E. A., Mageswaran, S. K., Zuo, B., Martynyuk, I., Demissie, T., Hunter, E. N., Bass, A. R., Chang, Y., Brodsky, I. E., et al. (2024) · eLife · doi:10.7554/elife.90107.2 · Cited by 2
Salmonella SPI2 evades detection by NAIP/NLRC4 despite utilization of a detectable needlePreprint
Guo, J. (., Lakhani, F., Vientos, C. G., Li, L., & Miao, E. A. (2026) · bioRxiv (Cold Spring Harbor Laboratory) · doi:10.64898/2026.01.05.696446 · Cited by 1
Self-citationInflammasomes and Cytotoxic Lymphocytes Clear Bacteria From Different Intracellular Niches
Maltez, V. I. (2019) · Carolina Digital Repository (University of North Carolina at Chapel Hill) · doi:10.17615/1sz6-ya65
Zhang, Y., Tao, C.-H., Du, D., Xuan, C., & Cao, W. (2020) · doi:10.22541/au.160684072.22355285/v1
Self-citation[Construction of macrophage RAW 264.7 cells with gsdmd gene knockout by CRISPR/Cas9 system].
Zhou, L., Ye, Y., Yuan, H., Wu, C., & Wu, S. (2021) · Europe PMC (PubMed Central) · doi:10.12122/j.issn.1673-4254.2021.01.17
Mechanisms of immunity and inflammation in Brucella-induced arthritis
Lacey, C. A. (2018) · MOspace Institutional Repository (University of Missouri) · doi:10.32469/10355/68911
Apoptosis, necroptosis, and pyroptosis in health and disease
Liao, D. (2021) · Elsevier eBooks · doi:10.1016/b978-0-12-814208-0.00008-7
Oh, C., Li, L., Verma, A., Reuven, A. D., Miao, E. A., Bliska, J. B., & Aachoui, Y. (2022) · SSRN Electronic Journal · doi:10.2139/ssrn.4019721
Self-citationZhao, J., Wang, H., zhang, J., Ou, F., Wang, J., Liu, T., & Wu, J. (2022) · Research Square · doi:10.21203/rs.3.rs-1905481/v1
Hao, X., & Wang, H. (2022) · Journal of Nanomaterials · doi:10.1155/2022/2928601
Lopes, L. D. S. (2022) · Digital Library of Theses and Dissertations (Universidade de São Paulo) · doi:10.11606/d.17.2022.tde-08112022-173318
Papel da Gasdermina-D no controle da infecção por Toxoplasma gondii em macrófagos
Bottino, L. Z. M. F. (2022) · Digital Library of Theses and Dissertations (Universidade de São Paulo) · doi:10.11606/d.42.2022.tde-06052022-154710
Identificação de novas proteínas envolvidas na ativação do inflamassoma de NLRC4
Becerra, A. D. M. (2022) · Digital Library of Theses and Dissertations (Universidade de São Paulo) · doi:10.11606/d.17.2022.tde-03012023-113847
Ativação do inflamassoma: a importância na leishmaniose, na influenza e na COVID-19
de Sá, K. S. G. (2022) · Digital Library of Theses and Dissertations (Universidade de São Paulo) · doi:10.11606/t.17.2022.tde-03022023-110423
Role of inflammasomes NLRC4 in pathogenesis of leprosy
Batta, S. M. A., Elfar, N. N., Soliman, N. A., & Nassar, S. O. (2023) · International Journal of Dermatology Venereology and Leprosy Sciences · doi:10.33545/26649411.2023.v6.i1b.135
Analysis of Serum Pyrodeath Re-lated Proteins and Renal Injury in Patients with Type 2 DKD
马, 茹. (2023) · Asian Case Reports in Emergency Medicine · doi:10.12677/acrem.2023.112009
Chen, R., Chen, X., Fu, Y.-F., Yu, A., Ying, C., Miao, S., Dai, X., Ma, H., & Ni, Y. (2024) · Research Square · doi:10.21203/rs.3.rs-3862539/v1
Guerra, R. O. (2024) · Digital Library of Theses and Dissertations (Universidade de São Paulo) · doi:10.11606/d.17.2024.tde-10062024-092259
Pyroptotic corpses are flagged by filopodia to alert dendritic cells
(2024) · Nature Immunology · doi:10.1038/s41590-024-02025-2
Stull-Lane, A. R., Camacho, L., Hecke, A. E. R. V., Perez-Sepulveda, B. M., Bejarano, E. J., Winter, M. G., Winter, S., Hinton, J. C. D., Bäumler, A. J., Hiyoshi, H., et al. (2025) · mBio · doi:10.1128/mbio.01609-25
Allen, R. D., Farzand, R., Chandrasekharan, G., Watkins, K. E., Agarwal, P., & Unnikrishnan, M. (2025) · bioRxiv (Cold Spring Harbor Laboratory) · doi:10.1101/2025.10.30.685513
Zhang, B., Ding, M., Zeng, Y., Luo, J., Li, J., Gao, X., Liu, P., Cai, G., Zheng, Z., & Guo, X. (2025) · Veterinary Research · doi:10.1186/s13567-025-01651-4 · Cited by 1
Yao, R., Chen, Y., Hao, H., Guo, Z., Cheng, X., Ma, Y., Ji, Q., Yang, X., Wang, Y., Li, X., et al. (2020) · Figshare · doi:10.6084/m9.figshare.13310488
Yao, R., Chen, Y., Hao, H., Guo, Z., Cheng, X., Ma, Y., Ji, Q., Yang, X., Wang, Y., Li, X., et al. (2020) · Figshare · doi:10.6084/m9.figshare.13310503
Yao, R., Chen, Y., Hao, H., Guo, Z., Cheng, X., Ma, Y., Ji, Q., Yang, X., Wang, Y., Li, X., et al. (2020) · Figshare · doi:10.6084/m9.figshare.13310497
Geng, W., Tu, C., Chen, D., Lu, Z., Mao, W., & Zhu, H. (2022) · Figshare · doi:10.6084/m9.figshare.19451356
Yao, R., Chen, Y., Hao, H., Guo, Z., Cheng, X., Ma, Y., Ji, Q., Yang, X., Wang, Y., Li, X., et al. (2020) · Figshare · doi:10.6084/m9.figshare.13310512
Yao, R., Chen, Y., Hao, H., Guo, Z., Cheng, X., Ma, Y., Ji, Q., Yang, X., Wang, Y., Li, X., et al. (2020) · Figshare · doi:10.6084/m9.figshare.13310482
Yao, R., Chen, Y., Hao, H., Guo, Z., Cheng, X., Ma, Y., Ji, Q., Yang, X., Wang, Y., Li, X., et al. (2020) · Figshare · doi:10.6084/m9.figshare.13310506
Geng, W., Tu, C., Chen, D., Lu, Z., Mao, W., & Zhu, H. (2022) · Figshare · doi:10.6084/m9.figshare.19451365
Yao, R., Chen, Y., Hao, H., Guo, Z., Cheng, X., Ma, Y., Ji, Q., Yang, X., Wang, Y., Li, X., et al. (2020) · Figshare · doi:10.6084/m9.figshare.13310509
Yao, R., Chen, Y., Hao, H., Guo, Z., Cheng, X., Ma, Y., Ji, Q., Yang, X., Wang, Y., Li, X., et al. (2020) · Figshare · doi:10.6084/m9.figshare.13310467
Geng, W., Tu, C., Chen, D., Lu, Z., Mao, W., & Zhu, H. (2022) · Figshare · doi:10.6084/m9.figshare.19451362
Yao, R., Chen, Y., Hao, H., Guo, Z., Cheng, X., Ma, Y., Ji, Q., Yang, X., Wang, Y., Li, X., et al. (2020) · Figshare · doi:10.6084/m9.figshare.13310470
Zhao, J., Wang, H., zhang, J., Ou, F., Wang, J., Liu, T., & Wu, J. (2022) · Figshare · doi:10.6084/m9.figshare.21376371
Geng, W., Tu, C., Chen, D., Lu, Z., Mao, W., & Zhu, H. (2022) · Figshare · doi:10.6084/m9.figshare.19451359
Geng, W., Tu, C., Chen, D., Lu, Z., Mao, W., & Zhu, H. (2022) · Figshare · doi:10.6084/m9.figshare.19451353
Szczerba, M., & Goldberg, M. B. (2026) · bioRxiv (Cold Spring Harbor Laboratory) · doi:10.64898/2026.01.11.698901
Shen, C., Zhang, Y., Wei, C., Wang, H., & Zhou, Y. (2026) · APOPTOSIS · doi:10.1007/s10495-025-02250-6 · Cited by 1
Self-citationXu, Y., Xiang, L., He, Q., Gao, Y., Zheng, C., & Yao, H. (2026) · Frontiers in Immunology · doi:10.3389/fimmu.2026.1705500
Mahato, M., Mondal, P., & Bhattacharyya, S. (2026) · Bratislavské lekárske listy/Bratislava medical journal · doi:10.1007/s44411-026-00528-y
Implication de l'inflammasome NLRP3 dans la sécrétion non conventionnelle de la protéine FADD
Mouasni, S. (2018) · theses.fr (ABES) · doi:10.70675/8623f190zbb94z44b7z8b70zd93fa9be484d
Functional role and sex-based differences of bladder resident macrophages in infection
Mariano, L. L. (2020) · theses.fr (ABES) · doi:10.70675/b9873352z4505z440ezaab7z03feaa83bc77
Transcriptional regulations of inflammasome-related genes by Interferon Regulatory Factors
Cornut, M. (2020) · theses.fr (ABES) · doi:10.70675/fa5bf18bz82a6z4879za183z27963c062531
Emergence of NLRP1 inflammasome as a sensor of microbial virulence in human epithelium
Pinilla, M. (2023) · theses.fr (ABES) · doi:10.70675/1209ef79zd7c9z4b14z8a56za9b7f12b4bd0
Hu, W., Pagliaro, F., Spaink, H. P., & Meijer, A. H. (2026) · Cell Death and Disease · doi:10.1038/s41419-026-08810-1 · Cited by 1
Pyroptosis across species and its potential impact on host defense against zoonotic pathogens
Ho, S., & Bryant, C. E. (2026) · Cell chemical biology · doi:10.1016/j.chembiol.2026.05.008
Cytokines driven by caspase-1 and RIPK3 are antagonisticPreprint
Li, L., Guo, J. (., Wang, Y., Lacey, C. A., Liu, Y., Peng, J., Li, Y., Larson, H. N., Pratt, M. N., Tummers, B., et al. (2026) · bioRxiv (Cold Spring Harbor Laboratory) · doi:10.64898/2026.06.19.733458 · Cited by 1
Self-citationNanomedicine-mediated programmed necrosis for cancer immunosurveillance
Yoo, D., Go, D., Jung, S. Y., Park, J. H., Lee, S., Lim, H. G., Park, S.-H., Seo, Y. H., Lee, J., Um, W., et al. (2026) · Materials Horizons · doi:10.1039/d6mh00654j
Mohareer, K., & Banerjee, S. (2026) · Elsevier eBooks · doi:10.1016/b978-0-443-27735-1.00010-1
Metadata
- Authors
- Jorgensen, I., Zhang, Y., Krantz, B. A., & Miao, E. A.
- Affiliations
- Department of Microbiology and Immunology, University of North Carolina at Chapel Hill, Chapel Hill, NC 27599 1
- University of North Carolina at Chapel Hill (US)
- University of Maryland, Baltimore (US)
- Corresponding author
- Miao, Edward A.
- Venue
- Journal of Experimental Medicine
- Publisher
- Rockefeller University Press
- Published
- 2016-08-29
- Volume
- 213
- Issue
- 10
- Pages
- 2113-2128
- ISSN
- 0022-1007 (ISSN-L)
- 1540-9538
- PMC
- PMC5030797
- OpenAlex
- W2511127858
- Cited by
- 403
- References
- 43
- Citations by year
- 2026: 21 · 2025: 38 · 2024: 40 · 2023: 57 · 2022: 56 · 2021: 35 · 2020: 46 · 2019: 35 · 2018: 37 · 2017: 32 · 2016: 5
- FWCI
- 18.89
- Type
- journal article
- Language
- en
- Open access
- bronze
- doi.org
- Locations
- The Journal of Experimental Medicine (publishedVersion)
- Europe PMC (PubMed Central) (publishedVersion, cc-by-nc-sa)
- PubMed Central (publishedVersion, cc-by-nc-sa)
- PubMed (publishedVersion)
- Carolina Digital Repository (University of North Carolina at Chapel Hill) (submittedVersion)
- UNC Libraries
- Funders
- National Institutes of Health (DK007737, AI097518, AI057141, AI119073, AI077703, 1 S10 OD017984-01A1)
- Topics
- Life Sciences › Biochemistry, Genetics and Molecular Biology › Molecular Biology › Inflammasome and immune disorders
- Life Sciences › Immunology and Microbiology › Immunology › Immune Response and Inflammation
- Life Sciences › Biochemistry, Genetics and Molecular Biology › Molecular Biology › Cell death mechanisms and regulation
- Keywords
- pyroptosis, caspase-1, inflammasome, intracellular bacteria, bacterial clearance, efferocytosis, neutrophils, macrophages, osmotic lysis, plasma membrane rupture, necroptosis, neutrophil extracellular traps, complement system, scavenger receptors, Salmonella, innate immunity
- MeSH terms
- Pyroptosis, Animals, Complement System Proteins, Macrophages, Mice, Inbred C57BL, Necrosis, Neutrophils, Phagocytosis, Salmonella typhimurium, Solubility, Intracellular Space, Green Fluorescent Proteins, Microbial Viability, Receptors, Scavenger, Mice
About these checks
Registry, retraction, Cites and statistics results are computed, not judged, with one exception: a printed reference that no index lists is read once by a model before it counts as a citation error. Claims are extracted by a model and kept only when their quote appears verbatim in the text; each cited source is then checked, with a model’s help, for whether it says what the claim relies on. Those verdicts can be wrong — read the claim’s quote and the cited source before relying on one.
Statistics and arithmetic are recomputed, not judged.
Confidence bands are shown only for fields calibrated on our annotated test set. None is calibrated yet, so no band is shown.
What counts as a claim ›How we measure confidence ›How we check this ›
Are you an author, or do you see a problem with this page? Request a review
