

The DOI matches its Crossref record; 66 of the 66 references it cites were found in a registry or an index.
Conformational changes linked to ADP release from human cardiac myosin bound to actin-tropomyosin
Open accessPublished version of a preprint
Abstract
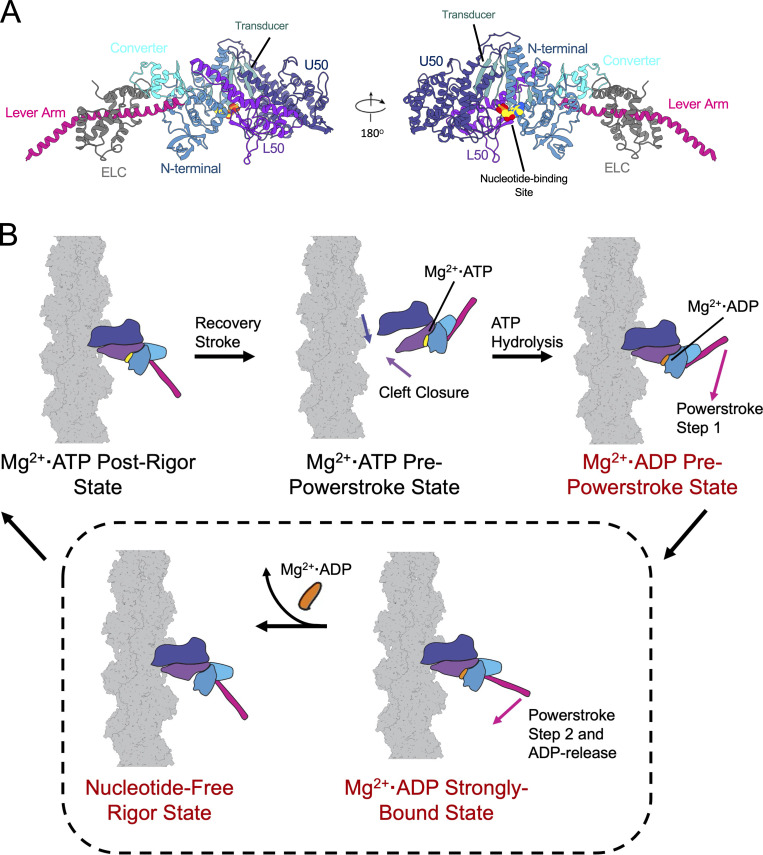
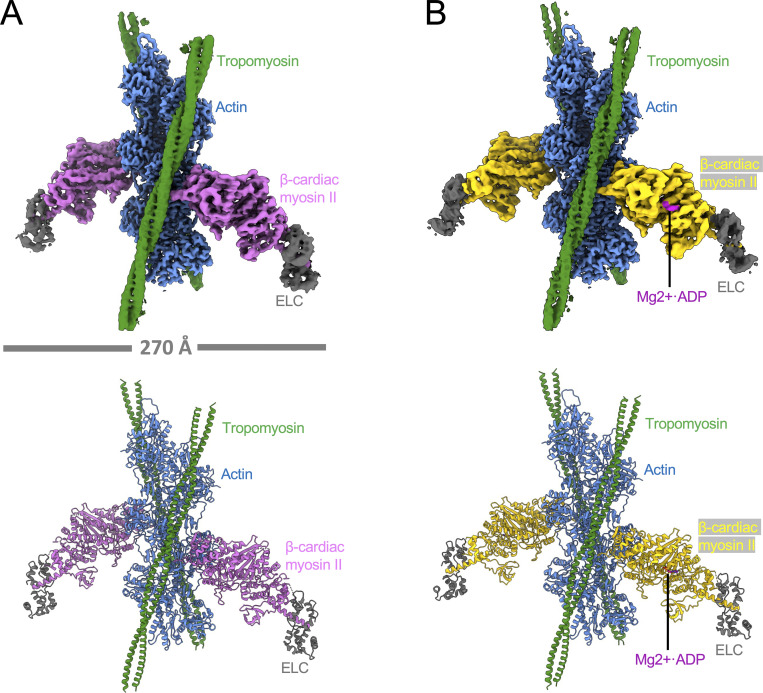
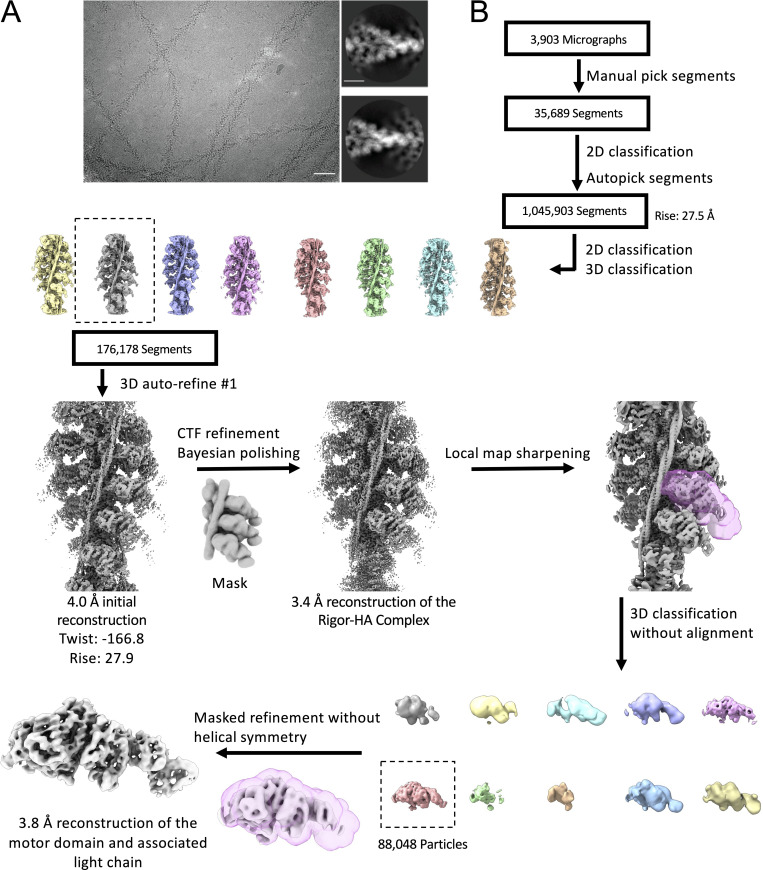
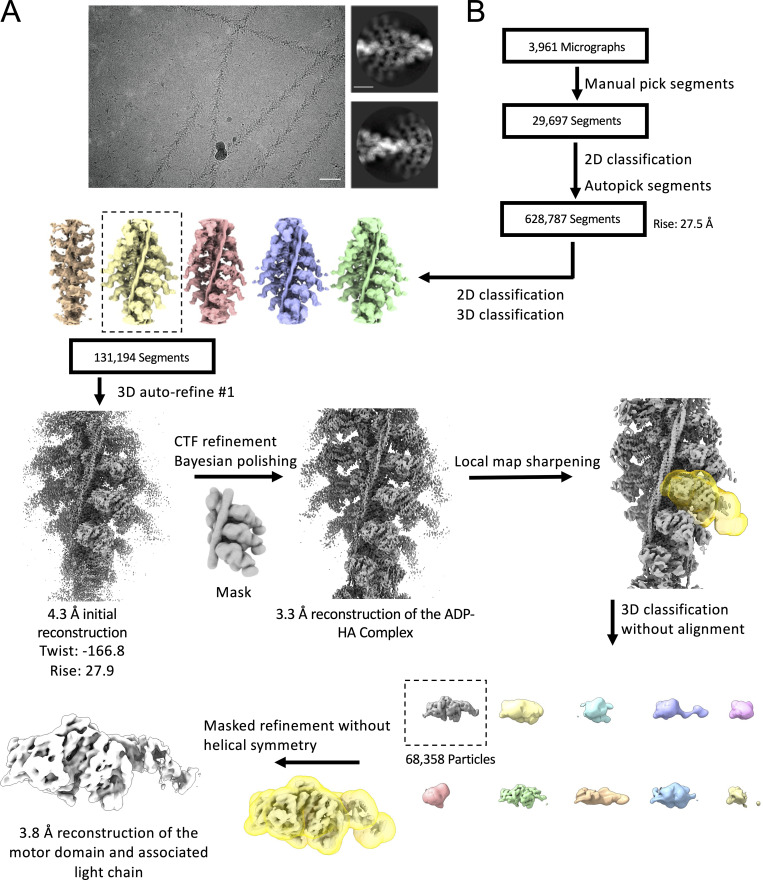
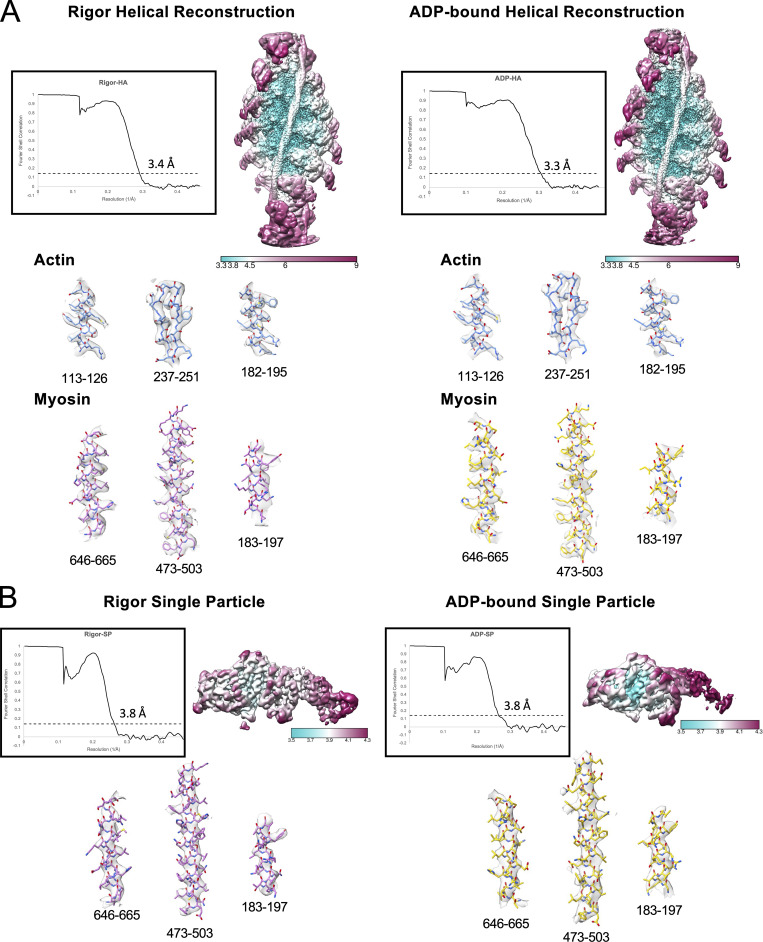
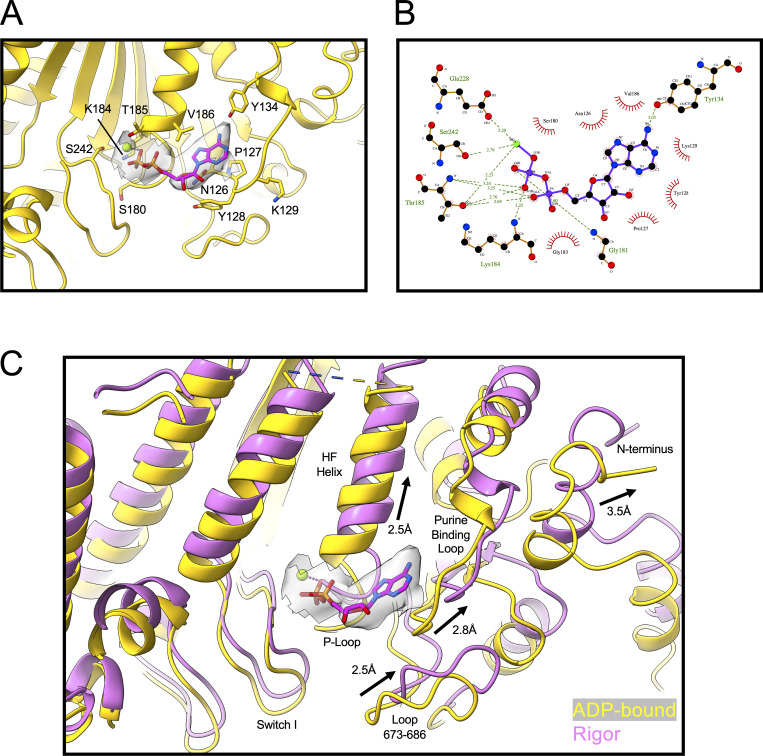
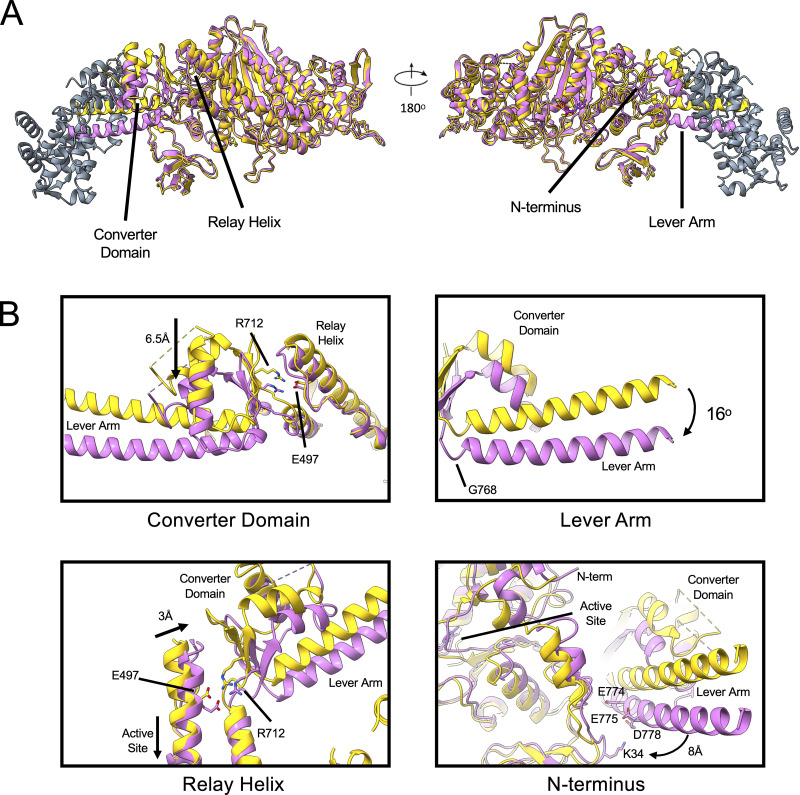
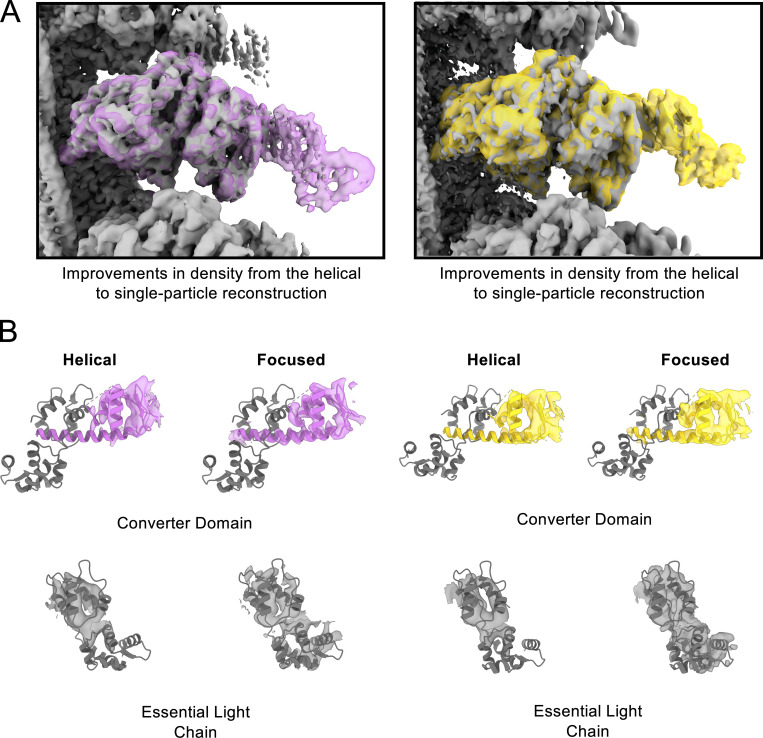
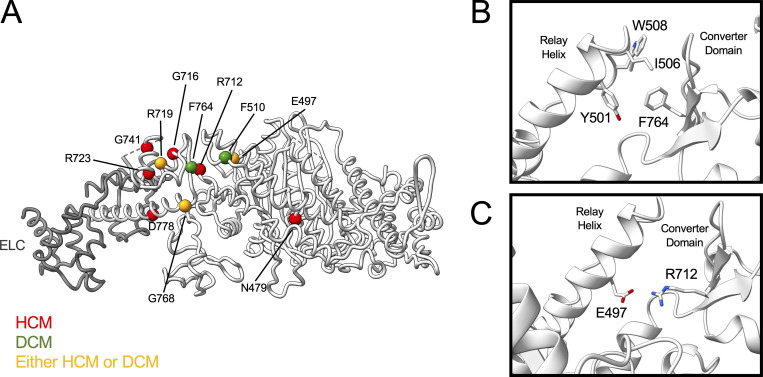
Following binding to the thin filament, β-cardiac myosin couples ATP-hydrolysis to conformational rearrangements in the myosin motor that drive myofilament sliding and cardiac ventricular contraction. However, key features of the cardiac-specific actin-myosin interaction remain uncertain, including the structural effect of ADP release from myosin, which is rate-limiting during force generation. In fact, ADP release slows under experimental load or in the intact heart due to the afterload, thereby adjusting cardiac muscle power output to meet physiological demands. To further elucidate the structural basis of this fundamental process, we used a combination of cryo-EM reconstruction methodologies to determine structures of the human cardiac actin–myosin–tropomyosin filament complex at better than 3.4 Å-resolution in the presence and in the absence of Mg2+·ADP. Focused refinements of the myosin motor head and its essential light chains in these reconstructions reveal that small changes in the nucleotide-binding site are coupled to significant rigid body movements of the myosin converter domain and a 16-degree lever arm swing. Our structures provide a mechanistic framework to understand the effect of ADP binding and release on human cardiac β-myosin, and offer insights into the force-sensing mechanism displayed by the cardiac myosin motor.
Overview
The claims and statistics of this paper haven’t been checked yet.
Run the check — free, no account needed. It reads the open-access text and checks the sources it cites.
Integrity signals
Registry
Cites
Statistics
Figures
Verification
Claims the paper makes
The claims and statistics of this paper haven’t been checked yet.
Run the check — free, no account needed. It reads the open-access text and checks the sources it cites.
Self-check
Percentages, sums and reported differences re-computed from the paper’s own numbers.
The self-check needs the paper’s full text.
Citations
Cites
Highly accurate protein structure prediction with AlphaFold
Jumper, J., Evans, R., Pritzel, A., Green, T., Figurnov, M., Ronneberger, O., Tunyasuvunakool, K., Bates, R., Žídek, A., Potapenko, A., et al. (2021) · Nature · doi:10.1038/s41586-021-03819-2 · Cited by 43,764
UCSF ChimeraX: Structure visualization for researchers, educators, and developers
Pettersen, E. F., Goddard, T. D., Huang, C. C., Meng, E. C., Couch, G. S., Croll, T. I., Morris, J. H., & Ferrin, T. E. (2021) · Protein Science · doi:10.1002/pro.3943 · Cited by 9,514
MotionCor2: anisotropic correction of beam-induced motion for improved cryo-electron microscopy
Zheng, S. Q., Palovcak, E. J., Armache, J., Verba, K. A., Cheng, Y., & Agard, D. A. (2017) · Nature Methods · doi:10.1038/nmeth.4193 · Cited by 7,559
SWISS-MODEL: an automated protein homology-modeling server
Schwede, T. F. (2003) · Nucleic Acids Research · doi:10.1093/nar/gkg520 · Cited by 5,592
Walker, J. E., Saraste, M., Runswick, M. J., & Gay, N. J. (1982) · The EMBO Journal · doi:10.1002/j.1460-2075.1982.tb01276.x · Cited by 5,312
CTFFIND4: Fast and accurate defocus estimation from electron micrographs
Rohou, A., & Grigorieff, N. (2015) · Journal of Structural Biology · doi:10.1016/j.jsb.2015.08.008 · Cited by 4,913
The Mechanism of Muscular Contraction
Huxley, H. E. (1969) · Science · doi:10.1126/science.164.3886.1356 · Cited by 1,987
Automated molecular microscopy: The new Leginon system
Suloway, C., Pulokas, J., Fellmann, D., Cheng, A., Guerra, F., Quispe, J., Stagg, S., Potter, C. S., & Carragher, B. (2005) · Journal of Structural Biology · doi:10.1016/j.jsb.2005.03.010 · Cited by 1,764
Mechanism of adenosine triphosphate hydrolysis by actomyosin
Lymn, R. W., & Taylor, E. W. (1971) · Biochemistry · doi:10.1021/bi00801a004 · Cited by 1,333
Steric-model for activation of muscle thin filaments
Vibert, P. J., Craig, R. W., & Lehman, W. (1997) · Journal of Molecular Biology · doi:10.1006/jmbi.1996.0800 · Cited by 468
Self-citationStructural and Functional Insights into the Myosin Motor Mechanism
Sweeney, H. L., & Houdusse, A. (2010) · Annual Review of Biophysics · doi:10.1146/annurev.biophys.050708.133751 · Cited by 422
The Molecular Mechanism of Muscle Contraction
Geeves, M. A., & Holmes, K. C. (2005) · Advances in Protein Chemistry · doi:10.1016/s0065-3233(04)71005-0 · Cited by 398
Molecular structure of F-actin and location of surface binding sites
Milligan, R. A., Whittaker, M., & Safer, D. (1990) · Nature · doi:10.1038/348217a0 · Cited by 386
A 35-Å movement of smooth muscle myosin on ADP release
Whittaker, M., Wilson-Kubalek, E., Smith, J. E., Faust, L., Milligan, R., & Sweeney, H. (1995) · Nature · doi:10.1038/378748a0 · Cited by 348
Three myosin V structures delineate essential features of chemo‐mechanical transduction
Coureux, P., Sweeney, H. L., & Houdusse, A. (2004) · The EMBO Journal · doi:10.1038/sj.emboj.7600458 · Cited by 285
Structure and function of the AAA+ nucleotide binding pocket
Wendler, P., Ciniawsky, S., Kock, M., & Kube, S. (2012) · Biochimica et Biophysica Acta (BBA) - Molecular Cell Research · doi:10.1016/j.bbamcr.2011.06.014 · Cited by 273
Cryo-EM structure of a human cytoplasmic actomyosin complex at near-atomic resolution
von der Ecken, J., Heissler, S. M., Pathan-Chhatbar, S., Manstein, D. J., & Raunser, S. (2016) · Nature · doi:10.1038/nature18295 · Cited by 233
Cardiac muscle thin filament structures reveal calcium regulatory mechanism
Yamada, Y., Namba, K., & Fujii, T. (2020) · Nature Communications · doi:10.1038/s41467-019-14008-1 · Cited by 215
How Myosin Generates Force on Actin Filaments
Houdusse, A., & Sweeney, H. L. (2016) · Trends in Biochemical Sciences · doi:10.1016/j.tibs.2016.09.006 · Cited by 189
Sarcomeric proteins and inherited cardiomyopathies
Morimoto, S. (2007) · Cardiovascular Research · doi:10.1093/cvr/cvm084 · Cited by 186
Adenosine diphosphate and strain sensitivity in myosin motors
Holmes, K. C., Trentham, D. R., Simmons, R. M., Nyitrai, M., & Geeves, M. A. (2004) · Philosophical Transactions of the Royal Society B Biological Sciences · doi:10.1098/rstb.2004.1560 · Cited by 180
Kinetics of the interaction between actin, ADP, and cardiac myosin-S1.
Siemankowski, R. F., & White, H. D. (1984) · Journal of Biological Chemistry · doi:10.1016/s0021-9258(17)42953-x · Cited by 178
Cremo, C. R., & Geeves, M. A. (1998) · Biochemistry · doi:10.1021/bi9722406 · Cited by 163
The mechanism of muscular contraction. Science 164:1356-1366, 1969.
Huxley, H. E. (2002) · PubMed · Cited by 153
Evidence for cleft closure in actomyosin upon ADP release.
Hanein, D., Volkmann, N., Ouyang, G., Trybus, K. M., DeRosier, D. J., & Lowey, S. (2000) · Nature Structural Biology · doi:10.1038/82008 · Cited by 145
How Actin Initiates the Motor Activity of Myosin
Llinas, P., Isabet, T., Song, L. Y., Ropars, V., Zong, B., Benisty, H., Sirigu, S., Morris, C. A., Kikuti, C. M., Safer, D., et al. (2015) · Developmental Cell · doi:10.1016/j.devcel.2015.03.025 · Cited by 139
Woody, M. S., Greenberg, M. J., Barua, B., Winkelmann, D. A., Goldman, Y. E., & Ostap, E. M. (2018) · Nature Communications · doi:10.1038/s41467-018-06193-2 · Cited by 130
Mentes, A., Huehn, A. R., Liu, X., Zwolak, A., Domínguez, R., Shuman, H., Ostap, E. M., & Sindelar, C. V. (2018) · Proceedings of the National Academy of Sciences · doi:10.1073/pnas.1718316115 · Cited by 126
Omecamtiv Mecarbil Modulates the Kinetic and Motile Properties of Porcine β-Cardiac Myosin
Liu, Y., White, H. D., Belknap, B., Winkelmann, D. A., & Forgacs, E. (2015) · Biochemistry · doi:10.1021/bi5015166 · Cited by 124
Homburger, J. R., Green, E. M., Caleshu, C. A., Sunitha, M. S., Taylor, R. E., Ruppel, K. M., Metpally, R. P. R., SHaRe Investigators, Colan, S. D., Michels, M., et al. (2016) · Proceedings of the National Academy of Sciences · doi:10.1073/pnas.1606950113 · Cited by 117
Robert‐Paganin, J., Auguin, D., & Houdusse, A. (2018) · Nature Communications · doi:10.1038/s41467-018-06191-4 · Cited by 108
Greenberg, M. J., Shuman, H., & Ostap, E. M. (2014) · Biophysical Journal · doi:10.1016/j.bpj.2014.11.005 · Cited by 102
Weiß, S., Rossi, R., Pellegrino, M. A., Bottinelli, R., & Geeves, M. A. (2001) · Journal of Biological Chemistry · doi:10.1074/jbc.m107434200 · Cited by 101
Single molecule mechanics resolves the earliest events in force generation by cardiac myosin
Woody, M. S., Winkelmann, D. A., Capitanio, M., Ostap, E. M., & Goldman, Y. E. (2019) · eLife · doi:10.7554/elife.49266 · Cited by 95
Molecular mechanism for direct actin force-sensing by α-catenin
Mei, L., Reyes, S. E. D. L., Reynolds, M. J., Leicher, R., Liu, S., & Alushin, G. M. (2020) · eLife · doi:10.7554/elife.62514 · Cited by 92
Swenson, A. M., Tang, W., Blair, C. A., Fetrow, C., Unrath, W. C. T., Previs, M. J., Campbell, K. S., & Yengo, C. M. (2017) · Journal of Biological Chemistry · doi:10.1074/jbc.m116.748780 · Cited by 90
Self-citationMentes, A., Huehn, A. R., Liu, X., Zwolak, A., Domínguez, R., Shuman, H., Ostap, E. M., & Sindelar, C. V. (2018) · Worldwide Protein Data Bank · doi:10.2210/pdb6c1d/pdb · Cited by 86
Magnesium Regulates ADP Dissociation from Myosin V
Rosenfeld, S. S., Houdusse, A., & Sweeney, H. L. (2004) · Journal of Biological Chemistry · doi:10.1074/jbc.m412717200 · Cited by 81
Review: The ATPase mechanism of myosin and actomyosin
Geeves, M. A. (2016) · Biopolymers · doi:10.1002/bip.22853 · Cited by 80
Joel, P. B., Trybus, K. M., & Sweeney, H. L. (2001) · Journal of Biological Chemistry · doi:10.1074/jbc.m006930200 · Cited by 76
A Perspective on the Role of Myosins as Mechanosensors
Greenberg, M. J., Arpağ, G., Tüzel, E., & Ostap, E. M. (2016) · Biophysical Journal · doi:10.1016/j.bpj.2016.05.021 · Cited by 76
Gurel, P. S., Kim, L. Y., Ruijgrok, P. V., Omabegho, T., Bryant, Z. D., & Alushin, G. M. (2017) · eLife · doi:10.7554/elife.31125 · Cited by 73
Sung, J., Nag, S., Mortensen, K. I., Vestergaard, C. L., Sutton, S. C., Ruppel, K. M., Flyvbjerg, H., & Spudich, J. A. (2015) · Nature Communications · doi:10.1038/ncomms8931 · Cited by 70
The role of three-state docking of myosin S1 with actin in force generation.
Geeves, M. A., & Conibear, P. B. (1995) · PubMed · Cited by 64
Structural basis for tunable control of actin dynamics by myosin-15 in mechanosensory stereocilia
Gong, R., Jiang, F., Moreland, Z. G., Reynolds, M. J., de los Reyes, S. E., Gurel, P., Shams, A., Heidings, J. B., Bowl, M. R., Bird, J. E., et al. (2022) · Science Advances · doi:10.1126/sciadv.abl4733 · Cited by 56
Actin-induced Closure of the Actin-binding Cleft of Smooth Muscle Myosin
Yengo, C. M., Cruz, E. M. D. L., Chrin, L. R., Gaffney, D. P., & Berger, C. L. (2002) · Journal of Biological Chemistry · doi:10.1074/jbc.m111253200 · Cited by 54
Self-citationHigh-Resolution Cryo-EM Structure of the Cardiac Actomyosin Complex
Risi, C. M., Schäfer, L. U., Belknap, B., Pepper, I., White, H. D., Schroeder, G. F., & Galkin, V. E. (2020) · Structure · doi:10.1016/j.str.2020.09.013 · Cited by 54
Cryo-EM and Molecular Docking Shows Myosin Loop 4 Contacts Actin and Tropomyosin on Thin Filaments
Doran, M. H., Pavadai, E., Rynkiewicz, M. J., Walklate, J., Bullitt, E., Moore, J. R., Regnier, M., Geeves, M. A., & Lehman, W. (2020) · Biophysical Journal · doi:10.1016/j.bpj.2020.07.006 · Cited by 51
Self-citationToward understanding actin activation of myosin ATPase: The role of myosin surface loops
Onishi, H., Mikhailenko, S. V., & Morales, M. F. (2006) · Proceedings of the National Academy of Sciences · doi:10.1073/pnas.0601595103 · Cited by 50
Walker-A Motif Acts to Coordinate ATP Hydrolysis with Motor Output in Viral DNA Packaging
delToro, D. J., Ortiz, D., Ordyan, M., Sippy, J., Oh, C., Keller, N. A., Feiss, M. G., Catalano, C. E., & Smith, D. E. (2016) · Journal of Molecular Biology · doi:10.1016/j.jmb.2016.04.029 · Cited by 49
Multistep orthophosphate release tunes actomyosin energy transduction
Moretto, L., Ušaj, M., Matusovsky, O. S., Rassier, D. E., Friedman, R., & Månsson, A. (2022) · Nature Communications · doi:10.1038/s41467-022-32110-9 · Cited by 48
Mechanochemical tuning of myosin-I by the N-terminal region
Greenberg, M. J., Lin, T., Shuman, H., & Ostap, E. M. (2015) · Proceedings of the National Academy of Sciences · doi:10.1073/pnas.1506633112 · Cited by 46
Snoberger, A. M., Barua, B., Atherton, J. L., Shuman, H., Forgacs, E., Goldman, Y. E., Winkelmann, D. A., & Ostap, E. M. (2021) · eLife · doi:10.7554/elife.63691 · Cited by 45
Pospich, S., Sweeney, H. L., Houdusse, A., & Raunser, S. (2021) · eLife · doi:10.7554/elife.73724 · Cited by 45
Hegyi, B., Shimkunas, R., Jian, Z., Izu, L. T., Bers, D. M., & Chen‐Izu, Y. (2021) · Proceedings of the National Academy of Sciences · doi:10.1073/pnas.2108484118 · Cited by 37
Stabilization of the Actomyosin Complex by Negative Charges on Myosin
Furch, M., Remmel, B., Geeves, M. A., & Manstein, D. J. (2000) · Biochemistry · doi:10.1021/bi000985x · Cited by 36
Functional Characterization of the N-terminal Region of Myosin-2
Fujita‐Becker, S., Tsiavaliaris, G., Ohkura, R., Shimada, T., Manstein, D. J., & Sutoh, K. (2006) · Journal of Biological Chemistry · doi:10.1074/jbc.m605171200 · Cited by 36
Magnesium Modulates Actin Binding and ADP Release in Myosin Motors
Swenson, A. M., Trivedi, D. V., Rauscher, A. Á., Wang, Y., Takagi, Y., Palmer, B. M., Málnási‐Csizmadia, A., Debold, E. P., & Yengo, C. M. (2014) · Journal of Biological Chemistry · doi:10.1074/jbc.m114.562231 · Cited by 33
Self-citationRecent insights into the relative timing of myosin's powerstroke and release of phosphate
Debold, E. P. (2021) · Cytoskeleton · doi:10.1002/cm.21695 · Cited by 31
Coluccio, L. M. (2020) · Advances in experimental medicine and biology · doi:10.1007/978-3-030-38062-5_12 · Cited by 29
Cardiomyopathy mutations impact the actin-activated power stroke of human cardiac myosin
Tang, W., Ge, J., Unrath, W. C. T., Desetty, R. D., & Yengo, C. M. (2021) · Biophysical Journal · doi:10.1016/j.bpj.2021.04.007 · Cited by 21
Self-citationTang, W., Unrath, W. C. T., Desetty, R. D., & Yengo, C. M. (2019) · Journal of Biological Chemistry · doi:10.1074/jbc.ra119.010217 · Cited by 20
Self-citationConverter domain mutations in myosin alter structural kinetics and motor function
Gunther, L. K., Rohde, J. A., Tang, W., Walton, S. D., Unrath, W. C. T., Trivedi, D. V., Muretta, J. M., Thomas, D. D., & Yengo, C. M. (2018) · Journal of Biological Chemistry · doi:10.1074/jbc.ra118.006128 · Cited by 17
Self-citationCardiomyopathy Mutation Alters End-to-End Junction of Tropomyosin and Reduces Calcium Sensitivity
Sundar, S., Rynkiewicz, M. J., Ghosh, A., Lehman, W., & Moore, J. R. (2019) · Biophysical Journal · doi:10.1016/j.bpj.2019.11.3396 · Cited by 16
Self-citationThe Central Role of the F-Actin Surface in Myosin Force Generation
Doran, M. H., & Lehman, W. (2021) · Biology · doi:10.3390/biology10121221 · Cited by 16
Self-citationNanosurfer assay dissects β-cardiac myosin and cardiac myosin-binding protein C interactions
Touma, A. M., Tang, W., Rasicci, D. V., Vang, D., Rai, A., Previs, S. B., Warshaw, D. M., Yengo, C. M., & Sivaramakrishnan, S. (2022) · Biophysical Journal · doi:10.1016/j.bpj.2022.05.013 · Cited by 7
Self-citation
Metadata
- Authors
- Doran, M. H., Rynkiewicz, M. J., Rasicci, D., Bodt, S. M. L., Barry, M. E., Bullitt, E., Yengo, C. M., Moore, J. R., & Lehman, W.
- Affiliations
- Boston University (US)
- Pennsylvania State University (US)
- University of Massachusetts Lowell (US)
- Corresponding author
- Doran, Matthew H.
- ORCID
- Venue
- Journal of General Physiology
- Publisher
- Rockefeller University Press
- Published
- 2023-01-12
- Volume
- 155
- Issue
- 3
- ISSN
- 0022-1295 (ISSN-L)
- 1540-7748
- PMC
- PMC9859928
- OpenAlex
- W4315754328
- Cited by
- 27
- References
- 66
- Citations by year
- 2026: 10 · 2025: 8 · 2024: 7 · 2023: 2
- FWCI
- 2.96
- Type
- journal article
- Language
- en
- Open access
- hybrid
- doi.org
- Licence
- Locations
- The Journal of General Physiology (publishedVersion, cc-by-nc-sa)
- bioRxiv (Cold Spring Harbor Laboratory) (acceptedVersion, cc-by-nd)
- PubMed Central (publishedVersion, cc-by-nc-sa)
- PubMed (publishedVersion)
- Funders
- National Institutes of Health (R01HL036153, R01HL127699-03, T32HL007969, S10RR25434, U24 GM129541)
- Boston University
- Topics
- Health Sciences › Medicine › Cardiology and Cardiovascular Medicine › Cardiomyopathy and Myosin Studies
- Life Sciences › Biochemistry, Genetics and Molecular Biology › Molecular Biology › Protein Structure and Dynamics
- Life Sciences › Biochemistry, Genetics and Molecular Biology › Structural Biology › Advanced Electron Microscopy Techniques and Applications
- Keywords
- cardiac myosin, ADP release, essential light chain, nucleotide binding site, force sensing, afterload, cryo-EM structure
- MeSH terms
- Actins, Humans, Actin Cytoskeleton, Myosins, Tropomyosin, Cardiac Myosins
About these checks
Registry, retraction, Cites and statistics results are computed, not judged, with one exception: a printed reference that no index lists is read once by a model before it counts as a citation error. Claims are extracted by a model and kept only when their quote appears verbatim in the text; each cited source is then checked, with a model’s help, for whether it says what the claim relies on. Those verdicts can be wrong — read the claim’s quote and the cited source before relying on one.
Statistics and arithmetic are recomputed, not judged.
Confidence bands are shown only for fields calibrated on our annotated test set. None is calibrated yet, so no band is shown.
What counts as a claim ›How we measure confidence ›How we check this ›
Are you an author, or do you see a problem with this page? Request a review
Data sources
Bibliographic data: Semantic Scholar, OpenAlex, Crossref.
Contains information from the Semantic Scholar Academic Graph Datasets, made available under the ODC Attribution License (ODC-BY 1.0).
Semantic Scholar’s data is described in: Kinney, R., et al. (2023). The Semantic Scholar Open Data Platform. arXiv:2301.10140.
