

The DOI matches its Crossref record; 39 of the 39 references it cites were found in a registry or an index.
Integrated Assessment of the Clinical Performance of GalNAc 3 -Conjugated 2′- O -Methoxyethyl Chimeric Antisense Oligonucleotides: I. Human Volunteer Experience
Open accessAbstract
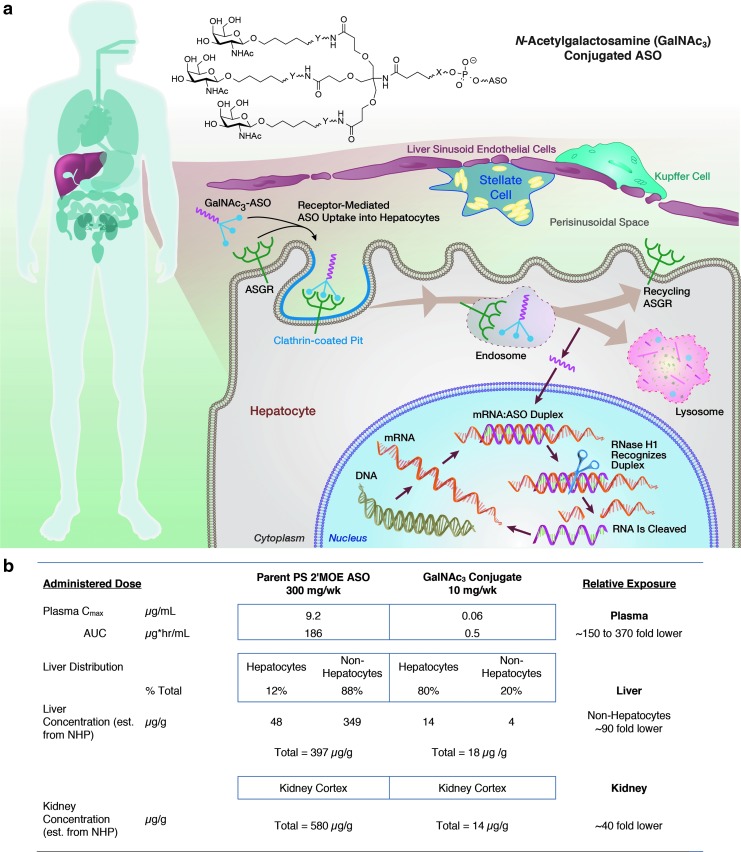
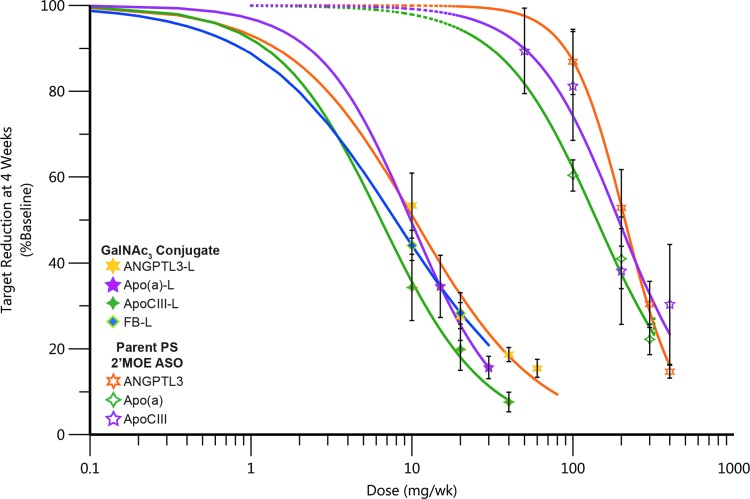
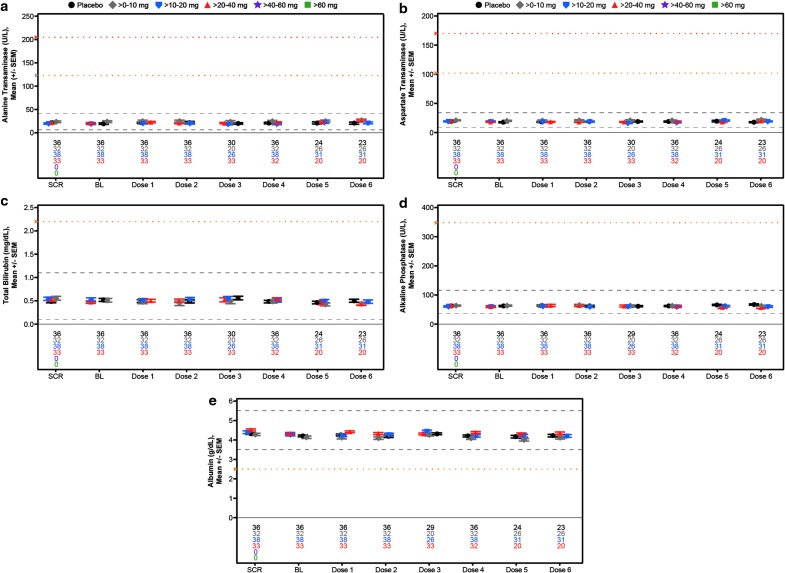
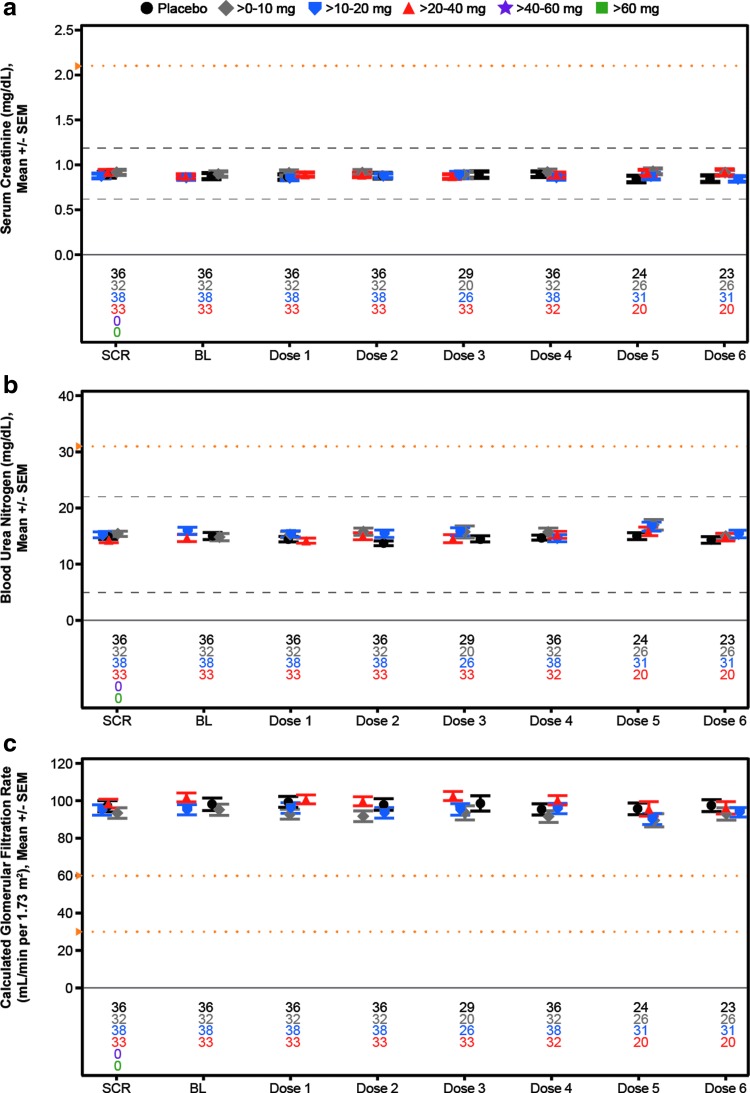
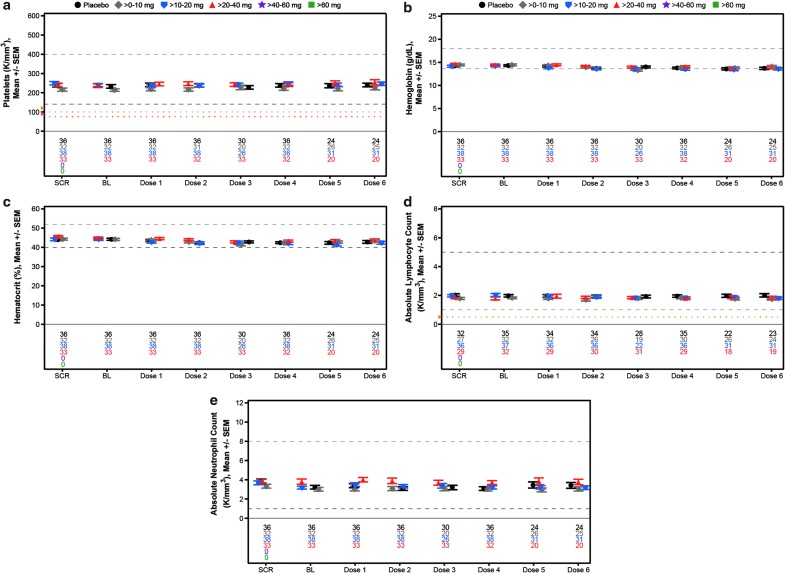
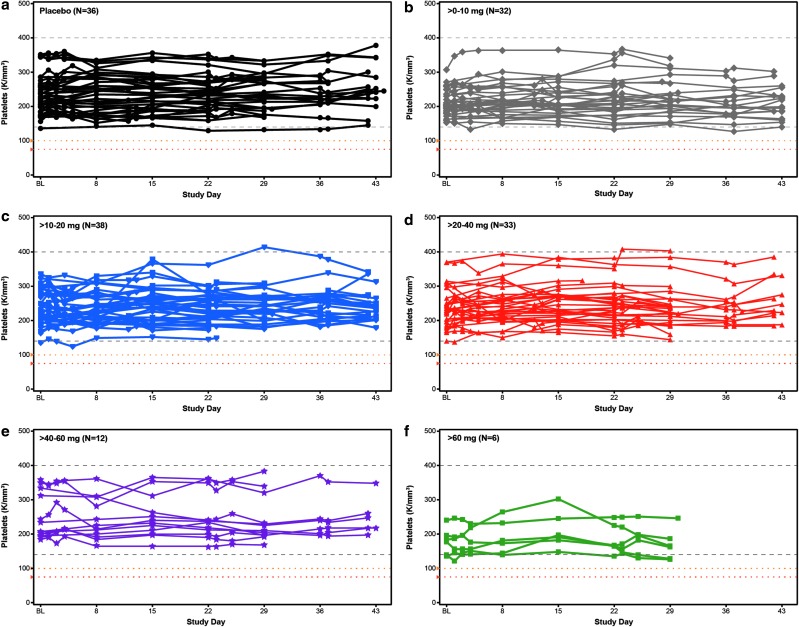
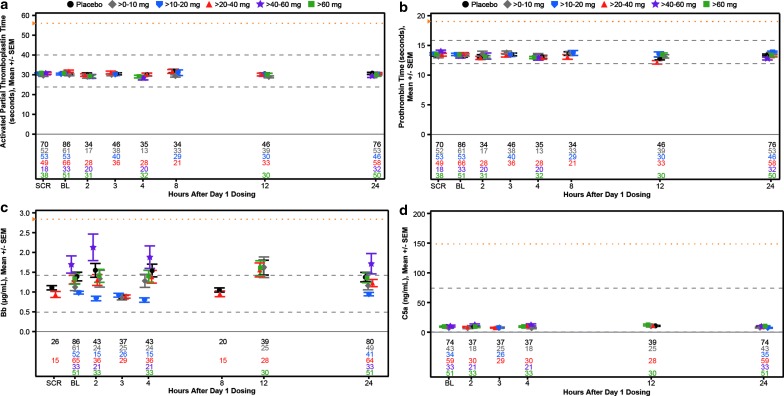
Advances in medicinal chemistry have produced new chemical classes of antisense oligonucleotides (ASOs) with enhanced therapeutic properties. Conjugation of the triantennary N -acetylgalactosamine (GalNAc 3 ) moiety to the extensively characterized phosphorothioate (PS)-modified 2′- O -methoxyethyl (2′MOE) ASO exemplifies such an advance. This structure-activity optimized moiety effects receptor-mediated uptake of the ASO prodrug through the asialoglycoprotein receptor 1 to support selective targeting of RNAs expressed by hepatocytes. In this study we report the integrated assessment of data available from randomized placebo-controlled dose-ranging studies of this chemical class of ASOs administered systemically to healthy human volunteers. First, we compare the pharmacokinetic and pharmacodynamic profiles of a subset of the GalNAc 3 -conjugated PS-modified 2′MOE ASOs to the parent PS-modified 2′MOE ASOs for which plasma analytes are available. We then evaluate the safety profile of the full set of GalNAc 3 -conjugated PS-modified 2′MOE ASO conjugates by the incidence of signals in standardized laboratory tests and by the mean laboratory test results as a function of dose level over time. With hepatocyte targeted delivery, the ED 50 for the GalNAc 3 -conjugated PS-modified 2′MOE ASO subset ranges from 4 to 10 mg/week, up to 30-fold more potent than the parent PS-modified 2′MOE ASO. No GalNAc 3 -conjugated PS-modified 2′MOE ASO class effects were identified from the assessment of the integrated laboratory test data across all doses tested with either single or multidose regimens. The increase in potency supports an increase in the safety margin for this new chemical class of ASOs now under broad investigation in the clinic. Although the total exposure is limited in the initial phase 1 trials, ongoing and future investigations in patient populations will support evaluation of the effects of long-term exposure.
Overview
The claims and statistics of this paper haven’t been checked yet.
Run the check — free, no account needed. It reads the open-access text and checks the sources it cites.
Integrity signals
Registry
Cites
Statistics
Figures


Verification
Claims the paper makes
The claims and statistics of this paper haven’t been checked yet.
Run the check — free, no account needed. It reads the open-access text and checks the sources it cites.
Claims other papers make about this one
Each is checked against this paper’s own text: does it say what the citing paper says it does?
In the citing paper
“With regard to safety, there were no confirmed instances of reduced renal function or platelet count with vupanorsen, 2 issues that have been observed with some first-generation antisense oligonucleotides.16,17”
From Effect of Vupanorsen on Non–High-Density Lipoprotein Cholesterol Levels in Statin-Treated Patients With Elevated Cholesterol: TRANSLATE-TIMI 70 (2022) · cites this paper as [17]
Self-check
Percentages, sums and reported differences re-computed from the paper’s own numbers.
The self-check needs the paper’s full text.
Citations
Cites
Nusinersen versus Sham Control in Infantile-Onset Spinal Muscular Atrophy
Finkel, R. S., Mercuri, E., Darras, B. T., Connolly, A. M., Kuntz, N. L., Kirschner, J., Chiriboga, C. A., Saito, K., Servais, L., Tizzano, E., et al. (2017) · New England Journal of Medicine · doi:10.1056/nejmoa1702752 · Cited by 2,337
Inotersen Treatment for Patients with Hereditary Transthyretin Amyloidosis
Benson, M. D., Waddington‐Cruz, M., Berk, J. L., Polydefkis, M. J., Dyck, P. J. B., Wang, A. K., Planté‐Bordeneuve, V., Barroso, F. A., Merlini, G., Obici, L. P., et al. (2018) · New England Journal of Medicine · doi:10.1056/nejmoa1716793 · Cited by 1,483
Self-citationNusinersen versus Sham Control in Later-Onset Spinal Muscular Atrophy
Mercuri, E., Darras, B. T., Chiriboga, C. A., Day, J. W., Campbell, C., Connolly, A. M., Iannaccone, S. T., Kirschner, J., Kuntz, N. L., Saito, K., et al. (2018) · New England Journal of Medicine · doi:10.1056/nejmoa1710504 · Cited by 1,433
Pharmacokinetics, biodistribution and cell uptake of antisense oligonucleotides
Geary, R. S., Norris, D. A., Yu, R. Z., & Bennett, C. F. (2015) · Advanced Drug Delivery Reviews · doi:10.1016/j.addr.2015.01.008 · Cited by 870
Self-citationCrooke, S. T., Witztum, J. L., Bennett, C. F., & Baker, B. F. (2018) · Cell Metabolism · doi:10.1016/j.cmet.2018.03.004 · Cited by 841
Self-citationViney, N. J., van Capelleveen, J. C., Geary, R. S., Xia, S., Tami, J. A., Yu, R. Z., Marcovina, S. M., Hughes, S. G., Graham, M. J., Crooke, R. M., et al. (2016) · The Lancet · doi:10.1016/s0140-6736(16)31009-1 · Cited by 754
Self-citationPrakash, T. P., Graham, M., Yu, J., Carty, R., Low, A., Chappell, A., Schmidt, K., Zhao, C., Aghajan, M., Murray, H., et al. (2014) · Nucleic Acids Research · doi:10.1093/nar/gku531 · Cited by 588
Cellular uptake and trafficking of antisense oligonucleotides
Crooke, S. T., Wang, S., Vickers, T. A., Shen, W., & Liang, X.-H. (2017) · Nature Biotechnology · doi:10.1038/nbt.3779 · Cited by 582
Self-citationCardiovascular and Metabolic Effects of ANGPTL3 Antisense Oligonucleotides
Graham, M. J., Lee, R. G., Brandt, T. A., Tai, L.-J., Fu, W., Peralta, R., Yu, R., Hurh, E., Paz, E., McEvoy, B. W., et al. (2017) · New England Journal of Medicine · doi:10.1056/nejmoa1701329 · Cited by 573
Self-citationPharmacology of Antisense Drugs
Bennett, C. F., Baker, B. F., Pham, N. C., Swayze, E. E., & Geary, R. S. (2016) · The Annual Review of Pharmacology and Toxicology · doi:10.1146/annurev-pharmtox-010716-104846 · Cited by 445
Self-citationAntisense oligonucleotide pharmacokinetics and metabolism
Geary, R. S. (2009) · Expert Opinion on Drug Metabolism & Toxicology · doi:10.1517/17425250902877680 · Cited by 303
Self-citationYu, D., Pendergraff, H. M., Liu, J., Kordasiewicz, H. B., Cleveland, D. W., Swayze, E. E., Lima, W. F., Crooke, S. T., Prakash, T. P., & Corey, D. R. (2012) · Cell · doi:10.1016/j.cell.2012.08.002 · Cited by 277
Self-citationSelective inhibition of mutant Ha-ras mRNA expression by antisense oligonucleotides.
Monia, B. P., Johnston, J. F., Ecker, D. J., Zounes, M. A., Lima, W. F., & Freier, S. M. (1992) · Journal of Biological Chemistry · doi:10.1016/s0021-9258(19)88650-7 · Cited by 254
Yu, R., Kim, T.-W., Hong, A., Watanabe, T., Gaus, H., & Geary, R. (2007) · Drug Metabolism And Disposition · doi:10.1124/dmd.106.012401 · Cited by 226
Self-citationLiang, X., Shen, W., Sun, H., Migawa, M. T., Vickers, T. A., & Crooke, S. T. (2016) · Nature Biotechnology · doi:10.1038/nbt.3589 · Cited by 214
Self-citationRajeev, K. G., Nair, J. K., Jayaraman, M., Charissé, K., Taneja, N., O′Shea, J., Willoughby, J. L. S., Yucius, K., Nguyen, T. M., Shulga‐Morskaya, S., et al. (2015) · ChemBioChem · doi:10.1002/cbic.201500023 · Cited by 190
Liang, X., Sun, H., Shen, W., & Crooke, S. T. (2015) · Nucleic Acids Research · doi:10.1093/nar/gkv143 · Cited by 184
Self-citationGeary, R., Yu, R., Watanabe, T., Henry, S., Hardee, G., Chappell, A., Matson, J. E., Sasmor, H., Cummins, L., & Levin, A. (2003) · Drug Metabolism And Disposition · doi:10.1124/dmd.31.11.1419 · Cited by 158
Self-citationGraham, M. J., Crooke, S. T., Monteith, D., Cooper, S. R., Lemonidis, K. M., Stecker, K., Martin, M. J., & Crooke, R. M. (1998) · Journal of Pharmacology and Experimental Therapeutics · doi:10.1016/s0022-3565(24)37605-0 · Cited by 140
Self-citationYu, R. Z., Baker, B. F., Chappell, A. E., Geary, R. S., Cheung, E., & Levin, A. A. (2002) · Analytical Biochemistry · doi:10.1006/abio.2002.5576 · Cited by 138
Self-citationClinical pharmacokinetics of second generation antisense oligonucleotides
Yu, R. Z., Grundy, J. S., & Geary, R. S. (2012) · Expert Opinion on Drug Metabolism & Toxicology · doi:10.1517/17425255.2013.737320 · Cited by 136
Self-citation“Antisense Drug Technology. Principles, Strategies, and Applications”
Lee, G. (2002) · European Journal of Pharmaceutics and Biopharmaceutics · doi:10.1016/s0939-6411(02)00090-5 · Cited by 135
Duell, P. B., Santos, R. D., Kirwan, B., Witztum, J. L., Tsimikas, S., & Kastelein, J. J. P. (2016) · Journal of clinical lipidology · doi:10.1016/j.jacl.2016.04.013 · Cited by 132
Self-citationCrooke, S. T., Baker, B. F., Witztum, J. L., Kwoh, T. J., Pham, N. C., Salgado, N., McEvoy, B. W., Cheng, W., Hughes, S. G., Bhanot, S., et al. (2017) · Nucleic Acid Therapeutics · doi:10.1089/nat.2016.0650 · Cited by 129
Self-citationCrooke, S. T., Baker, B. F., Kwoh, T. J., Cheng, W., Schulz, D. J., Xia, S., Salgado, N. R., Bui, H., Hart, C. E., Burel, S. A., et al. (2016) · Molecular Therapy · doi:10.1038/mt.2016.136 · Cited by 118
Self-citationShen, W., Hoyos, C. L. D., Sun, H., Vickers, T. A., Liang, X., & Crooke, S. T. (2018) · Nucleic Acids Research · doi:10.1093/nar/gky060 · Cited by 111
Self-citationYu, R. Z., Geary, R. S., Flaim, J., Riley, G. C., Tribble, D. L., vanVliet, A. A., & Wedel, M. K. (2008) · Clinical Pharmacokinetics · doi:10.2165/0003088-200948010-00003 · Cited by 102
Self-citationDisposition and Pharmacology of a GalNAc3-conjugated ASO Targeting Human Lipoprotein (a) in Mice
Yu, R. Z., Graham, M. J., Post, N. M., Riney, S., Zanardi, T. A., Hall, S., Burkey, J., Shemesh, C. S., Prakash, T. P., Seth, P. P., et al. (2016) · Molecular Therapy — Nucleic Acids · doi:10.1038/mtna.2016.26 · Cited by 97
Self-citationEfficient Synthesis and Biological Evaluation of 5′-GalNAc Conjugated Antisense Oligonucleotides
Østergaard, M. E., Yu, J., Kinberger, G. A., Wan, W. B., Migawa, M. T., Vasquez, G., Schmidt, K., Gaus, H. J., Murray, H. M., Low, A., et al. (2015) · Bioconjugate Chemistry · doi:10.1021/acs.bioconjchem.5b00265 · Cited by 82
Mullick, A. E., Yeh, S. T., Graham, M. J., Engelhardt, J. A., Prakash, T. P., & Crooke, R. M. (2017) · Hypertension · doi:10.1161/hypertensionaha.117.09755 · Cited by 76
Yu, R. Z., Gunawan, R., Post, N. M., Zanardi, T. A., Hall, S., Burkey, J., Kim, T., Graham, M. J., Prakash, T. P., Seth, P. P., et al. (2016) · Nucleic Acid Therapeutics · doi:10.1089/nat.2016.0623 · Cited by 75
Self-citationThe Effects of 2′- O -Methoxyethyl Oligonucleotides on Renal Function in Humans
Crooke, S. T., Baker, B. F., Pham, N. C., Hughes, S. G., Kwoh, T. J., Cai, D., Tsimikas, S., Geary, R. S., & Bhanot, S. (2017) · Nucleic Acid Therapeutics · doi:10.1089/nat.2017.0693 · Cited by 69
Self-citationMiller, C. M., Tanowitz, M., Donner, A. J., Prakash, T. P., Swayze, E. E., Harris, E. N., & Seth, P. P. (2018) · Nucleic Acid Therapeutics · doi:10.1089/nat.2017.0709 · Cited by 65
Yu, R. Z., Grundy, J. S., Henry, S. P., Kim, T., Norris, D. A., Burkey, J., Wang, Y., Vick, A., & Geary, R. S. (2015) · Molecular Therapy — Nucleic Acids · doi:10.1038/mtna.2014.69 · Cited by 50
Self-citationGaudet, D., DIGENIO, A. G., Alexander, V. J., Arca, M., Jones, A. F., Stroes, E. S. G., Bergeron, J., Civeira, F., Hemphill, L., Blom, D. J., et al. (2017) · Journal of clinical lipidology · doi:10.1016/j.jacl.2017.04.071 · Cited by 44
Self-citationKinberger, G. A., Prakash, T. P., Yu, J., Vasquez, G., Low, A., Chappell, A. E., Schmidt, K., Murray, H. M., Gaus, H. J., Swayze, E. E., et al. (2016) · Bioorganic & Medicinal Chemistry Letters · doi:10.1016/j.bmcl.2016.05.084 · Cited by 43
Yu, R. Z., Warren, M. S., Watanabe, T. A., Nichols, B., Jahic, M., Huang, J., Burkey, J., Geary, R. S., Henry, S. P., & Wang, Y. (2016) · Nucleic Acid Therapeutics · doi:10.1089/nat.2015.0588 · Cited by 26
Self-citationIs Estradiol a Biomarker of Type 2 Diabetes Risk in Postmenopausal Women?
Mauvais‐Jarvis, F. (2017) · Diabetes · doi:10.2337/dbi16-0063 · Cited by 22
Donner, A. J., Bell, T. A., Greenlee, S., Graham, M. J., & Crooke, R. M. (2018) · Nucleic Acid Therapeutics · doi:10.1089/nat.2018.0723 · Cited by 17
Research works printed but not linked: 10
- Crooke ST, , Vickers T, , Lima W, and Wu H. (2008). Mechanisms of antisense drug action, an introduction. In: Antisense Drug Technology: Principles, Strategies, and Applications, 2nd edn. Crooke ST, ed. CRC Press, Boca Raton, FL, pp 3–46.
- Swayze EE, and Bhat B. (2008). The medicinal chemistry of oligonucleotides. In: Antisense Drug Technology: Principles, Strategies, and Applications, 2nd edn. Crooke ST, ed. CRC Press, Boca Raton, pp 143–182.
- Levin AA, , Yu RZ, and Geary RS. (2008). Basic principles of the pharmacokinetics of antisense oligonucleotide drugs. In: Antisense Drug Technology: Principles, Strategies, and Applications, 2nd edn. Crooke ST, ed. CRC Press, Boca Raton, FL, pp 183–215.
- Iversen PL. (2008). Morpholinos. In: Antisense Drug Technology: Principles, Strategies, and Applications. Crooke ST, ed. CRC Press, Boca Raton, pp 565–582.
- Manoharan M, and Rajeev KG. (2008). Utilizing chemistry to harness RNA interference pathways for therapeutics: Chemically modified siRNA and Anatgomirs. In: Antisense Drug Technology: Principles, Strategies, and Applications. Crooke ST, ed. CRC Press, Boca Raton, pp 437–464.
- Mercuri E, , Finkel R, , Kirschner J, , Chiriboga C, , Kuntz N, , Sun P, , Gheuens S, , Bennett C, , Schneider E, and Farwell W. (2017). Efficacy and safety of nusinersen in children with later-onset spinal muscular atrophy (SMA): end of study results from the phase 3 CHERISH study. Neuromuscul Disord, 27:S210. · DOI
- Lima W, , Wu H, and Crooke ST. (2008). The RNase H mechanism. In: Antisense Drug Technology: Principles, Strategies, and Applications, 2nd edn. Crooke ST, ed. CRC Press, Boca Raton, FL, pp 47–74.
- Geary RS, , Yu RZ, , Siwkowski A, and Levin AA. (2008). Pharmacokinetic/pharmacodynamic properties of phosphorothioate 2′-O-(2-methoxyethyl)-modified antisense oligonucleotides in animals and man. In: Antisense Drug Technology: Principles, Strategies, and Applications, 2nd edn. Crooke ST, ed. CRC Press, Boca Raton, FL, pp 305–326.
- Bennett CF. (2008). Pharmacological properties of 2′-methoxyethyl-modified oligonucleotides. In: Antisense Drug Technology: Principles, Strategies, and Applications, 2nd edn. Crooke ST, ed. CRC Press, Boca Raton, FL, pp 273–303.
- Ämmälä C, , Ahlstedt I, , Andersson E-M, , Andersson P, , Cavallin E, , Drury W, , Hung G, , Jansson-Löfmark R, , Johansson C, et al. (2017). The GLP1 receptor as a homing beacon for targeted delivery to pancreatic ß-cells: quantitating tissue selective productive uptake of antisense oligonucleotides. Diabetes, 66:A568.
Cited by
Sorted by citations
Lipoprotein(a) Reduction in Persons with Cardiovascular Disease
Tsimikas, S., Karwatowska-Prokopczuk, E., Gouni-Berthold, I., Tardif, J.-C., Baum, S. J., Steinhagen-Thiessen, E., Shapiro, M. D., Stroes, E. S., Moriarty, P. M., Nordestgaard, B. G., et al. (2020) · New England Journal of Medicine · doi:10.1056/nejmoa1905239 · Cited by 1,094
Self-citationAntisense technology: an overview and prospectus
Crooke, S. T., Baker, B. F., Crooke, R. M., & Liang, X.-H. (2021) · Nature Reviews Drug Discovery · doi:10.1038/s41573-021-00162-z · Cited by 775
Self-citationRecent Progress in Aptamer Discoveries and Modifications for Therapeutic Applications
Ni, S., Zhuo, Z., Pan, Y., Yu, Y., Li, F., Liu, J., Wang, L., Wu, X., Li, D., Wan, Y., et al. (2020) · ACS Applied Materials & Interfaces · doi:10.1021/acsami.0c05750 · Cited by 605
Delivery of oligonucleotides to the liver with GalNAc: From research to registered therapeutic drug.
Debacker, A. J., Voutila, J., Catley, M., Blakey, D., & Habib, N. (2020) · Molecular Therapy · doi:10.1016/j.ymthe.2020.06.015 · Cited by 424
Phosphorothioate modified oligonucleotide–protein interactions
Crooke, S. T., Vickers, T. A., & Liang, X.-H. (2020) · Nucleic Acids Research · doi:10.1093/nar/gkaa299 · Cited by 372
Self-citation
Metadata
- Authors
- Crooke, S. T., Baker, B. F., Xia, S., Yu, R. Z., Viney, N. J., Wang, Y., Tsimikas, S., & Geary, R. S.
- Affiliations
- Ionis Pharmaceuticals (United States) (US)
- Corresponding author
- Crooke, Stanley T.
- ORCID
- Venue
- Nucleic Acid Therapeutics
- Publisher
- SAGE Publications
- Published
- 2019-02-01
- Volume
- 29
- Issue
- 1
- Pages
- 16-32
- ISSN
- 2159-3337 (ISSN-L)
- 2159-3345
- PMC
- PMC6386089
- OpenAlex
- W2906651560
- Cited by
- 127
- References
- 39
- Citations by year
- 2026: 14 · 2025: 18 · 2024: 12 · 2023: 17 · 2022: 17 · 2021: 20 · 2020: 21 · 2019: 8
- FWCI
- 4.36
- Type
- journal article
- Language
- en
- Open access
- hybrid
- doi.org
- Licence
- Locations
- Nucleic Acid Therapeutics (publishedVersion, cc-by-nc)
- Europe PMC (PubMed Central) (publishedVersion, other-oa)
- PubMed Central (publishedVersion, cc-by-nc)
- PubMed (publishedVersion)
- eScholarship (California Digital Library) (submittedVersion, cc-by-nc)
- Funders
- Ionis Pharmaceuticals
- Topics
- Life Sciences › Biochemistry, Genetics and Molecular Biology › Molecular Biology › RNA Interference and Gene Delivery
- Life Sciences › Biochemistry, Genetics and Molecular Biology › Molecular Biology › DNA and Nucleic Acid Chemistry
- Life Sciences › Pharmacology, Toxicology and Pharmaceutics › Pharmacology › Pharmacogenetics and Drug Metabolism
- Keywords
- phosphorothioate modification, ASGR1, pharmacokinetics, pharmacodynamics, safety profile, dose-ranging, healthy volunteers, RNA-targeted therapeutics
- MeSH terms
- Acetylgalactosamine, Dose-Response Relationship, Drug, Female, Humans, Male, Middle Aged, RNA, Structure-Activity Relationship, Oligonucleotides, Antisense, Hepatocytes, Asialoglycoprotein Receptor, Biomarkers, Pharmacological, Phosphorothioate Oligonucleotides, Healthy Volunteers
About these checks
Registry, retraction, Cites and statistics results are computed, not judged, with one exception: a printed reference that no index lists is read once by a model before it counts as a citation error. Claims are extracted by a model and kept only when their quote appears verbatim in the text; each cited source is then checked, with a model’s help, for whether it says what the claim relies on. Those verdicts can be wrong — read the claim’s quote and the cited source before relying on one.
Statistics and arithmetic are recomputed, not judged.
Confidence bands are shown only for fields calibrated on our annotated test set. None is calibrated yet, so no band is shown.
What counts as a claim ›How we measure confidence ›How we check this ›
Are you an author, or do you see a problem with this page? Request a review
