

The DOI matches its Crossref record; 28 of the 29 references it cites were found in a registry or an index.
A systematic evaluation of normalization methods in quantitative label-free proteomics
Open accessAbstract
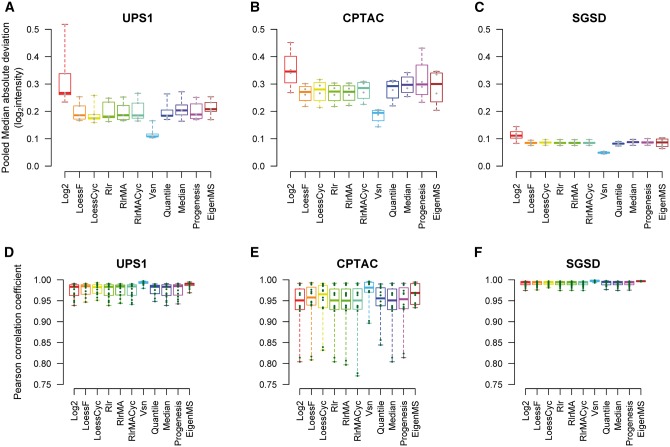
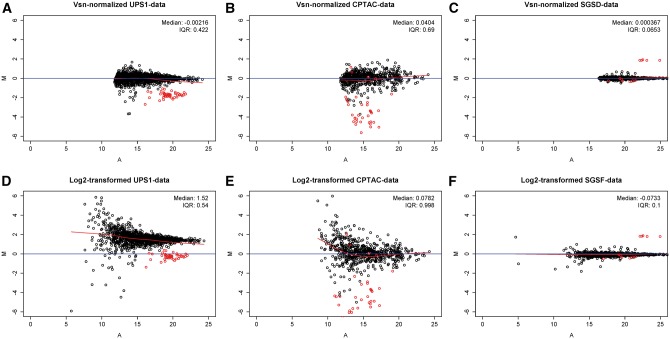
To date, mass spectrometry (MS) data remain inherently biased as a result of reasons ranging from sample handling to differences caused by the instrumentation. Normalization is the process that aims to account for the bias and make samples more comparable. The selection of a proper normalization method is a pivotal task for the reliability of the downstream analysis and results. Many normalization methods commonly used in proteomics have been adapted from the DNA microarray techniques. Previous studies comparing normalization methods in proteomics have focused mainly on intragroup variation. In this study, several popular and widely used normalization methods representing different strategies in normalization are evaluated using three spike-in and one experimental mouse label-free proteomic data sets. The normalization methods are evaluated in terms of their ability to reduce variation between technical replicates, their effect on differential expression analysis and their effect on the estimation of logarithmic fold changes. Additionally, we examined whether normalizing the whole data globally or in segments for the differential expression analysis has an effect on the performance of the normalization methods. We found that variance stabilization normalization (Vsn) reduced variation the most between technical replicates in all examined data sets. Vsn also performed consistently well in the differential expression analysis. Linear regression normalization and local regression normalization performed also systematically well. Finally, we discuss the choice of a normalization method and some qualities of a suitable normalization method in the light of the results of our evaluation.
Overview
The claims and statistics of this paper haven’t been checked yet.
Free: it reads the open-access text and checks the first 5 claims that cite a source we can check. Create a free account to check every claim.
Integrity signals
Registry
Cites
Statistics
Figures



Verification
Claims the paper makes
The claims and statistics of this paper haven’t been checked yet.
Free: it reads the open-access text and checks the first 5 claims that cite a source we can check. Create a free account to check every claim.
Claims other papers make about this one
Each is checked against this paper’s own text: does it say what the citing paper says it does?
The source backs part of the claim, not all of it — or backs it for a different population, condition or comparison.
In the citing paper
“Here, we highlight an advantage of SWATH-MS data; i.e., as with MS1/DDA-based quantification and, unlike more classical targeted methods such as SRM, there are large numbers of peptides available for global normalization that can be used in sample types where the assumptions underlying this type of normalization are valid65, 66.”
From Multi-laboratory assessment of reproducibility, qualitative and quantitative performance of SWATH-mass spectrometry (2017) · cites this paper as [65]
Experimental — accuracy not yet measured
Self-check
Percentages, sums and reported differences re-computed from the paper’s own numbers.
The self-check needs the paper’s full text.
Citations
Cites
limma powers differential expression analyses for RNA-sequencing and microarray studies
Ritchie, M. E., Phipson, B., Wu, D., Hu, Y., Law, C. W., Shi, W., & Smyth, G. K. (2015) · Nucleic Acids Research · doi:10.1093/nar/gkv007 · Cited by 40,458
Modern Applied Statistics with S
Venables, W. N., & Ripley, B. D. (2002) · Statistics and Computing · doi:10.1007/978-0-387-21706-2 · Cited by 24,305
Bolstad, B. M., Irizarry, R. A., Åstrand, M., & Speed, T. P. (2003) · Bioinformatics · doi:10.1093/bioinformatics/19.2.185 · Cited by 8,266
Cox, J., Hein, M. Y., Luber, C. A., Paron, I., Nagaraj, N., & Mann, M. (2014) · Molecular & Cellular Proteomics · doi:10.1074/mcp.m113.031591 · Cited by 5,180
Modern Applied Statistics with S Fourth edition
Venables, W. N., & Ripley, B. D. (2002) · Cited by 2,538
Huber, W., von Heydebreck, A., Sültmann, H., Poustka, A., & Vingron, M. (2002) · Bioinformatics · doi:10.1093/bioinformatics/18.suppl_1.s96 · Cited by 2,440
Microarray data normalization and transformation
Quackenbush, J. (2002) · Nature Genetics · doi:10.1038/ng1032 · Cited by 1,975
Use of a cDNA microarray to analyse gene expression patterns in human cancer
(1996) · Nature Genetics · doi:10.1038/ng1296-457 · Cited by 1,951
Bruderer, R., Bernhardt, O. M., Gandhi, T., Miladinović, S. M., Cheng, L.-Y., Messner, S., Ehrenberger, T., Zanotelli, V., Butscheid, Y., Escher, C., et al. (2015) · Molecular & Cellular Proteomics · doi:10.1074/mcp.m114.044305 · Cited by 1,238
Tabb, D. L., Vega-Montoto, L., Rudnick, P. A., Variyath, A. M., Ham, A.-J. L., Bunk, D. M., Kilpatrick, L. E., Billheimer, D. D., Blackman, R. K., Cardasis, H. L., et al. (2010) · Journal of Proteome Research · doi:10.1021/pr9006365 · Cited by 551
Cited by
Collins, B. C., Hunter, C. L., Liu, Y., Schilling, B., Rosenberger, G., Bader, S. L., Chan, D. W., Gibson, B. W., Gingras, A.-C., Held, J. M., et al. (2017) · Nature Communications · doi:10.1038/s41467-017-00249-5 · Cited by 576
NOREVA: normalization and evaluation of MS-based metabolomics data
Li, B., Tang, J., Yang, Q., Li, S., Cui, X., Li, Y., Chen, Y., Xue, W., Li, X., & Zhu, F. (2017) · Nucleic Acids Research · doi:10.1093/nar/gkx449 · Cited by 352
Bioinformatics Methods for Mass Spectrometry-Based Proteomics Data Analysis
Chen, C., Hou, J., Tanner, J. J., & Cheng, J. (2020) · International Journal of Molecular Sciences · doi:10.3390/ijms21082873 · Cited by 280
“For linear regression-based normalization such as RlrMA and LinRegMA [114], they assume that bias in the measurements and the scale of the observed protein abundance are linearly dependent.”
MethodNakayasu, E. S., Gritsenko, M., Piehowski, P. D., Gao, Y., Orton, D. J., Schepmoes, A. A., Fillmore, T. L., Frohnert, B. I., Rewers, M., Krischer, J. P., et al. (2021) · Nature Protocols · doi:10.1038/s41596-021-00566-6 · Cited by 275
Quantitative Mass Spectrometry-Based Proteomics: An Overview
Rozanova, S., Barkovits, K., Nikolov, M., Schmidt, C., Urlaub, H., & Marcus, K. (2021) · Methods in Molecular Biology · doi:10.1007/978-1-0716-1024-4_8 · Cited by 275
Metadata
- Authors
- Välikangas, T., Suomi, T., & Elo, L. L.
- Affiliations
- Turku Centre for Biotechnology (FI)
- University of Turku (FI)
- Corresponding author
- Elo, Laura L.
- Venue
- Briefings in Bioinformatics
- Publisher
- Oxford University Press (OUP)
- Published
- 2016-10-02
- Volume
- 19
- Issue
- 1
- Pages
- bbw095
- ISSN
- 1467-5463 (ISSN-L)
- 1477-4054
- PMC
- PMC5862339
- OpenAlex
- W2524808906
- Cited by
- 336
- References
- 29
- Citations by year
- 2026: 24 · 2025: 43 · 2024: 54 · 2023: 47 · 2022: 48 · 2021: 34 · 2020: 34 · 2019: 28 · 2018: 15 · 2017: 6 · 2016: 1
- FWCI
- 8.29
- Type
- journal article
- Language
- en
- Open access
- hybrid
- doi.org
- Licence
- cc-by
- Locations
- Briefings in Bioinformatics (publishedVersion, cc-by)
- Europe PMC (PubMed Central) (publishedVersion, cc-by)
- PubMed Central (publishedVersion, cc-by)
- PubMed (publishedVersion)
- UTUPub (University of Turku) (submittedVersion)
- Topics
- Physical Sciences › Chemistry › Spectroscopy › Advanced Proteomics Techniques and Applications
- Life Sciences › Biochemistry, Genetics and Molecular Biology › Molecular Biology › Gene expression and cancer classification
- Life Sciences › Biochemistry, Genetics and Molecular Biology › Molecular Biology › Bioinformatics and Genomic Networks
- Keywords
- normalization methods, label-free quantitative proteomics, mass spectrometry data, technical replicates, differential expression analysis
- MeSH terms
- Animals, Humans, Peptide Mapping, Reproducibility of Results, Models, Statistical, Proteome, Databases, Protein, Proteomics, Mice
About these checks
Registry, retraction, Cites and statistics results are computed, not judged, with one exception: a printed reference that no index lists is read once by a model before it counts as a citation error. Claims are extracted by a model and kept only when their quote appears verbatim in the text; each cited source is then checked, with a model’s help, for whether it says what the claim relies on. Those verdicts can be wrong — read the claim’s quote and the cited source before relying on one.
Statistics and arithmetic are recomputed, not judged.
Confidence bands are shown only for fields calibrated on our annotated test set. None is calibrated yet, so no band is shown.
What counts as a claim ›How we measure confidence ›How we check this ›
Are you an author, or do you see a problem with this page? Request a review
How to cite
Cite CoChat for the checks on this page, and the paper for its own findings.
- This page
- CoChat. (2026). Citation check: A systematic evaluation of normalization methods in quantitative label-free proteomics. https://app.cochat.ai/papers/10.1093/bib/bbw095
- The paper
- Välikangas, T., Suomi, T., & Elo, L. L. (2016). A systematic evaluation of normalization methods in quantitative label-free proteomics. Briefings in Bioinformatics. https://doi.org/10.1093/bib/bbw095
Data sources
Bibliographic data: Semantic Scholar, OpenAlex, Crossref.
Contains information from the Semantic Scholar Academic Graph Datasets, made available under the ODC Attribution License (ODC-BY 1.0).
Semantic Scholar’s data is described in: Kinney, R., et al. (2023). The Semantic Scholar Open Data Platform. arXiv:2301.10140.
