

The DOI matches its Crossref record; 96 of the 96 references it cites were found in a registry or an index.
Disentangling the complexity of low complexity proteins
Abstract
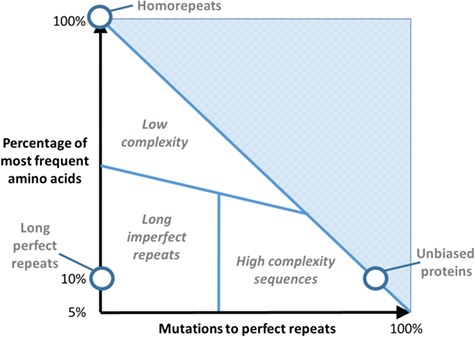
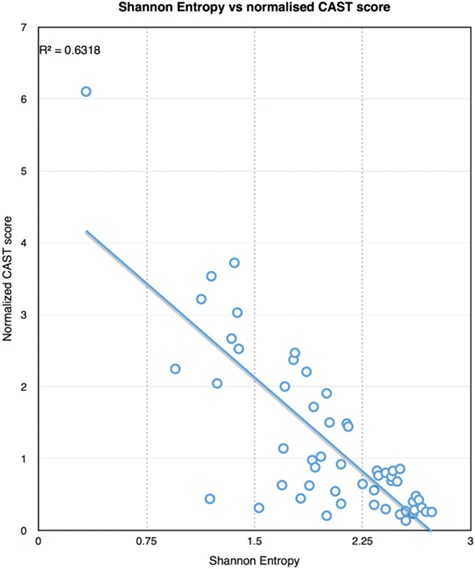
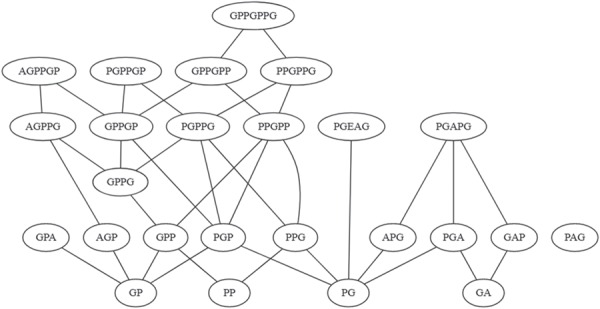
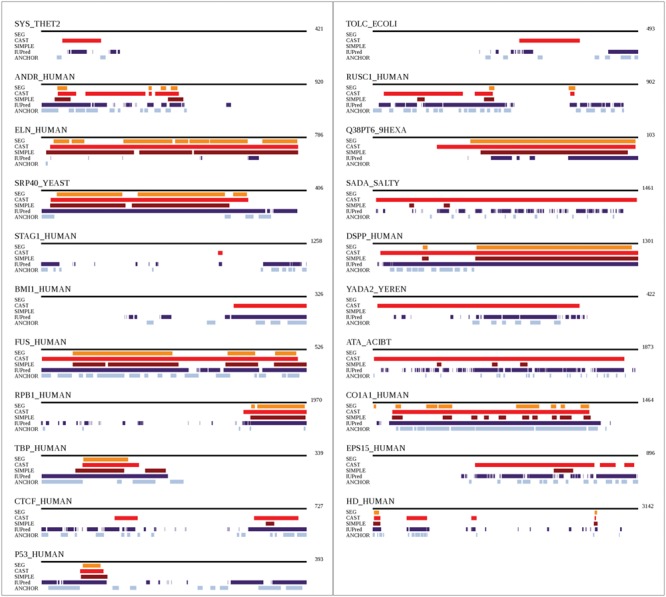
There are multiple definitions for low complexity regions (LCRs) in protein sequences, with all of them broadly considering LCRs as regions with fewer amino acid types compared to an average composition. Following this view, LCRs can also be defined as regions showing composition bias. In this critical review, we focus on the definition of sequence complexity of LCRs and their connection with structure. We present statistics and methodological approaches that measure low complexity (LC) and related sequence properties. Composition bias is often associated with LC and disorder, but repeats, while compositionally biased, might also induce ordered structures. We illustrate this dichotomy, and more generally the overlaps between different properties related to LCRs, using examples. We argue that statistical measures alone cannot capture all structural aspects of LCRs and recommend the combined usage of a variety of predictive tools and measurements. While the methodologies available to study LCRs are already very advanced, we foresee that a more comprehensive annotation of sequences in the databases will enable the improvement of predictions and a better understanding of the evolution and the connection between structure and function of LCRs. This will require the use of standards for the generation and exchange of data describing all aspects of LCRs. Short abstract: There are multiple definitions for low complexity regions (LCRs) in protein sequences. In this critical review, we focus on the definition of sequence complexity of LCRs and their connection with structure. We present statistics and methodological approaches that measure low complexity (LC) and related sequence properties. Composition bias is often associated with LC and disorder, but repeats, while compositionally biased, might also induce ordered structures. We illustrate this dichotomy, plus overlaps between different properties related to LCRs, using examples.
Overview
The claims and statistics of this paper haven’t been checked yet.
Run the check — free, no account needed. It reads the open-access text and checks the sources it cites.
Integrity signals
Registry
Cites
Statistics
Figures
Verification
Claims the paper makes
The claims and statistics of this paper haven’t been checked yet.
Run the check — free, no account needed. It reads the open-access text and checks the sources it cites.
Claims other papers make about this one
Each is checked against this paper’s own text: does it say what the citing paper says it does?
In the citing paper
“Specifically, homology search methods such as BLAST usually have built-in filters that hinder alignment to low complexity regions (which often exist as part of repetitive regions or are repetitive regions) (106), and are not adapted to accurately align homologous sequences with different numbers of TR units.”
From Tandem repeats lead to sequence assembly errors and impose multi-level challenges for genome and protein databases (2019) · cites this paper as [106]
Self-check
Percentages, sums and reported differences re-computed from the paper’s own numbers.
The self-check needs the paper’s full text.
Citations
Cites
Predicting coiled coils from protein sequences.
Lupas, A., Van Dyke, M., & Stock, J. (1991) · Science · doi:10.1126/science.252.5009.1162 · Cited by 3,953
Germline P Granules Are Liquid Droplets That Localize by Controlled Dissolution/Condensation
Brangwynne, C. P., Eckmann, C. R., Courson, D. S., Rybarska, A., Hoege, C., Gharakhani, J., Jülicher, F., & Hyman, A. A. (2009) · Science · doi:10.1126/science.1172046 · Cited by 3,202
Intrinsically disordered proteins in cellular signalling and regulation
Wright, P. E., & Dyson, H. J. (2014) · Nature Reviews Molecular Cell Biology · doi:10.1038/nrm3920 · Cited by 2,490
Kato, M., Han, T. W., Xie, S., Shi, K., Du, X., Wu, L. C., Mirzaei, H., Goldsmith, E. J., Longgood, J., Pei, J., et al. (2012) · Cell · doi:10.1016/j.cell.2012.04.017 · Cited by 2,012
Dosztányi, Z., Csizmók, V., Tompa, P., & Simon, I. (2005) · Computer applications in the biosciences · doi:10.1093/bioinformatics/bti541 · Cited by 1,943
Intrinsically Disordered Proteins in Human Diseases: Introducing the D2Concept
Uversky, V. N., Oldfield, C. J., & Dunker, A. K. (2008) · Annual Review of Biophysics · doi:10.1146/annurev.biophys.37.032807.125924 · Cited by 1,410
Intrinsic Disorder in Cell-signaling and Cancer-associated Proteins
Iakoucheva, L. M., Brown, C. J., Lawson, J. D., Obradović, Z., & Dunker, A. K. (2002) · Journal of Molecular Biology · doi:10.1016/s0022-2836(02)00969-5 · Cited by 1,214
Dosztányi, Z., Csizmók, V., Tompa, P., & Simon, I. (2005) · Journal of Molecular Biology · doi:10.1016/j.jmb.2005.01.071 · Cited by 1,019
Das, R. K., & Pappu, R. V. (2013) · Proceedings of the National Academy of Sciences · doi:10.1073/pnas.1304749110 · Cited by 1,008
Function and structure of inherently disordered proteins
Dunker, A. K., Silman, I., Uversky, V. N., & Sussman, J. L. (2008) · Current Opinion in Structural Biology · doi:10.1016/j.sbi.2008.10.002 · Cited by 963
Cited by
Phase separation and neurodegenerative diseases: a disturbance in the force
Zbinden, A., Pérez-Berlanga, M., De Rossi, P., & Polymenidou, M. (2020) · Developmental Cell · doi:10.1016/j.devcel.2020.09.014 · Cited by 500
Tørresen, O. K., Star, B., Mier, P., Andrade-Navarro, M. A., Bateman, A., Jarnot, P., Gruca, A., Grynberg, M., Kajava, A. V., Promponas, V. J., et al. (2019) · Nucleic Acids Research · doi:10.1093/nar/gkz841 · Cited by 347
Self-citationThe Charged Linker Modulates the Conformations and Molecular Interactions of Hsp90
López, A., Elimelech, A. R., Klimm, K., & Sattler, M. (2021) · ChemBioChem · doi:10.1002/cbic.202000699 · Cited by 30
Morató, A., Elena-Real, C. A., Popovic, M., Fournet, A., Zhang, K., Allemand, F., Sibille, N., Urbanek, A., & Bernadó, P. (2020) · Biomolecules · doi:10.3390/biom10101458 · Cited by 12
Self-citationBanfield, J. F., Valentin-Alvarado, L. E., Shi, L.-D., Robinson, C. M., Bamert, R. S., Coulibaly, F., Barth, Z. K., Aylward, F. O., Schoelmerich, M. C., Lei, S., et al. (2025) · Nature Communications · doi:10.1038/s41467-025-65646-7 · Cited by 4
Metadata
- Authors
- Mier, P., Paladin, L., Tamana, S., Petrosian, S., Hajdu-Soltész, B., Urbanek, A., Gruca, A., Plewczynski, D., Grynberg, M., Bernadó, P., Gáspári, Z., Ouzounis, C. A., Promponas, V. J., Kajava, A. V., Hancock, J. M., Tosatto, S. C. E., Dosztanyi, Z., & Andrade-Navarro, M. A.
- Affiliations
- Institute of Organismic and Molecular Evolution, Johannes Gutenberg University of Mainz, Mainz, Germany
- Department of Biomedical Science, University of Padova, Padova, Italy
- Bioinformatics Research Laboratory, Department of Biological Sciences, University of Cyprus, Nicosia, Cyprus
- Biological Computation and Process Laboratory, Chemical Process & Energy Resources Institute, Centre for Research & Technology Hellas, Thessalonica, Greece
- MTA-ELTE Lendület Bioinformatics Research Group, Department of Biochemistry, Eötvös Loránd University, Budapest, Hungary
- Centre de Biochimie Structurale, INSERM, CNRS, Université de Montpellier, Montpellier, France
- Institute of Informatics, Silesian University of Technology, Gliwice, Poland
- Center of New Technologies, University of Warsaw, Warsaw, Poland
- Institute of Biochemistry and Biophysics, Warsaw, Poland
- Faculty of Information Technology and Bionics, Pázmány Péter Catholic University, Budapest, Hungary
- Centre de Recherche en Biologie Cellulaire de Montpellier, CNRS-UMR, Institut de Biologie Computationnelle, Universite de Montpellier, Montpellier, France
- Earlham Institute, Norwich, UK
- Venue
- Briefings in Bioinformatics
- Publisher
- Oxford University Press (OUP)
- Published
- 2019-01-30
- Volume
- 21
- Issue
- 2
- Pages
- 458-472
- ISSN
- 1467-5463
- 1477-4054
- PMC
- PMC7299295
- Cited by
- 104
- References
- 96
- Language
- en
- Funders
- Institute of Informatics (BK-213/RAU2/2018)
- National Research Development and Innovation Office (NN124363)
- Hungarian Academy of Sciences (LP2014-18)
- European Research Council (648030)
- European Union (778247)
- COST Association (BM1405)
- János Bolyai Research Scholar
About these checks
Registry, retraction, Cites and statistics results are computed, not judged, with one exception: a printed reference that no index lists is read once by a model before it counts as a citation error. Claims are extracted by a model and kept only when their quote appears verbatim in the text; each cited source is then checked, with a model’s help, for whether it says what the claim relies on. Those verdicts can be wrong — read the claim’s quote and the cited source before relying on one.
Statistics and arithmetic are recomputed, not judged.
Confidence bands are shown only for fields calibrated on our annotated test set. None is calibrated yet, so no band is shown.
What counts as a claim ›How we measure confidence ›How we check this ›
Are you an author, or do you see a problem with this page? Request a review
How to cite
Cite CoChat for the checks on this page, and the paper for its own findings.
- This page
- CoChat. (2026). Citation check: Disentangling the complexity of low complexity proteins. https://app.cochat.ai/papers/10.1093/bib/bbz007
- The paper
- Mier, P., Paladin, L., Tamana, S., Petrosian, S., Hajdu-Soltész, B., Urbanek, A., Gruca, A., Plewczynski, D., Grynberg, M., Bernadó, P., Gáspári, Z., Ouzounis, C. A., Promponas, V. J., Kajava, A. V., Hancock, J. M., Tosatto, S. C. E., Dosztanyi, Z., & Andrade-Navarro, M. A. (2020). Disentangling the complexity of low complexity proteins. Briefings in Bioinformatics. https://doi.org/10.1093/bib/bbz007
Data sources
Bibliographic data: Semantic Scholar, OpenAlex, Crossref.
Contains information from the Semantic Scholar Academic Graph Datasets, made available under the ODC Attribution License (ODC-BY 1.0).
Semantic Scholar’s data is described in: Kinney, R., et al. (2023). The Semantic Scholar Open Data Platform. arXiv:2301.10140.
