

The DOI matches its Crossref record; 12 of the 12 references it cites were found in a registry or an index.
arrayQualityMetrics—a bioconductor package for quality assessment of microarray data
Open accessAbstract
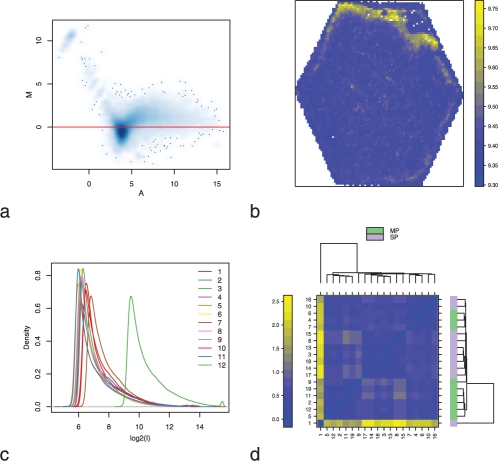
Summary:: The assessment of data quality is a major concern in microarray analysis. arrayQualityMetrics is a Bioconductor package that provides a report with diagnostic plots for one or two colour microarray data. The quality metrics assess reproducibility, identify apparent outlier arrays and compute measures of signal-to-noise ratio. The tool handles most current microarray technologies and is amenable to use in automated analysis pipelines or for automatic report generation, as well as for use by individuals. The diagnosis of quality remains, in principle, a context-dependent judgement, but our tool provides powerful, automated, objective and comprehensive instruments on which to base a decision. Availability:: arrayQualityMetrics is a free and open source package, under LGPL license, available from the Bioconductor project at www.bioconductor.org. A users guide and examples are provided with the package. Some examples of HTML reports generated by arrayQualityMetrics can be found at http://www.microarray-quality.org Contact:: audrey@ebi.ac.uk Supplementary information:: Supplementary data are available at Bioinformatics online.
Overview
The claims and statistics of this paper haven’t been checked yet.
Free: it reads the open-access text and checks the first 5 claims that cite a source we can check. Create a free account to check every claim.
Integrity signals
Registry
Cites
Statistics
Figures
Verification
Claims the paper makes
The claims and statistics of this paper haven’t been checked yet.
Free: it reads the open-access text and checks the first 5 claims that cite a source we can check. Create a free account to check every claim.
Claims other papers make about this one
Each is checked against this paper’s own text: does it say what the citing paper says it does?
In the citing paper
“Three RNA deep sequencing quality control measurements were performed to detect outliers and batch effects associated with the dataset: (a) L 1 distance between samples, (b) PCAs, and (c) similarity of density estimates of abundance values (53).”
From Development of an in vitro human liver system for interrogating nonalcoholic steatohepatitis (2016) · cites this paper as [53]
Self-check
Percentages, sums and reported differences re-computed from the paper’s own numbers.
The self-check needs the paper’s full text.
Citations
Cites
Bioconductor: open software development for computational biology and bioinformatics
Gentleman, R. C., Carey, V. J., Bates, D. M., Bolstad, B., Dettling, M., Dudoit, S., Ellis, B., Gautier, L., Ge, Y., Gentry, J., et al. (2004) · Genome Biology · doi:10.1186/gb-2004-5-10-r80 · Cited by 12,172 · cited 1×
“Availability: arrayQualityMetrics is a free and open source package, under LGPL license, available from the Bioconductor project at www.bioconductor.org.”
Self-citationaffy—analysis of Affymetrix GeneChip data at the probe level
Gautier, L., Cope, L., Bolstad, B. M., & Irizarry, R. A. (2004) · Bioinformatics · doi:10.1093/bioinformatics/btg405 · Cited by 5,218 · cited 2×
“The RNA degradation plot from the affy package (Gautier et al., 2004), the relative log expression (RLE) boxplots and the normalized unscaled standard error (NUSE) boxplots from the affyPLM package (Brettschneider et al., 2007) and the QC stat plot from the simpleaffy package (Wilson and Miller,…”
Dudoit, S., Yang, J. Y. H., Callow, M. J., & Speed, T. P. (2002) · UC Berkeley · Cited by 1,576
beadarray: R classes and methods for Illumina bead-based data
Dunning, M. J., Smith, M. L., Ritchie, M. E., & Tavaré, S. (2007) · Bioinformatics · doi:10.1093/bioinformatics/btm311 · Cited by 469
Simpleaffy: a BioConductor package for Affymetrix Quality Control and data analysis
Wilson, C. L., & Miller, C. J. (2005) · Bioinformatics · doi:10.1093/bioinformatics/bti605 · Cited by 445 · cited 2×
“In the case of one colour arrays, the M-value is computed by dividing the intensity by the median intensity of the same probe across all arrays.”
Normalization strategies for cDNA microarrays
Schuchhardt, J. (2000) · Nucleic Acids Research · doi:10.1093/nar/28.10.e47 · Cited by 331 · cited 1×
“Summary: The assessment of data quality is a major concern in microarray analysis. arrayQualityMetrics is a Bioconductor package that provides a report with diagnostic plots for one or two colour microarray data.”
Donuts, scratches and blanks: robust model-based segmentation of microarray images
Li, Q., Fraley, C., Bumgarner, R. E., Yeung, K. Y., & Raftery, A. E. (2005) · Computer applications in the biosciences · doi:10.1093/bioinformatics/bti447 · Cited by 127
arrayMagic: two-colour cDNA microarray quality control and preprocessing
Buneß, A., Huber, W. K., Steiner, K., Sültmann, H., & Poustka, A. (2004) · Bioinformatics · doi:10.1093/bioinformatics/bti052 · Cited by 55 · cited 2×
“, 2007), two-colour cDNA arrays (Buness et al., 2005).”
Self-citationMDQC: a new quality assessment method for microarrays based on quality control reports
Freue, G. V. C., Hollander, Z., Shen, E., Zamar, R. H., Balshaw, R. F., Scherer, A., McManus, B. M., Keown, P. A., McMaster, W. R., & Ng, R. T. (2007) · Bioinformatics · doi:10.1093/bioinformatics/btm487 · Cited by 42 · cited 2×
“Some tools perform outlier detection from quality metrics done before (Freue et al., 2007), or propose interactive quality plots (Lee et al.”
Array-A-Lizer: A serial DNA microarray quality analyzer
Petri, A., Fleckner, J., & Matthiessen, M. W. (2004) · BMC Bioinformatics · doi:10.1186/1471-2105-5-12 · Cited by 12
arrayQCplot: software for checking the quality of microarray data
Lee, E., Yi, S.-G., & Park, T. (2006) · Bioinformatics · doi:10.1093/bioinformatics/btl367 · Cited by 10
Quality assessment for short oligonucleotide microarray dataPreprint
Brettschneider, J. A., Collin, F., Bolstad, B. M., & Speed, T. P. (2007) · arXiv (Cornell University) · doi:10.48550/arxiv.0710.0178 · Cited by 3
Research works printed but not linked: 2
- Brettschneider, 2007, Quality assessment for short oligonucleotide arrays
- Parman, 2005, affyQCReport: QC Report Generation for affyBatch objects.
Cited by
The consensus molecular subtypes of colorectal cancer
Guinney, J., Dienstmann, R., Wang, X., de Reyniès, A., Schlicker, A., Soneson, C., Marisa, L., Roepman, P., Nyamundanda, G., Angelino, P., et al. (2015) · Nature Medicine · doi:10.1038/nm.3967 · Cited by 5,170
“From all clustering results, we calculated a 27 × 27 consensus matrix, defined by the frequency that each pair of subtypes is partitioned into the same cluster.”
Intertumoral Heterogeneity within Medulloblastoma Subgroups
Cavalli, F. M. G., Remke, M., Rampasek, L., Peacock, J., Shih, D. J. H., Luu, B., Garzia, L., Torchia, J., Nor, C., Morrissy, A. S., et al. (2017) · Cancer Cell · doi:10.1016/j.ccell.2017.05.005 · Cited by 1,219
“22.0) Kauffmann et al., 2009 https://www.bioconductor.org/packages/ release/bioc/html/arrayQualityMetrics.html minfi R Bioconductor package (v1.”
InfluentialBock, C., Kiskinis, E., Verstappen, G., Gu, H., Boulting, G., Smith, Z. D., Ziller, M., Croft, G. F., Amoroso, M. W., Oakley, D. H., et al. (2011) · Cell · doi:10.1016/j.cell.2010.12.032 · Cited by 1,009
“, 2004) and quality-controlled using arrayQualityMetrics (Kauffmann et al., 2009).”
T-cell exhaustion, co-stimulation and clinical outcome in autoimmunity and infection
McKinney, E. F., Lee, J. C., Jayne, D. R. W., Lyons, P. A., & Smith, K. G. C. (2015) · Nature · doi:10.1038/nature14468 · Cited by 685
Broad defects in the energy metabolism of leukocytes underlie immunoparalysis in sepsis
Cheng, S.-C., Scicluna, B. P., Arts, R. J. W., Gresnigt, M. S., Lachmandas, E., Giamarellos-Bourboulis, E. J., Kox, M., Manjeri, G. R., Wagenaars, J. A. L., Cremer, O. L., et al. (2016) · Nature Immunology · doi:10.1038/ni.3398 · Cited by 637
Metadata
- Authors
- Kauffmann, A., Gentleman, R., & Huber, W.
- Affiliations
- European Bioinformatics Institute (GB)
- Corresponding author
- Kauffmann, Audrey
- Venue
- Bioinformatics
- Publisher
- Oxford University Press (OUP)
- Published
- 2008-12-23
- Volume
- 25
- Issue
- 3
- Pages
- 415-416
- ISSN
- 1367-4803 (ISSN-L)
- 1367-4811
- PMC
- PMC2639074
- OpenAlex
- W2159096710
- Cited by
- 946
- References
- 11
- Citations by year
- 2026: 25 · 2025: 43 · 2024: 37 · 2023: 53 · 2022: 50 · 2021: 80 · 2020: 82 · 2019: 72 · 2018: 69 · 2017: 74 · 2016: 75 · 2015: 63 · 2014: 69 · 2013: 50 · 2012: 47
- FWCI
- 7.81
- Type
- journal article
- Language
- en
- Open access
- hybrid
- doi.org
- Licence
- Locations
- Bioinformatics (publishedVersion, cc-by-nc)
- PubMed Central (publishedVersion, cc-by-nc)
- PubMed (publishedVersion)
- Funders
- National Computational Infrastructure
- Australian Government
- Cancer Australia
- South Australian Research and Development Institute
- National Human Genome Research Institute (P41HG004059)
- Topics
- Life Sciences › Biochemistry, Genetics and Molecular Biology › Molecular Biology › Gene expression and cancer classification
- Life Sciences › Biochemistry, Genetics and Molecular Biology › Molecular Biology › Genomics and Phylogenetic Studies
- Life Sciences › Biochemistry, Genetics and Molecular Biology › Molecular Biology › Bioinformatics and Genomic Networks
- Keywords
- Bioconductor package, two-color microarrays, signal-to-noise ratio, reproducibility, automated reporting, diagnostic plots
- MeSH terms
- Algorithms, Data Interpretation, Statistical, Quality Control, Software, Computational Biology, Internet, Oligonucleotide Array Sequence Analysis
About these checks
Registry, retraction, Cites and statistics results are computed, not judged, with one exception: a printed reference that no index lists is read once by a model before it counts as a citation error. Claims are extracted by a model and kept only when their quote appears verbatim in the text; each cited source is then checked, with a model’s help, for whether it says what the claim relies on. Those verdicts can be wrong — read the claim’s quote and the cited source before relying on one.
Statistics and arithmetic are recomputed, not judged.
Confidence bands are shown only for fields calibrated on our annotated test set. None is calibrated yet, so no band is shown.
What counts as a claim ›How we measure confidence ›How we check this ›
Are you an author, or do you see a problem with this page? Request a review
Data sources
Bibliographic data: Semantic Scholar, OpenAlex, Crossref.
Contains information from the Semantic Scholar Academic Graph Datasets, made available under the ODC Attribution License (ODC-BY 1.0).
Semantic Scholar’s data is described in: Kinney, R., et al. (2023). The Semantic Scholar Open Data Platform. arXiv:2301.10140.
