

arrayQualityMetrics—a bioconductor package for quality assessment of microarray data
Open accessThe DOI matches its Crossref record; 12 of the 12 references it cites were found in a registry or an index.
Abstract
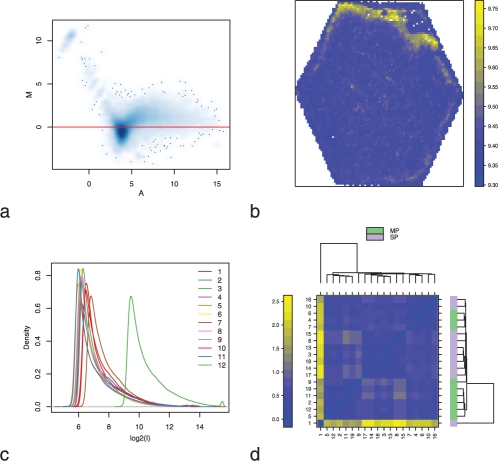
Summary:: The assessment of data quality is a major concern in microarray analysis. arrayQualityMetrics is a Bioconductor package that provides a report with diagnostic plots for one or two colour microarray data. The quality metrics assess reproducibility, identify apparent outlier arrays and compute measures of signal-to-noise ratio. The tool handles most current microarray technologies and is amenable to use in automated analysis pipelines or for automatic report generation, as well as for use by individuals. The diagnosis of quality remains, in principle, a context-dependent judgement, but our tool provides powerful, automated, objective and comprehensive instruments on which to base a decision. Availability:: arrayQualityMetrics is a free and open source package, under LGPL license, available from the Bioconductor project at www.bioconductor.org. A users guide and examples are provided with the package. Some examples of HTML reports generated by arrayQualityMetrics can be found at http://www.microarray-quality.org Contact:: audrey@ebi.ac.uk Supplementary information:: Supplementary data are available at Bioinformatics online.
Overview
The claims and statistics of this paper haven’t been checked yet.
Free: it reads the open-access text and checks the first 5 claims that cite a source we can check. Create a free account to check every claim.
Integrity signals
Registry
Cites
Statistics
Figures
Verification
Claims the paper makes
The claims and statistics of this paper haven’t been checked yet.
Free: it reads the open-access text and checks the first 5 claims that cite a source we can check. Create a free account to check every claim.
Claims other papers make about this one
Each is checked against this paper’s own text: does it say what the citing paper says it does?
In the citing paper
“Three RNA deep sequencing quality control measurements were performed to detect outliers and batch effects associated with the dataset: (a) L 1 distance between samples, (b) PCAs, and (c) similarity of density estimates of abundance values (53).”
From Development of an in vitro human liver system for interrogating nonalcoholic steatohepatitis (2016) · cites this paper as [53]
Self-check
Percentages, sums and reported differences re-computed from the paper’s own numbers.
The self-check needs the paper’s full text.
Citations
Cites
Bioconductor: open software development for computational biology and bioinformatics
Gentleman, R. C., Carey, V. J., Bates, D. M., Bolstad, B., Dettling, M., Dudoit, S., Ellis, B., Gautier, L., Ge, Y., Gentry, J., et al. (2004) · Genome Biology · doi:10.1186/gb-2004-5-10-r80 · Cited by 12,172 · cited 1×
“Availability: arrayQualityMetrics is a free and open source package, under LGPL license, available from the Bioconductor project at www.bioconductor.org.”
Self-citationaffy—analysis of Affymetrix GeneChip data at the probe level
Gautier, L., Cope, L., Bolstad, B. M., & Irizarry, R. A. (2004) · Bioinformatics · doi:10.1093/bioinformatics/btg405 · Cited by 5,218 · cited 2×
“The RNA degradation plot from the affy package (Gautier et al., 2004), the relative log expression (RLE) boxplots and the normalized unscaled standard error (NUSE) boxplots from the affyPLM package (Brettschneider et al., 2007) and the QC stat plot from the simpleaffy package (Wilson and Miller,…”
Dudoit, S., Yang, J. Y. H., Callow, M. J., & Speed, T. P. (2002) · UC Berkeley · Cited by 1,576
beadarray: R classes and methods for Illumina bead-based data
Dunning, M. J., Smith, M. L., Ritchie, M. E., & Tavaré, S. (2007) · Bioinformatics · doi:10.1093/bioinformatics/btm311 · Cited by 469
Simpleaffy: a BioConductor package for Affymetrix Quality Control and data analysis
Wilson, C. L., & Miller, C. J. (2005) · Bioinformatics · doi:10.1093/bioinformatics/bti605 · Cited by 445 · cited 2×
“In the case of one colour arrays, the M-value is computed by dividing the intensity by the median intensity of the same probe across all arrays.”
Normalization strategies for cDNA microarrays
Schuchhardt, J. (2000) · Nucleic Acids Research · doi:10.1093/nar/28.10.e47 · Cited by 331 · cited 1×
“Summary: The assessment of data quality is a major concern in microarray analysis. arrayQualityMetrics is a Bioconductor package that provides a report with diagnostic plots for one or two colour microarray data.”
Donuts, scratches and blanks: robust model-based segmentation of microarray images
Li, Q., Fraley, C., Bumgarner, R. E., Yeung, K. Y., & Raftery, A. E. (2005) · Computer applications in the biosciences · doi:10.1093/bioinformatics/bti447 · Cited by 127
arrayMagic: two-colour cDNA microarray quality control and preprocessing
Buneß, A., Huber, W. K., Steiner, K., Sültmann, H., & Poustka, A. (2004) · Bioinformatics · doi:10.1093/bioinformatics/bti052 · Cited by 55 · cited 2×
“, 2007), two-colour cDNA arrays (Buness et al., 2005).”
Self-citationMDQC: a new quality assessment method for microarrays based on quality control reports
Freue, G. V. C., Hollander, Z., Shen, E., Zamar, R. H., Balshaw, R. F., Scherer, A., McManus, B. M., Keown, P. A., McMaster, W. R., & Ng, R. T. (2007) · Bioinformatics · doi:10.1093/bioinformatics/btm487 · Cited by 42 · cited 2×
“Some tools perform outlier detection from quality metrics done before (Freue et al., 2007), or propose interactive quality plots (Lee et al.”
Array-A-Lizer: A serial DNA microarray quality analyzer
Petri, A., Fleckner, J., & Matthiessen, M. W. (2004) · BMC Bioinformatics · doi:10.1186/1471-2105-5-12 · Cited by 12
Research works printed but not linked: 2
- Brettschneider, 2007, Quality assessment for short oligonucleotide arrays
- Parman, 2005, affyQCReport: QC Report Generation for affyBatch objects.
Cited by
The consensus molecular subtypes of colorectal cancer
Guinney, J., Dienstmann, R., Wang, X., de Reyniès, A., Schlicker, A., Soneson, C., Marisa, L., Roepman, P., Nyamundanda, G., Angelino, P., et al. (2015) · Nature Medicine · doi:10.1038/nm.3967 · Cited by 5,170
“From all clustering results, we calculated a 27 × 27 consensus matrix, defined by the frequency that each pair of subtypes is partitioned into the same cluster.”
Intertumoral Heterogeneity within Medulloblastoma Subgroups
Cavalli, F. M. G., Remke, M., Rampasek, L., Peacock, J., Shih, D. J. H., Luu, B., Garzia, L., Torchia, J., Nor, C., Morrissy, A. S., et al. (2017) · Cancer Cell · doi:10.1016/j.ccell.2017.05.005 · Cited by 1,219
“22.0) Kauffmann et al., 2009 https://www.bioconductor.org/packages/ release/bioc/html/arrayQualityMetrics.html minfi R Bioconductor package (v1.”
InfluentialBock, C., Kiskinis, E., Verstappen, G., Gu, H., Boulting, G., Smith, Z. D., Ziller, M., Croft, G. F., Amoroso, M. W., Oakley, D. H., et al. (2011) · Cell · doi:10.1016/j.cell.2010.12.032 · Cited by 1,009
“, 2004) and quality-controlled using arrayQualityMetrics (Kauffmann et al., 2009).”
T-cell exhaustion, co-stimulation and clinical outcome in autoimmunity and infection
McKinney, E. F., Lee, J. C., Jayne, D. R. W., Lyons, P. A., & Smith, K. G. C. (2015) · Nature · doi:10.1038/nature14468 · Cited by 685
Broad defects in the energy metabolism of leukocytes underlie immunoparalysis in sepsis
Cheng, S.-C., Scicluna, B. P., Arts, R. J. W., Gresnigt, M. S., Lachmandas, E., Giamarellos-Bourboulis, E. J., Kox, M., Manjeri, G. R., Wagenaars, J. A. L., Cremer, O. L., et al. (2016) · Nature Immunology · doi:10.1038/ni.3398 · Cited by 637
Visualization of omics data for systems biology
Gehlenborg, N., O'Donoghue, S. I., Baliga, N. S., Goesmann, A., Hibbs, M. A., Kitano, H., Kohlbacher, O., Neuweger, H., Schneider, R., Tenenbaum, D., et al. (2010) · Nature Methods · doi:10.1038/nmeth.1436 · Cited by 620
Paris, J., Morgan, M., Campos, J., Spencer, G. J., Shmakova, A., Ivanova, I., Mapperley, C., Lawson, H., Wotherspoon, D. A., Sepulveda, C., et al. (2019) · Cell Stem Cell · doi:10.1016/j.stem.2019.03.021 · Cited by 502
Buddingh, E. P., Kuijjer, M. L., Duim, R. A. J., Bürger, H., Agelopoulos, K., Myklebost, O., Serra, M., Mertens, F., Hogendoorn, P. C. W., Lankester, A. C., et al. (2011) · Clinical Cancer Research · doi:10.1158/1078-0432.ccr-10-2047 · Cited by 508
“Quality control was performed using Bioconductor package arrayQualityMetrics (28).”
MethodConvergent transcriptional specializations in the brains of humans and song-learning birds
Pfenning, A. R., Hara, E., Whitney, O., Rivas, M. V., Wang, R., Roulhac, P. L., Howard, J. T., Wirthlin, M., Lovell, P. V., Ganapathy, G., et al. (2014) · Science · doi:10.1126/science.1256846 · Cited by 463
Necroptosis activation in Alzheimer's disease
Caccamo, A., Branca, C., Piras, I. S., Ferreira, E., Huentelman, M. J., Liang, W. S., Readhead, B., Dudley, J. T., Spangenberg, E. E., Green, K. N., et al. (2017) · Nature Neuroscience · doi:10.1038/nn.4608 · Cited by 482
Aryl hydrocarbon receptor Controls Monocyte Differentiation into dendritic Cells versus Macrophages
Goudot, C., Coillard, A., Villani, A.-C., Gueguen, P., Cros, A., Sarkizova, S., Tang-Huau, T.-L., Bohec, M., Baulande, S., Hacohen, N., et al. (2017) · Immunity · doi:10.1016/j.immuni.2017.08.016 · Cited by 382
“fr/projects/e ma/ ArrayQualityMetrics package (Kauffmann et al., 2009) https://bioconductor.”
MethodReuse of public genome-wide gene expression data
Rung, J., & Brazma, A. (2013) · Nature Reviews Genetics · doi:10.1038/nrg3394 · Cited by 375
“This can be done by the Bioconductor ArrayQualityMetrics package 102 , for example.”
MethodHematopoietic Stem Cell Arrival Triggers Dynamic Remodeling of the Perivascular Niche
Tamplin, O. J., Durand, E. M., Carr, L. A., Childs, S. J., Hagedorn, E. J., Li, P., Yzaguirre, A. D., Speck, N. A., & Zon, L. I. (2015) · Cell · doi:10.1016/j.cell.2014.12.032 · Cited by 341
Lee, J. C., Lyons, P. A., McKinney, E. F., Sowerby, J. M., Carr, E. J., Bredin, F., Rickman, H. M., Ratlamwala, H., Hatton, A., Rayner, T. F., et al. (2011) · Journal of Clinical Investigation · doi:10.1172/jci59255 · Cited by 304
Molecular classification and therapeutic targets in extrahepatic cholangiocarcinoma
Montal, R., Sia, D., Montironi, C., Leow, W. Q., Esteban-Fabró, R., Pinyol, R., Torres-Martin, M., Bassaganyas, L., Moeini, A., Peix, J., et al. (2020) · Journal of Hepatology · doi:10.1016/j.jhep.2020.03.008 · Cited by 301
“ArrayQualityMetrics package[16] was utilized to assess reproducibility, identify apparent outlier arrays and compute measures of signal-to-noise ratio.”
MethodOhnishi, Y., Huber, W., Tsumura, A., Kang, M., Xenopoulos, P., Kurimoto, K., Oleś, A. K., Araúzo-Bravo, M. J., Saitou, M., Hadjantonakis, A.-K., et al. (2014) · Nature Cell Biology · doi:10.1038/ncb2881 · Cited by 300
Self-citationGene expression associated with white syndromes in a reef building coral, Acropora hyacinthus
Wright, R. M., Aglyamova, G. V., Meyer, E., & Matz, M. V. (2015) · BMC Genomics · doi:10.1186/s12864-015-1540-2 · Cited by 298
“No outlying samples were detected by the arrayQualityMetrics package [77].”
MethodRituximab Efficiently Depletes Increased CD20-Expressing T Cells in Multiple Sclerosis Patients
Palanichamy, A., Jahn, S., Nickles, D., Derstine, M., Abounasr, A., Hauser, S. L., Baranzini, S. E., Leppert, D., & von Büdingen, H.-C. (2014) · The Journal of Immunology · doi:10.4049/jimmunol.1400118 · Cited by 289
“Quality of the analyzed arrays was ascertained using the arrayQualityMetrics package (10).”
MethodPalmer, R. D., Murray, M. J., Saini, H. K., van Dongen, S., Abreu-Goodger, C., Muralidhar, B., Pett, M. R., Thornton, C. M., Nicholson, J. C., Enright, A. J., et al. (2010) · Cancer Research · doi:10.1158/0008-5472.can-09-3301 · Cited by 286
The single-cell epigenomic and transcriptional landscape of immunity to influenza vaccination
Wimmers, F., Donato, M., Kuo, A., Ashuach, T., Gupta, S., Li, C., Dvorak, M., Foecke, M. H., Chang, S. E., Hagan, T., et al. (2021) · Cell · doi:10.1016/j.cell.2021.05.039 · Cited by 276
“Quality control analysis of ATAC-seq data was performed using Rockefeller University workshop on analysis of ATAC-seq data in R and Bioconductor (https://rockefelleruniversity.github.io/RU_ATAC_Workshop.html).”
MethodInfluentialGordon, L., Joo, J. E., Powell, J. E., Ollikainen, M., Novakovic, B., Li, X., Andronikos, R., Cruickshank, M. N., Conneely, K. N., Smith, A. K., et al. (2012) · Genome Research · doi:10.1101/gr.136598.111 · Cited by 272
“Data quality was confirmed using arrayQualityMetrics (Kauffmann et al. 2009).”
Different TCR-induced T lymphocyte responses are potentiated by stiffness with variable sensitivity
Saitakis, M., Dogniaux, S., Goudot, C., Bufi, N., Asnacios, S., Maurin, M., Randriamampita, C., Asnacios, A., & Hivroz, C. (2017) · eLife · doi:10.7554/elife.23190 · Cited by 257
“CEL files with raw data were used and the quality control analysis was performed using ArrayQualityMetrics package (Kauffmann et al., 2009).”
MethodReynolds, N., Salmon-Divon, M., Dvinge, H., Hynes-Allen, A., Balasooriya, G., Leaford, D., Behrens, A., Bertone, P., & Hendrich, B. (2012) · The EMBO Journal · doi:10.1038/emboj.2011.431 · Cited by 257
Grinchuk, O. V., Yenamandra, S. P., Iyer, R., Singh, M., Lee, H. K., Lim, K. H., Chow, P. K., & Kuznetsov, V. A. (2018) · Molecular Oncology · doi:10.1002/1878-0261.12153 · Cited by 236
“, 2012) that passed the same microarray quality assessment (Kauffmann et al., 2009).”
BackgroundMethodThe epigenetic control of stemness in CD8 + T cell fate commitment
Pace, L., Goudot, C., Zueva, E., Gueguen, P., Burgdorf, N., Waterfall, J. J., Quivy, J.-P., Almouzni, G., & Amigorena, S. (2018) · Science · doi:10.1126/science.aah6499 · Cited by 236
Immune Cell Gene Signatures for Profiling the Microenvironment of Solid Tumors
Nirmal, A. J., Regan, T., Shih, B. B., Hume, D. A., Sims, A. H., & Freeman, T. C. (2018) · Cancer Immunology Research · doi:10.1158/2326-6066.cir-18-0342 · Cited by 218
Poblete-Castro, I., Binger, D., Rodrigues, A., Becker, J., Martins dos Santos, V. A. P., & Wittmann, C. (2013) · Metabolic Engineering · doi:10.1016/j.ymben.2012.10.004 · Cited by 192
A blood-based prognostic biomarker in IBD
Biasci, D., Lee, J. C., Noor, N. M., Pombal, D. R., Hou, M., Lewis, N., Ahmad, T., Hart, A., Parkes, M., McKinney, E. F., et al. (2019) · Gut · doi:10.1136/gutjnl-2019-318343 · Cited by 190
Buckberry, S., Bianco-Miotto, T., Bent, S. J., Dekker, G. A., & Roberts, C. T. (2014) · Molecular Human Reproduction · doi:10.1093/molehr/gau035 · Cited by 186
“Outliers were eliminated from each dataset (see Supplementary data, Table SII) before renormalization by checking the distance between arrays and assessing MA plots generated using ArrayQualityMetrics (Kauffmann et al., 2009).”
MethodLanda, I., Pozdeyev, N., Korch, C., Marlow, L. A., Smallridge, R. C., Copland, J. A., Henderson, Y. C., Lai, S. Y., Clayman, G. L., Onoda, N., et al. (2019) · Clinical Cancer Research · doi:10.1158/1078-0432.ccr-18-2953 · Cited by 187
“Nthy-ori-3-1 cells, derived from normal human thyroid follicular cells (22), harbored missense variants in KMT2A, POLE, and CHEK2, all of which have unspecified functional effects.”
BackgroundMethodPiper, C. J. M., Rosser, E. C., Oleinika, K., Nistala, K., Krausgruber, T., Rendeiro, A. F., Banos, A., Drozdov, I., Villa, M., Thomson, S., et al. (2019) · Cell Reports · doi:10.1016/j.celrep.2019.10.018 · Cited by 185
Cookson, S. J., Clemente Moreno, M. J., Hevin, C., Nyamba Mendome, L. Z., Delrot, S., Trossat-Magnin, C., & Ollat, N. (2013) · Journal of Experimental Botany · doi:10.1093/jxb/ert144 · Cited by 183
“Microarray quality controls were performed using the arrayQualityMetrics package (Kauffmann et al., 2009).”
MethodKararigas, G., Dworatzek, E., Petrov, G., Summer, H., Schulze, T. M., Baczko, I., Knosalla, C., Golz, S., Hetzer, R., & Regitz-Zagrosek, V. (2014) · European Journal of Heart Failure · doi:10.1002/ejhf.171 · Cited by 180
Wang, Y., Wang, X., Tang, H., Tan, X., Ficklin, S. P., Feltus, F. A., & Paterson, A. H. (2011) · PLoS ONE · doi:10.1371/journal.pone.0028150 · Cited by 177
“Outliers were detected using the arrayQualityMetrics [83] Bioconductor package, which implements three different statistical tests to identify outliers.”
MethodKhan, M. A.-A.-K., Sany, M. R. U., Islam, M. S., & Islam, A. B. M. M. K. (2020) · Frontiers in Genetics · doi:10.3389/fgene.2020.00765 · Cited by 177
“The quality of microarray experiment (data not shown) was verified by Bioconductor package “arrayQualityMetrics” (Kauffmann et al., 2009) (version 3.”
MethodA Transcriptional Signature of Fatigue Derived from Patients with Primary Sjögren’s Syndrome
James, K., Al-Ali, S., Tarn, J., Cockell, S. J., Gillespie, C. S., Hindmarsh, V., Locke, J., Mitchell, S., Lendrem, D., Bowman, S., et al. (2015) · PLOS ONE · doi:10.1371/journal.pone.0143970 · Cited by 177
“The arrayQualityMetrics package was used to detect outliers [77].”
MethodNotch signal strength controls cell fate in the haemogenic endothelium
Gama-Norton, L., Ferrando, E., Ruiz-Herguido, C., Liu, Z., Guiu, J., Islam, A. B. M. M. K., Lee, S.-U., Yan, M., Guidos, C. J., López-Bigas, N., et al. (2015) · Nature Communications · doi:10.1038/ncomms9510 · Cited by 171
The Rice Oligonucleotide Array Database: an atlas of rice gene expression
Cao, P., Jung, K.-H., Choi, D., Hwang, D., Zhu, J., & Ronald, P. C. (2012) · Rice · doi:10.1186/1939-8433-5-17 · Cited by 170
“After MAS normalization of all Affymetrix microarray samples, outliers were detected using the arrayQualityMe-tricsBioconductor package, which uses three different statistical tests to identify outliers (Gentleman et al. 2004; Kauffmann et al. 2009).”
MethodTranscriptome analysis reveals upregulation of bitter taste receptors in severe asthmatics
Orsmark-Pietras, C., James, A., Konradsen, J. R., Nordlund, B., Söderhäll, C., Pulkkinen, V., Pedroletti, C., Daham, K., Kupczyk, M., Dahlén, B., et al. (2013) · European Respiratory Journal · doi:10.1183/09031936.00077712 · Cited by 168
Effects of Systemically Administered Hydrocortisone on the Human Immunome
Olnes, M. J., Kotliarov, Y., Biancotto, A., Cheung, F., Chen, J., Shi, R., Zhou, H., Wang, E., Tsang, J. S., Nussenblatt, R., et al. (2016) · Scientific Reports · doi:10.1038/srep23002 · Cited by 168
Cordell, H. J., Bentham, J., Topf, A., Zelenika, D., Heath, S., Mamasoula, C., Cosgrove, C., Blue, G., Granados-Riveron, J., Setchfield, K., et al. (2013) · Nature Genetics · doi:10.1038/ng.2637 · Cited by 164
Jakovcevski, M., Ruan, H., Shen, E. Y., Dincer, A., Javidfar, B., Ma, Q., Peter, C. J., Cheung, I., Mitchell, A. C., Jiang, Y., et al. (2015) · The Journal of Neuroscience · doi:10.1523/jneurosci.3004-14.2015 · Cited by 161
A gene expression atlas of the domestic pig
Freeman, T. C., Ivens, A., Baillie, J. K., Beraldi, D., Barnett, M. W., Dorward, D., Downing, A., Fairbairn, L., Kapetanovic, R., Raza, S., et al. (2012) · BMC Biology · doi:10.1186/1741-7007-10-90 · Cited by 159
“org/) and scored on the basis of five metrics, namely maplot, spatial, boxplot, heatmap and rle in order to identify poor quality data [63].”
BackgroundShaik, R., & Ramakrishna, W. (2013) · PLANT PHYSIOLOGY · doi:10.1104/pp.113.225862 · Cited by 158
“Brie fl y, the raw intensity CEL fi les of the selected samples were downloaded from the Gene Expression Omnibus, and intensity values were extracted from the CEL fi les using the bioconductor package Affy in R (Gautier et al., 2004), quality checked using the package ArrayQualityMetrics (Kauffmann et al., 2009), and the…”
MethodNakaya, H. I., Clutterbuck, E., Kazmin, D., Wang, L., Cortese, M., Bosinger, S. E., Patel, N. B., Zak, D. E., Aderem, A., Dong, T., et al. (2016) · Proceedings of the National Academy of Sciences · doi:10.1073/pnas.1519690113 · Cited by 159
Wozniak, M. B., Calvez‐Kelm, F. L., Abedi‐Ardekani, B., Byrnes, G. B., Durand, G., Carreira, C., Michelon, J., Janout, V., Holcátová, I., Foretová, L., et al. (2013) · PLoS ONE · doi:10.1371/journal.pone.0057886 · Cited by 171
“Supplemental quality assessment (before and after normalization) was conducted using arrayQualityMetrics package [57] and reached similar conclusions.”
MethodDai, Z., Meddar, M., Renaud, C., Merlin, I., Hilbert, G., Delrot, S., & Gomès, É. (2013) · Journal of Experimental Botany · doi:10.1093/jxb/ert489 · Cited by 174
“After quality control with the ArrayQualityMetrics package (Kauffmann et al., 2009), expression intensities were normalized with RMA function with the oligo package (Carvalho and Irizarry, 2010).”
Scl Represses Cardiomyogenesis in Prospective Hemogenic Endothelium and Endocardium
Van Handel, B., Montel-Hagen, A., Sasidharan, R., Nakano, H., Ferrari, R., Boogerd, C. J., Schredelseker, J., Wang, Y., Hunter, S., Org, T., et al. (2012) · Cell · doi:10.1016/j.cell.2012.06.026 · Cited by 154
Development of an in vitro human liver system for interrogating nonalcoholic steatohepatitis
Feaver, R. E., Cole, B. K., Lawson, M. J., Hoang, S. A., Marukian, S., Blackman, B. R., Figler, R. A., Sanyal, A. J., Wamhoff, B. R., & Dash, A. (2016) · JCI Insight · doi:10.1172/jci.insight.90954 · Cited by 153
“Three RNA deep sequencing quality control measurements were performed to detect outliers and batch effects associated with the dataset: (a) L1 distance between samples, (b) PCAs, and (c) similarity of density estimates of abundance values (53).”
MethodLecourieux, F., Kappel, C., Pieri, P., Charon, J., Pillet, J., Hilbert, G., Renaud, C., Gomès, É., Delrot, S., & Lecourieux, D. (2017) · Frontiers in Plant Science · doi:10.3389/fpls.2017.00053 · Cited by 177
“Quality control was done using the arrayQualityMetrics package (Kauffmann et al., 2009), one identified outlier (GHS14_1) was excluded from further analyses.”
MethodRas-Mediated Deregulation of the Circadian Clock in Cancer
Relógio, A., Thomas, P. E., Medina-Pérez, P., Reischl, S., Bervoets, S., Gloc, E., Riemer, P., Mang‐Fatehi, S., Maier, B., Schäfer, R., et al. (2014) · PLoS Genetics · doi:10.1371/journal.pgen.1004338 · Cited by 157
“Quality of all arrays was determined using array QualityMetrics [92].”
MethodZhurov, V. V., Navarro, M., Bruinsma, K. A., Arbona, V., Santamaria, M. E., Cazaux, M., Wybouw, N., Osborne, E. J., Ens, C., Rioja, C., et al. (2013) · PLANT PHYSIOLOGY · doi:10.1104/pp.113.231555 · Cited by 176
“Owing in part to its unprecedented genetic and genomic toolkits (Koornneef and Meinke, 2010), the response of Arabidopsis to herbivory by insects in several feeding guilds has already been investigated (Reymond et al., 2004; De Vos et al., 2005; Kempema et al., 2007).”
Gene Coexpression Network Analysis as a Source of Functional Annotation for Rice Genes
Childs, K. L., Davidson, R. M., & Buell, C. R. (2011) · PLoS ONE · doi:10.1371/journal.pone.0022196 · Cited by 147
“Quality tests were performed on the normalized array data using the Bioconductor arrayQualityMetrics package [61,62], and by examining chip trees generated by the R WGCNA package [36].”
MethodWybouw, N., Zhurov, V. V., Martel, C., Bruinsma, K. A., Hendrickx, F., Grbić, V., & Leeuwen, T. V. (2015) · Molecular Ecology · doi:10.1111/mec.13330 · Cited by 170
Ficklin, S. P., & Feltus, F. A. (2011) · PLANT PHYSIOLOGY · doi:10.1104/pp.111.173047 · Cited by 143
“Vol. 156, 2011 1245 40 outlier arrays were removed using the R/arrayQualityMetrics package (Kauffmann et al., 2009).”
MethodMayne, B. T., Bianco-Miotto, T., Buckberry, S., Breen, J., Clifton, V., Shoubridge, C., & Roberts, C. T. (2016) · Frontiers in Genetics · doi:10.3389/fgene.2016.00183 · Cited by 140
“Sex differences have also been identified in the age of onset of brain diseases such as schizophrenia, where males develop symptoms between 18 and 25 years of age whereas females develop symptoms between 25 and 35 years (Ochoa et al., 2012).”
BackgroundMethodIdentification of a human neonatal immune-metabolic network associated with bacterial infection
Smith, C., Dickinson, P., Forster, T., Craigon, M., Ross, A., Khondoker, M. R., France, R., Ivens, A. C., Lynn, D. J., Orme, J., et al. (2014) · Nature Communications · doi:10.1038/ncomms5649 · Cited by 159
Genome-wide analysis of mRNA decay patterns during early Drosophiladevelopment
Thomsen, S., Anders, S., Janga, S. C., Huber, W. K., & Alonso, C. R. (2010) · Genome biology · doi:10.1186/gb-2010-11-9-r93 · Cited by 154
Self-citationPoblete‐Castro, I., Escapa, I. F., Jäger, C., Puchałka, J., Lam, C.-C., Schomburg, D., Prieto, M., & dos Santos, V. A. P. M. (2012) · Microbial Cell Factories · doi:10.1186/1475-2859-11-34 · Cited by 142
“The quality of the chips was analyzed with the ‘arrayQualityMetrics’ package [78].”
MethodSchokker, D., Veninga, G., Vastenhouw, S. A., Bossers, A., de Bree, F. M., Kaal-Lansbergen, L. M. T. E., Rebel, J. M. J., & Smits, M. A. (2015) · BMC Genomics · doi:10.1186/s12864-015-1646-6 · Cited by 149
“2) by executing different packages, including LIMMA [71] and arrayQualityMetrics [72].”
MethodUser-friendly solutions for microarray quality control and pre-processing on ArrayAnalysis.org
Eijssen, L., Jaillard, M., Adriaens, M. E., Gaj, S., de Groot, P. J., Müller, M. M., & Evelo, C. T. (2013) · Nucleic Acids Research · doi:10.1093/nar/gkt293 · Cited by 145
Shaik, R., & Ramakrishna, W. (2013) · PLoS ONE · doi:10.1371/journal.pone.0077261 · Cited by 132
“Identification of differentially expressed genes The raw intensity CEL files of the selected samples were downloaded from GEO and intensity values were extracted from the CEL files using the bioconductor package Affy in R [28], quality checked using the package, ArrayQualityMetrics [29] and the samples failing two or…”
MethodFeltes, B. C., Chandelier, E. B., Grisci, B. I., & Dorn, M. (2019) · Journal of Computational Biology · doi:10.1089/cmb.2018.0238 · Cited by 174
Li, X., Xu, Y., Cui, H. S., Huang, T., Wang, D., Lian, B., Li, W., Qin, G., Chen, L., & Xie, L. (2017) · Artificial Intelligence in Medicine · doi:10.1016/j.artmed.2017.05.008 · Cited by 141
A high-resolution gene expression map of the Arabidopsis shoot meristem stem cell niche
Yadav, R. K., Tavakkoli, M., Xie, M., Girke, T., & Reddy, G. V. (2014) · Development · doi:10.1242/dev.106104 · Cited by 139
“The quality of the Affymetrix GeneChips was assessed with analysis routines provided by the affyPLM and arrayQualityMetrics packages (Bolstad et al., 2005; Kauffmann et al., 2009).”
MethodLiguori, M., Digifico, E., Vacchini, A., Avigni, R., Colombo, F., Borroni, E. M., Farina, F. M., Milanesi, S., Castagna, A., Mannarino, L., et al. (2020) · Cellular and Molecular Immunology · doi:10.1038/s41423-020-0501-0 · Cited by 128
A chemical toolbox for the study of bromodomains and epigenetic signaling
Wu, Q., Heidenreich, D. J., Zhou, S., Ackloo, S. Z., Krämer, A., Nakka, K. K., Lima‐Fernandes, E., Deblois, G., Duan, S., Vellanki, R. N., et al. (2019) · Nature Communications · doi:10.1038/s41467-019-09672-2 · Cited by 130
Systems Immunology of Diabetes-Tuberculosis Comorbidity Reveals Signatures of Disease Complications
Prada‐Medina, C. A., Fukutani, K. F., Kumar, N. P., Gil-Santana, L., Babu, S., Lichtenstein, F., West, K., Sivakumar, S., Menon, P. A., Viswanathan, V., et al. (2017) · Scientific Reports · doi:10.1038/s41598-017-01767-4 · Cited by 134
The activity-dependent histone variant H2BE modulates the life span of olfactory neurons
Santoro, S. W., & Dulac, C. G. (2012) · eLife · doi:10.7554/elife.00070 · Cited by 132
“Probe cell intensity files (CEL) were analyzed for potential outliers using the Bioconductor software package arrayQualityMetrics (Kauffmann et al., 2009).”
MethodBerdeja, M., Nicolas, P., Kappel, C., Dai, Z., Hilbert, G., Peccoux, A., Lafontaine, M., Ollat, N., Gomès, É., & Delrot, S. (2015) · Horticulture Research · doi:10.1038/hortres.2015.12 · Cited by 119
Venus flytrap carnivorous lifestyle builds on herbivore defense strategiesPreprint
Bemm, F., Becker, D., Larisch, C., Kreuzer, I., Escalante‐Pérez, M., Schulze, W. X., Ankenbrand, M. J., de Weyer, A.-L. V., Krol, E., Al‐Rasheid, K. A. S., et al. (2016) · Genome Research · doi:10.1101/gr.202200.115 · Cited by 123
“0) (Kauffmann et al. 2009) and a variance stabilized transformation of the normalized gene count data set.”
BackgroundMethodInfluentialJonckheere, W., Dermauw, W., Zhurov, V., Wybouw, N., den Bulcke, J. V., Villarroel, C. A., Greenhalgh, R., Grbić, M., Schuurink, R., Tirry, L., et al. (2016) · Molecular & Cellular Proteomics · doi:10.1074/mcp.m116.058081 · Cited by 122
“The intraspot correlation coefficient per array and the metrics from the arrayQualityMetrics package per host plant line were assessed for optimal background correction and normalization procedures (78).”
MethodMiR-155 Has a Protective Role in the Development of Non-Alcoholic Hepatosteatosis in Mice
Miller, A. M., Gilchrist, D. S., Nijjar, J. S., Araldi, E., Ramírez, C. M., Lavery, C. A., Fernandez-Hernando, C. F., McInnes, I. B., & Kurowska‐Stolarska, M. (2013) · PLoS ONE · doi:10.1371/journal.pone.0072324 · Cited by 119
“Quality control was carried out using package arrayQualityMetrics [11] before and after RMA pre-processing using the Oligo package [12].”
MethodcAMP Response Element-Binding Protein Is a Primary Hub of Activity-Driven Neuronal Gene Expression
Benito, E., Valor, L. M., Jimenez-Minchan, M., Huber, W. K., & Barco, Á. (2011) · Journal of Neuroscience · doi:10.1523/jneurosci.4554-11.2011 · Cited by 132
“This computational method can effectively address comparability issues between different platforms and filtering criteria by making use of the information of the complete dataset (Ioannidis et al., 2009; Kauffmann et al., 2009).”
MethodSelf-citationThe KDM3A–KLF2–IRF4 axis maintains myeloma cell survival
Ohguchi, H., Hideshima, T., Bhasin, M., Görgün, G., Santo, L., Cea, M., Samur, M., Mimura, N., Suzuki, R., Tai, Y.-T., et al. (2016) · Nature Communications · doi:10.1038/ncomms10258 · Cited by 118
Kasela, S., Kisand, K., Tserel, L., Kaleviste, E., Remm, A., Fischer, K., Esko, T., Westra, H.-J., Fairfax, B. P., Makino, S., et al. (2017) · PLOS Genetics · doi:10.1371/journal.pgen.1006643 · Cited by 113
“Preprocessing and quality control of the data was done using R(4) and the Bioconductor packages lumi(5) and arrayQualityMetrics(6).”
MethodKoti, M., Gooding, R. J., Nuin, P. A. S., Haslehurst, A., Crane, C. A., Weberpals, J. I., Childs, T. J., Bryson, P., Dharsee, M., Evans, K. G., et al. (2013) · BMC Cancer · doi:10.1186/1471-2407-13-549 · Cited by 126
“Technical microarray quality control analysis was performed on the full set of CEL files using the arrayQualityMetrics Bioconductor package, based on the 12 samples from the resistant cohort, and 16 samples from the sensitive cohort [21].”
MethodAKT isoforms modulate Th1‐like Treg generation and function in human autoimmune disease
Kitz, A., de Marcken, M., Gautron, A.-S., Mitrovič, M., Hafler, D. A., & Dominguez‐Villar, M. (2016) · EMBO Reports · doi:10.15252/embr.201541905 · Cited by 116
“Quality control was performed using ArrayQualityMetrics [61], and arrays were preprocessed with RMA [62].”
MethodHenderson, S. W., Baumann, U., Blackmore, D. H., Walker, A. R., WALKER, R. R., & Gilliham, M. (2014) · BMC Plant Biology · doi:10.1186/s12870-014-0273-8 · Cited by 127
“0 [41].”
Ito, S., Bollard, C. M., Carlsten, M., Melenhorst, J. J., Biancotto, A., Wang, E., Chen, J., Kotliarov, Y., Cheung, F., Xie, Z., et al. (2014) · Molecular Therapy · doi:10.1038/mt.2014.50 · Cited by 117
Improved quality control processing of peptide-centric LC-MS proteomics data
Matzke, M. M., Waters, K. M., Metz, T. O., Jacobs, J. M., Sims, A. C., Baric, R. S., Pounds, J. G., & Webb-Robertson, B.-J. M. (2011) · Bioinformatics · doi:10.1093/bioinformatics/btr479 · Cited by 107
Schokker, D., Jansman, A. J. M., Veninga, G., Bruin, N. D., Vastenhouw, S. A., de Bree, F. M., Bossers, A., Rebel, J. M. J., & Smits, M. A. (2017) · BMC Genomics · doi:10.1186/s12864-017-3625-6 · Cited by 122
“2) by executing different packages, including linear models for microarray data (LIMMA) [26] and arrayQualityMetrics [27].”
MethodWright, R. M., Kenkel, C. D., Dunn, C. E., Shilling, E. N., Bay, L. K., & Matz, M. V. (2017) · Scientific Reports · doi:10.1038/s41598-017-02685-1 · Cited by 113
Picaud, S., Leonards, K., Lambert, J., Dovey, O. M., Wells, C. D., Fedorov, O., Monteiro, O., Fujisawa, T., Wang, C., Lingard, H., et al. (2016) · Science Advances · doi:10.1126/sciadv.1600760 · Cited by 121
Robust principal component analysis for accurate outlier sample detection in RNA-Seq data
Chen, X., Zhang, B., Wang, T., Bonni, A., & Zhao, G. (2020) · BMC Bioinformatics · doi:10.1186/s12859-020-03608-0 · Cited by 132
Bloom syndrome protein restrains innate immune sensing of micronuclei by cGAS
Gratia, M., Rodero, M. P., Conrad, C., Samra, E. B., Maurin, M., Rice, G., Duffy, D., Revy, P., Petit, F., Dale, R. C., et al. (2019) · The Journal of Experimental Medicine · doi:10.1084/jem.20181329 · Cited by 116
Cookson, S. J., & Ollat, N. (2013) · BMC Plant Biology · doi:10.1186/1471-2229-13-147 · Cited by 113
“Microarray quality controls were performed using the arrayQualityMetrics package [43].”
MethodFicklin, S. P., Luo, F., & Feltus, F. A. (2010) · PLANT PHYSIOLOGY · doi:10.1104/pp.110.159459 · Cited by 103
“Outliers were detected using the arrayQualityMetrics (Kauffmann et al., 2009) Bioconductor (Gentleman et al., 2004) package, which uses three different statistical tests to identify outliers.”
MethodPavlidi, N., Khalighi, M., Myridakis, A., Dermauw, W., Wybouw, N., Tsakireli, D., Stephanou, E. G., Labrou, N. E., VONTAS, J. G., & Leeuwen, T. V. (2016) · Insect Biochemistry and Molecular Biology · doi:10.1016/j.ibmb.2016.12.003 · Cited by 111
Connor, C., Dincer, A., Straubhaar, J., Galler, J. R., Houston, I. B., & Akbarian, S. (2012) · Schizophrenia Research · doi:10.1016/j.schres.2012.06.037 · Cited by 103
“Quality of microarray data was assessed employing the Bioconductor package, arrayQualityMetrics (Kauffmann et al., 2009).”
MethodKidd, M. S., Drozdov, I. A., & Modlin, I. M. (2015) · Endocrine Related Cancer · doi:10.1530/erc-15-0092 · Cited by 100
“Array outlier detection was performed in the array Quality Metrics package (Kauffmann et al. 2009) using the Kolmogorov–Smirnov statistic between each array’s distribution and the distribution of the pooled data.”
MethodSu, J., Ekman, C., Oskolkov, N., Lahti, L., Ström, K., Brāzma, A., Groop, L., Rung, J., & Hansson, O. (2015) · Skeletal Muscle · doi:10.1186/s13395-015-0059-1 · Cited by 109
“Quality control was carried out using the R/Bioconductor package array QualityMetrics [21] removing detected outlier arrays.”
Darkened Leaves Use Different Metabolic Strategies for Senescence and Survival
Law, S. R., Chrobok, D., Juvany, M., Delhomme, N., Lindén, P., Brouwer, B., Ahad, A., Möritz, T., Jansson, S., Gardeström, P., et al. (2018) · PLANT PHYSIOLOGY · doi:10.1104/pp.18.00062 · Cited by 114
“In Arabidopsis, it has been shown that these debilitating conditions do not elicit leaf senescence but rather suppress it, most likely as a survival strategy resulting from a general developmental arrest (Weaver and Amasino, 2001; Keech et al., 2007, 2010; Fan et al., 2017).”
BackgroundMethodResultInfluentialAgasing, A. M., Wu, Q., Khatri, B., Borisow, N., Ruprecht, K., Brandt, A. U., Gawde, S., Kumar, G., Quinn, J. L., Ko, R. M., et al. (2020) · Nature Communications · doi:10.1038/s41467-020-16625-7 · Cited by 98
Piras, I. S., Krate, J., Delvaux, E., Nolz, J., Mastroeni, D., Persico, A. M., Jepsen, W. M., Beach, T. G., Huentelman, M. J., & Coleman, P. D. (2019) · Journal of Alzheimer s Disease · doi:10.3233/jad-181113 · Cited by 117
“Quality controls were conducted using the R package ArrayQuality-Metrics [20], inspecting the heatmap relative to the pairwise distance among arrays, the boxplots and MA plot of the normalized expression values.”
Noori, A., Mezlini, A. M., Hyman, B. T., Serrano-Pozo, A., & Das, S. (2021) · Neurobiology of Disease · doi:10.1016/j.nbd.2020.105225 · Cited by 98
Importing ArrayExpress datasets into R/Bioconductor
Kauffmann, A., Rayner, T. F., Parkinson, H., Kapushesky, M., Lukk, M., Brāzma, A., & Huber, W. K. (2009) · Bioinformatics · doi:10.1093/bioinformatics/btp354 · Cited by 98
“, 2008), and the combination of different datasets is facilitated, for example, by the MergeMaid package (Cope et al., 2004).”
BackgroundMethodSelf-citationComparative transcriptome meta-analysis of Arabidopsis thaliana under drought and cold stress
Sharma, R., Singh, G., Bhattacharya, S., & Singh, A. (2018) · PLoS ONE · doi:10.1371/journal.pone.0203266 · Cited by 103
Microarray data quality control improves the detection of differentially expressed genes
Kauffmann, A., & Huber, W. K. (2010) · Genomics · doi:10.1016/j.ygeno.2010.01.003 · Cited by 96
“We recently presented a software to calculate a comprehensive set of widely used metrics that assesses data quality and helps identify apparent outlier arrays [13].”
MethodSelf-citationBlood RNA profiling in a large cohort of multiple sclerosis patients and healthy controls
Nickles, D., Chen, H. P., Li, M. M., Khankhanian, P., Madireddy, L., Caillier, S. J., Santaniello, A., Cree, B., Pelletier, D., Hauser, S. L., et al. (2013) · Human Molecular Genetics · doi:10.1093/hmg/ddt267 · Cited by 110
Metadata
- Authors
- Kauffmann, A., Gentleman, R., & Huber, W.
- Affiliations
- European Bioinformatics Institute (GB)
- Corresponding author
- Kauffmann, Audrey
- Venue
- Bioinformatics
- Publisher
- Oxford University Press (OUP)
- Published
- 2008-12-23
- Volume
- 25
- Issue
- 3
- Pages
- 415-416
- ISSN
- 1367-4803 (ISSN-L)
- 1367-4811
- PMC
- PMC2639074
- OpenAlex
- W2159096710
- Cited by
- 946
- References
- 11
- Citations by year
- 2026: 25 · 2025: 43 · 2024: 37 · 2023: 53 · 2022: 50 · 2021: 80 · 2020: 82 · 2019: 72 · 2018: 69 · 2017: 74 · 2016: 75 · 2015: 63 · 2014: 69 · 2013: 50 · 2012: 47
- FWCI
- 7.81
- Type
- journal article
- Language
- en
- Open access
- hybrid
- doi.org
- Licence
- Locations
- Bioinformatics (publishedVersion, cc-by-nc)
- PubMed Central (publishedVersion, cc-by-nc)
- PubMed (publishedVersion)
- Funders
- National Computational Infrastructure
- Australian Government
- Cancer Australia
- South Australian Research and Development Institute
- National Human Genome Research Institute (P41HG004059)
- Topics
- Life Sciences › Biochemistry, Genetics and Molecular Biology › Molecular Biology › Gene expression and cancer classification
- Life Sciences › Biochemistry, Genetics and Molecular Biology › Molecular Biology › Genomics and Phylogenetic Studies
- Life Sciences › Biochemistry, Genetics and Molecular Biology › Molecular Biology › Bioinformatics and Genomic Networks
- Keywords
- Bioconductor package, two-color microarrays, signal-to-noise ratio, reproducibility, automated reporting, diagnostic plots
- MeSH terms
- Algorithms, Data Interpretation, Statistical, Quality Control, Software, Computational Biology, Internet, Oligonucleotide Array Sequence Analysis
About these checks
Registry, retraction, Cites and statistics results are computed, not judged, with one exception: a printed reference that no index lists is read once by a model before it counts as a citation error. Claims are extracted by a model and kept only when their quote appears verbatim in the text; each cited source is then checked, with a model’s help, for whether it says what the claim relies on. Those verdicts can be wrong — read the claim’s quote and the cited source before relying on one.
Statistics and arithmetic are recomputed, not judged.
Confidence bands are shown only for fields calibrated on our annotated test set. None is calibrated yet, so no band is shown.
What counts as a claim ›How we measure confidence ›How we check this ›
Are you an author, or do you see a problem with this page? Request a review
Data sources
Bibliographic data: Semantic Scholar, OpenAlex, Crossref.
Contains information from the Semantic Scholar Academic Graph Datasets, made available under the ODC Attribution License (ODC-BY 1.0).
Semantic Scholar’s data is described in: Kinney, R., et al. (2023). The Semantic Scholar Open Data Platform. arXiv:2301.10140.
