

The DOI matches its Crossref record.
Characteristics of 454 pyrosequencing data—enabling realistic simulation with flowsim
Abstract
Motivation: The commercial launch of 454 pyrosequencing in 2005 was a milestone in genome sequencing in terms of performance and cost. Throughout the three available releases, average read lengths have increased to ∼500 base pairs and are thus approaching read lengths obtained from traditional Sanger sequencing. Study design of sequencing projects would benefit from being able to simulate experiments. Results: We explore 454 raw data to investigate its characteristics and derive empirical distributions for the flow values generated by pyrosequencing. Based on our findings, we implement Flowsim, a simulator that generates realistic pyrosequencing data files of arbitrary size from a given set of input DNA sequences. We finally use our simulator to examine the impact of sequence lengths on the results of concrete whole-genome assemblies, and we suggest its use in planning of sequencing projects, benchmarking of assembly methods and other fields. Availability: Flowsim is freely available under the General Public License from http://blog.malde.org/index.php/flowsim/ Contact: susanne.balzer@imr.no; ketil.malde@imr.no
Overview
The claims and statistics of this paper haven’t been checked yet.
Run the check — free, no account needed. It reads the open-access text and checks the sources it cites.
Integrity signals
Registry
Cites
Statistics
Figures
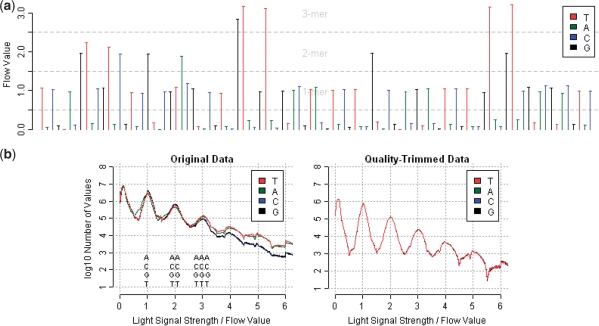
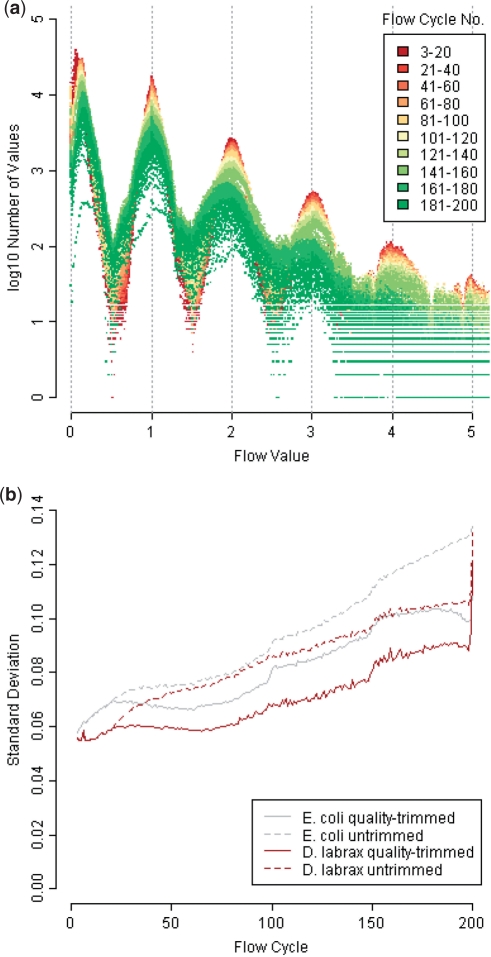
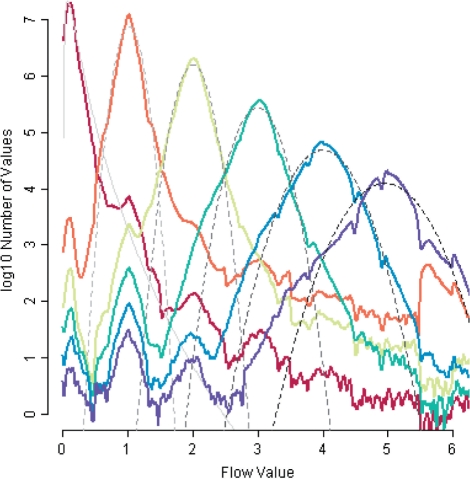
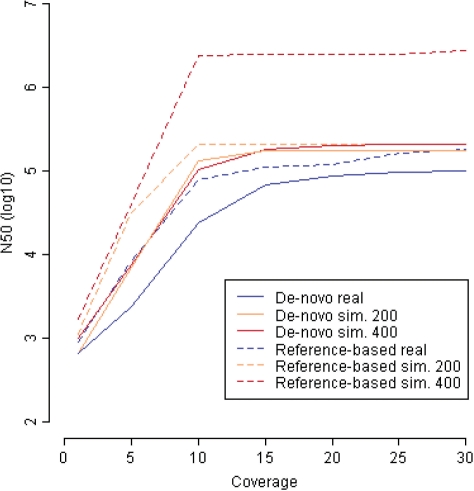
Verification
Claims the paper makes
The claims and statistics of this paper haven’t been checked yet.
Run the check — free, no account needed. It reads the open-access text and checks the sources it cites.
Claims other papers make about this one
Each is checked against this paper’s own text: does it say what the citing paper says it does?
In the citing paper
“Producing reads up to 1000 bp, the 454 technology had difficulty with accurately sequencing homopolymers, leading to indel errors in such regions (49).”
From Tandem repeats lead to sequence assembly errors and impose multi-level challenges for genome and protein databases (2019) · cites this paper as [49]
Self-check
Percentages, sums and reported differences re-computed from the paper’s own numbers.
The self-check needs the paper’s full text.
Citations
Cites
No references could be resolved yet.
Research works printed but not linked: 16
- Altschul, 1990, Basic local alignment search tool, J. Mol. Biol., 215, 403, 10.1016/S0022-2836(05)80360-2 · DOI · Paper page
- Blattner, 1997, The complete genome sequence of Escherichia coli K-12, Science, 277, 1453, 10.1126/science.277.5331.1453 · DOI
- Brockman, 2008, Quality scores and SNP detection in sequencing-by-synthesis systems, Genome Res., 18, 763, 10.1101/gr.070227.107 · DOI
- Engle, 1994, GenFrag 2.1: new features for more robust fragment assembly benchmarks, Comput. Appl. Biosci., 10, 567
- Gomez-Alvarez, 2009, Systematic artifacts in metagenomes from complex microbial communities, ISME J., 3, 1314, 10.1038/ismej.2009.72 · DOI
- Huse, 2007, Accuracy and quality of massively parallel DNA pyrosequencing, Genome Biol., 8, R143, 10.1186/gb-2007-8-7-r143 · DOI
- Huson, 2007, MEGAN analysis of metagenomic data, Genome Res., 17, 377, 10.1101/gr.5969107 · DOI
- Kuhl, 2010, The European sea bass Dicentrarchus labrax genome puzzle: comparative BAC-mapping and low coverage shotgun sequencing, BMC Genomics, 11, 68, 10.1186/1471-2164-11-68 · DOI
- Margulies, 2005, Genome sequencing in microfabricated high-density picolitre reactors, Nature, 437, 376, 10.1038/nature03959 · DOI · Paper page
- Miller, 2008, Aggressive assembly of pyrosequencing reads with mates, Bioinformatics, 24, 2818, 10.1093/bioinformatics/btn548 · DOI
- Myers, 1999, A dataset generator for whole genome shotgun sequencing, Proceedings of International Conference on Intelligent Systems of Molecular Biology, 202
- Quince, 2009, Accurate determination of microbial diversity from 454 pyrosequencing data, Nat. Methods, 6, 639, 10.1038/nmeth.1361 · DOI
- Quinlan, 2008, Pyrobayes: an improved base caller for SNP discovery in pyrosequences, Nat. Methods, 5, 179, 10.1038/nmeth.1172 · DOI
- Richter, 2008, MetaSim: a sequencing simulator for genomics and metagenomics, PLoS One, 3, e3373, 10.1371/journal.pone.0003373 · DOI
- Roche Applied Science, 2008, Genome Sequencer Data Analysis Software Manual, Software Version 2.0.00, Roche Diagnostics GmbH.
- Vacic, 2008, A probabilistic method for small RNA flowgram matching, Pacific Symposium on Biocomputing, 75
Cited by
Sorted by citations
A new view of the fish gut microbiome: advances from next-generation sequencing
Ghanbari, M., Kneifel, W., & Domig, K. J. (2015) · Aquaculture · doi:10.1016/j.aquaculture.2015.06.033 · Cited by 669
Tørresen, O. K., Star, B., Mier, P., Andrade-Navarro, M. A., Bateman, A., Jarnot, P., Gruca, A., Grynberg, M., Kajava, A. V., Promponas, V. J., et al. (2019) · Nucleic Acids Research · doi:10.1093/nar/gkz841 · Cited by 347
Metadata
- Authors
- Balzer, S., Malde, K., Lanzén, A., Sharma, A., & Jonassen, I.
- Affiliations
- 1 Institute of Marine Research, PO Box 1870, N−5817, 2Department of Informatics, University of Bergen, PO Box 7803, N-5020, 3Computational Biology Unit, Bergen Center for Computational Science, Thormøhlensgate 55, N-5008 and 4Department of Biology, University of Bergen, PO Box 7803, N-5020, Bergen
- Venue
- Bioinformatics
- Publisher
- Oxford University Press (OUP)
- Published
- 2010-09-04
- Volume
- 26
- Issue
- 18
- Pages
- i420-i425
- ISSN
- 1367-4811
- 1367-4803
- PMC
- PMC2935434
- Cited by
- 124
- References
- 0
- Language
- en
About these checks
Registry, retraction, Cites and statistics results are computed, not judged, with one exception: a printed reference that no index lists is read once by a model before it counts as a citation error. Claims are extracted by a model and kept only when their quote appears verbatim in the text; each cited source is then checked, with a model’s help, for whether it says what the claim relies on. Those verdicts can be wrong — read the claim’s quote and the cited source before relying on one.
Statistics and arithmetic are recomputed, not judged.
Confidence bands are shown only for fields calibrated on our annotated test set. None is calibrated yet, so no band is shown.
What counts as a claim ›How we measure confidence ›How we check this ›
Are you an author, or do you see a problem with this page? Request a review
How to cite
Cite CoChat for the checks on this page, and the paper for its own findings.
- This page
- CoChat. (2026). Citation check: Characteristics of 454 pyrosequencing data—enabling realistic simulation with flowsim. https://app.cochat.ai/papers/10.1093/bioinformatics/btq365
- The paper
- Balzer, S., Malde, K., Lanzén, A., Sharma, A., & Jonassen, I. (2010). Characteristics of 454 pyrosequencing data—enabling realistic simulation with flowsim. Bioinformatics. https://doi.org/10.1093/bioinformatics/btq365
