

The DOI matches its Crossref record; the references it cites are not checked yet.
SCODE: an efficient regulatory network inference algorithm from single-cell RNA-Seq during differentiation
Open accessPublished version of a preprint
Abstract
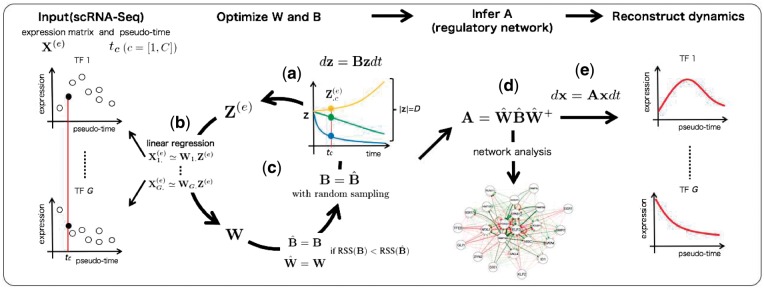
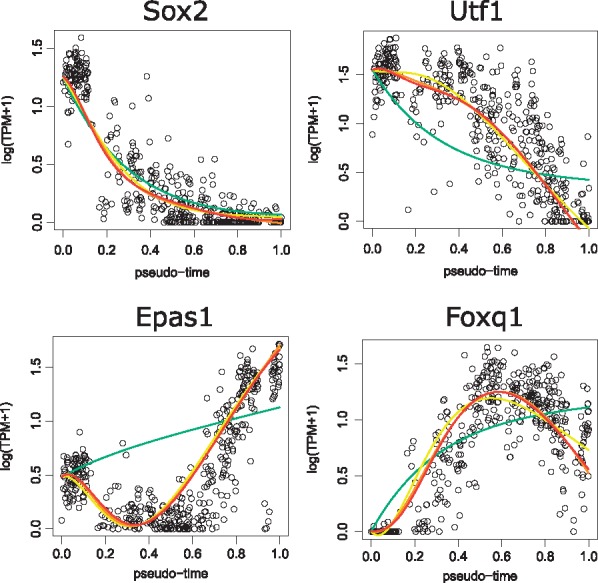
Motivation: The analysis of RNA-Seq data from individual differentiating cells enables us to reconstruct the differentiation process and the degree of differentiation (in pseudo-time) of each cell. Such analyses can reveal detailed expression dynamics and functional relationships for differentiation. To further elucidate differentiation processes, more insight into gene regulatory networks is required. The pseudo-time can be regarded as time information and, therefore, single-cell RNA-Seq data are time-course data with high time resolution. Although time-course data are useful for inferring networks, conventional inference algorithms for such data suffer from high time complexity when the number of samples and genes is large. Therefore, a novel algorithm is necessary to infer networks from single-cell RNA-Seq during differentiation. Results: In this study, we developed the novel and efficient algorithm SCODE to infer regulatory networks, based on ordinary differential equations. We applied SCODE to three single-cell RNA-Seq datasets and confirmed that SCODE can reconstruct observed expression dynamics. We evaluated SCODE by comparing its inferred networks with use of a DNaseI-footprint based network. The performance of SCODE was best for two of the datasets and nearly best for the remaining dataset. We also compared the runtimes and showed that the runtimes for SCODE are significantly shorter than for alternatives. Thus, our algorithm provides a promising approach for further single-cell differentiation analyses. Availability and Implementation: The R source code of SCODE is available at https://github.com/hmatsu1226/SCODE Supplementary information: Supplementary data are available at Bioinformatics online.
Overview
The claims and statistics of this paper haven’t been checked yet.
Free: it reads the open-access text and checks the first 5 claims that cite a source we can check. Create a free account to check every claim.
Integrity signals
Registry
Cites
Statistics
Figures
Verification
Claims the paper makes
The claims and statistics of this paper haven’t been checked yet.
Free: it reads the open-access text and checks the first 5 claims that cite a source we can check. Create a free account to check every claim.
Claims other papers make about this one
Each is checked against this paper’s own text: does it say what the citing paper says it does?
The cited source doesn’t support the claim as written.
In the citing paper
“Although there exist other GRN inference approaches based on pseudotime analysis,23,24,25 their performance is generally inferior to those that rely solely on the scRNA-seq data.13”
From SCING: Inference of robust, interpretable gene regulatory networks from single cell and spatial transcriptomics (2023) · cites this paper as [23]
Checked by a reasoning model — may be wrong.
Experimental — accuracy not yet measuredThe cited source says what the claim attributes to it.
In the citing paper
“Indeed, several single‐cell GRN inference methods use trajectories with mechanistic differential equation models (Ocone et al, 2015; Matsumoto et al, 2017).”
From Current best practices in single-cell RNA-seq analysis: a tutorial (2019) · cites this paper as Matsumoto et al, 2017
The cited source says what the claim attributes to it.
In the citing paper
“Single-cell RNA sequencing (scRNA-seq) data enables cell type-specific trans-regulation inference through co-expression analysis such as PIDC and SCENIC21–30.”
From Inferring gene regulatory networks from single-cell multiome data using atlas-scale external data (2025) · cites this paper as [23]
In the citing paper
“A special category within these is the ODE models, which reconstruct expression profiles over time to detect and merge similar profiles.”
From Mapping gene regulatory networks from single-cell omics data (2018) · cites this paper as [45]
Self-check
Percentages, sums and reported differences re-computed from the paper’s own numbers.
The self-check needs the paper’s full text.
Citations
The citation lists are queued
They are fetched later and appear here then.
References 43 · Cited by 439
Metadata
- Authors
- Matsumoto, H., Kiryu, H., Furusawa, C., Ko, M. S. H., Ko, S. B. H., Gouda, N., Hayashi, T., & Nikaido, I.
- Affiliations
- RIKEN (JP)
- The University of Tokyo (JP)
- Keio University (JP)
- Corresponding author
- Matsumoto, Hirotaka
- ORCID
- Venue
- Bioinformatics
- Publisher
- Oxford University Press (OUP)
- Published
- 2017-04-04
- Volume
- 33
- Issue
- 15
- Pages
- 2314-2321
- ISSN
- 1367-4803 (ISSN-L)
- 1367-4811
- PMC
- PMC5860123
- OpenAlex
- W2952535935
- Cited by
- 439
- References
- 43
- Citations by year
- 2026: 31 · 2025: 74 · 2024: 64 · 2023: 72 · 2022: 52 · 2021: 62 · 2020: 42 · 2019: 23 · 2018: 13 · 2017: 6
- FWCI
- 9.38
- Type
- journal article
- Language
- en
- Open access
- hybrid
- doi.org
- Licence
- Locations
- Bioinformatics (publishedVersion, cc-by)
- bioRxiv (Cold Spring Harbor Laboratory) (acceptedVersion, cc-by)
- PubMed Central (publishedVersion, cc-by)
- PubMed (publishedVersion)
- Funders
- Core Research for Evolutional Science and Technology
- CREST
- Japan Science and Technology Agency
- JST
- Topics
- Life Sciences › Biochemistry, Genetics and Molecular Biology › Molecular Biology › Gene Regulatory Network Analysis
- Life Sciences › Biochemistry, Genetics and Molecular Biology › Molecular Biology › Single-cell and spatial transcriptomics
- Life Sciences › Biochemistry, Genetics and Molecular Biology › Molecular Biology › Bioinformatics and Genomic Networks
- Keywords
- gene regulatory network inference, single-cell RNA sequencing, cell differentiation, pseudotime, ordinary differential equations, computational efficiency, DNase I footprinting
- MeSH terms
- Algorithms, Animals, Cell Differentiation, Humans, Software, Sequence Analysis, RNA, Mice, Gene Regulatory Networks, Single-Cell Analysis
About these checks
Registry, retraction, Cites and statistics results are computed, not judged, with one exception: a printed reference that no index lists is read once by a model before it counts as a citation error. Claims are extracted by a model and kept only when their quote appears verbatim in the text; each cited source is then checked, with a model’s help, for whether it says what the claim relies on. Those verdicts can be wrong — read the claim’s quote and the cited source before relying on one.
Statistics and arithmetic are recomputed, not judged.
Confidence bands are shown only for fields calibrated on our annotated test set. None is calibrated yet, so no band is shown.
What counts as a claim ›How we measure confidence ›How we check this ›
Are you an author, or do you see a problem with this page? Request a review
How to cite
Cite CoChat for the checks on this page, and the paper for its own findings.
- This page
- CoChat. (2026). Citation check: SCODE: an efficient regulatory network inference algorithm from single-cell RNA-Seq during differentiation. https://app.cochat.ai/papers/10.1093/bioinformatics/btx194
- The paper
- Matsumoto, H., Kiryu, H., Furusawa, C., Ko, M. S. H., Ko, S. B. H., Gouda, N., Hayashi, T., & Nikaido, I. (2017). SCODE: an efficient regulatory network inference algorithm from single-cell RNA-Seq during differentiation. Bioinformatics. https://doi.org/10.1093/bioinformatics/btx194
Data sources
Bibliographic data: Semantic Scholar, OpenAlex, Crossref.
Contains information from the Semantic Scholar Academic Graph Datasets, made available under the ODC Attribution License (ODC-BY 1.0).
Semantic Scholar’s data is described in: Kinney, R., et al. (2023). The Semantic Scholar Open Data Platform. arXiv:2301.10140.
