

The DOI matches its Crossref record; 14 of the 14 references it cites were found in a registry or an index.
Statistical independence of the colocalized association signals for type 1 diabetes and RPS26 gene expression on chromosome 12q13
Open accessAbstract
Following the recent success of genome-wide association studies in uncovering disease-associated genetic variants, the next challenge is to understand how these variants affect downstream pathways. The most proximal trait to a disease-associated variant, most commonly a single nucleotide polymorphism (SNP), is differential gene expression due to the cis effect of SNP alleles on transcription, translation, and/or splicing gene expression quantitative trait loci (eQTL). Several genome-wide SNP-gene expression association studies have already provided convincing evidence of widespread association of eQTLs. As a consequence, some eQTL associations are found in the same genomic region as a disease variant, either as a coincidence or a causal relationship. Cis-regulation of RPS26 gene expression and a type 1 diabetes (T1D) susceptibility locus have been colocalized to the 12q13 genomic region. A recent study has also suggested RPS26 as the most likely susceptibility gene for T1D in this genomic region. However, it is still not clear whether this colocalization is the result of chance alone or if RPS26 expression is directly correlated with T1D susceptibility, and therefore, potentially causal. Here, we derive and apply a statistical test of this hypothesis. We conclude that RPS26 expression is unlikely to be the molecular trait responsible for T1D susceptibility at this locus, at least not in a direct, linear connection.
Overview
The claims and statistics of this paper haven’t been checked yet.
Run the check — free, no account needed. It reads the open-access text and checks the sources it cites.
Integrity signals
Registry
Cites
Statistics
Figures
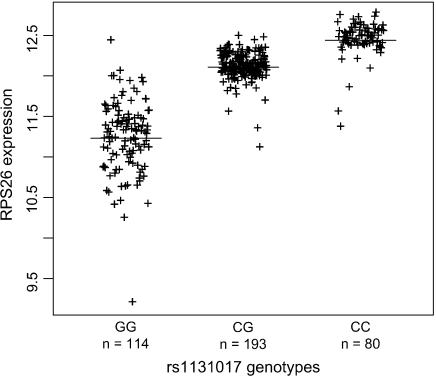
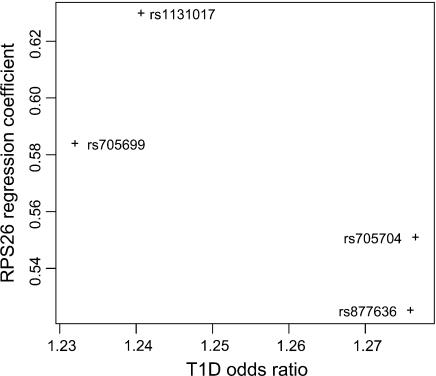
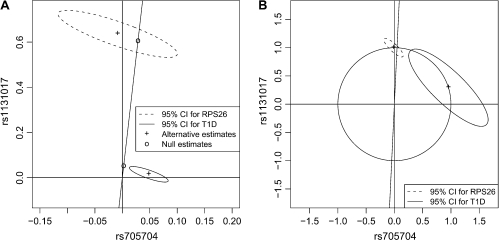
Verification
Claims the paper makes
The claims and statistics of this paper haven’t been checked yet.
Run the check — free, no account needed. It reads the open-access text and checks the sources it cites.
Claims other papers make about this one
Each is checked against this paper’s own text: does it say what the citing paper says it does?
In the citing paper
“It should be noted that this approach can have low power compared to the inclusion of an interaction term in a 2SLS regression.111”
From Mendelian randomization (2022) · cites this paper as [111]
Self-check
Percentages, sums and reported differences re-computed from the paper’s own numbers.
The self-check needs the paper’s full text.
Citations
Cites
Monte Carlo sampling methods using Markov chains and their applications.
Hastings, W. K. (1970) · Biometrika · doi:10.1093/biomet/57.1.97 · Cited by 15,195
Kass, R. E., & Raftery, A. E. (1995) · Journal of the American Statistical Association · doi:10.1080/01621459.1995.10476572 · Cited by 12,558
Summaries of Affymetrix GeneChip probe level data
Irizarry, R. A. (2003) · Nucleic Acids Research · doi:10.1093/nar/gng015 · Cited by 4,837
Genome-wide association studies for complex traits: consensus, uncertainty and challenges
McCarthy, M. I., Abecasis, G. R., Cardon, L. R., Goldstein, D. B., Little, J., Ioannidis, J. P. A., & Hirschhorn, J. N. (2008) · Nature Reviews Genetics · doi:10.1038/nrg2344 · Cited by 2,891
Computing Bayes Factors by Combining Simulation and Asymptotic Approximations
DiCiccio, T., Kass, R., Raftery, A., & Wasserman, L. (1997) · Journal of the American Statistical Association · doi:10.1080/01621459.1997.10474045 · Cited by 2,029
Genetic variants regulating ORMDL3 expression contribute to the risk of childhood asthma
Moffatt, M. F., Kabesch, M., Liang, L., Dixon, A. L., Strachan, D. P., Heath, S. C., Depner, M., Berg, A. V., Bufe, A., Rietschel, E., et al. (2007) · Nature · doi:10.1038/nature06014 · Cited by 1,590
Robust associations of four new chromosome regions from genome-wide analyses of type 1 diabetes
Finland, G. O. T. 1. D. I., Todd, J. A., the Wellcome Trust Case Control Consortium, Walker, N. M., Cooper, J. D., Smyth, D. J., Downes, K., Plagnol, V., Bailey, R., Nejentsev, S., et al. (2007) · Nature Genetics · doi:10.1038/ng2068 · Cited by 1,456
Self-citationGenetics of gene expression and its effect on disease
Emilsson, V., Thorleifsson, G., Zhang, B., Leonardson, A. S., Zink, F., Zhu, J., Carlson, S., Helgason, A., Walters, G. B., Gunnarsdottir, S., et al. (2008) · Nature · doi:10.1038/nature06758 · Cited by 1,296
Genetic analysis of genome-wide variation in human gene expression
Morley, M. P., Molony, C. M., Weber, T. M., Devlin, J. L., Ewens, K. G., Spielman, R. S., & Cheung, V. G. (2004) · Nature · doi:10.1038/nature02797 · Cited by 1,212
A genome-wide association study of global gene expression
Dixon, A. L., Liang, L., Moffatt, M. F., Chen, W., Heath, S. C., Wong, K., Taylor, J. C., Burnett, E. C., Gut, I. G., Farrall, M., et al. (2007) · Nature Genetics · doi:10.1038/ng2109 · Cited by 946
Mapping the Genetic Architecture of Gene Expression in Human Liver
Schadt, E. E., Molony, C. M., Chudin, E., Hao, K., Yang, X., Lum, P. Y., Kasarskis, A., Zhang, B., Wang, S. S.-M., Suver, C., et al. (2008) · PLoS Biology · doi:10.1371/journal.pbio.0060107 · Cited by 918
Discovery of expression QTLs using large-scale transcriptional profiling in human lymphocytes
Göring, H. H. H., Curran, J. E., Johnson, M. P., Dyer, T. D., Charlesworth, J., Cole, S. A., Jowett, J. B. M., Abraham, L. J., Rainwater, D. L., Comuzzie, A. G., et al. (2007) · Nature Genetics · doi:10.1038/ng2119 · Cited by 503
Regression Analysis Under Link Violation
Li, K.-C., & Duan, N. (1989) · The Annals of Statistics · doi:10.1214/aos/1176347254 · Cited by 468
Use of unphased multilocus genotype data in indirect association studies
Clayton, D., Chapman, J., & Cooper, J. (2004) · Genetic Epidemiology · doi:10.1002/gepi.20032 · Cited by 186
Self-citation
Cited by
Sorted by citations
Giambartolomei, C., Vukcevic, D., Schadt, E. E., Franke, L., Hingorani, A. D., Wallace, C., & Plagnol, V. (2014) · PLoS Genetics · doi:10.1371/journal.pgen.1004383 · Cited by 4,261
Self-citationSanderson, E., Glymour, M. M., Holmes, M. V., Kang, H., Morrison, J., Munafò, M. R., Palmer, T., Schooling, C. M., Wallace, C., Zhao, Q., et al. (2022) · Nature Reviews Methods Primers · doi:10.1038/s43586-021-00092-5 · Cited by 2,229
Opportunities and challenges for transcriptome-wide association studies
Wainberg, M., Sinnott-Armstrong, N., Mancuso, N., Barbeira, A., Knowles, D. A., Golan, D., Ermel, R., Ruusalepp, A., Quertermous, T., Hao, K., et al. (2019) · Nature Genetics · doi:10.1038/s41588-019-0385-z · Cited by 906
Colocalization of GWAS and eQTL Signals Detects Target Genes
Hormozdiari, F., van de Bunt, M., Segrè, A. V., Li, X., Joo, J. W. J., Bilow, M., Sul, J. H., Sankararaman, S., Pasaniuc, B., & Eskin, E. (2016) · The American Journal of Human Genetics · doi:10.1016/j.ajhg.2016.10.003 · Cited by 697
Genetic variability in the regulation of gene expression in ten regions of the human brain
UK Brain Expression Consortium, Ramasamy, A., North American Brain Expression Consortium, Trabzuni, D., Guelfi, S., Varghese, V., Smith, C., Walker, R., De, T., Coin, L., et al. (2014) · Nature Neuroscience · doi:10.1038/nn.3801 · Cited by 644
Metadata
- Authors
- Plagnol, V., Smyth, D. J., Todd, J. A., & Clayton, D. G.
- Affiliations
- University of Cambridge (GB)
- Corresponding author
- Plagnol, Vincent
- Venue
- Biostatistics
- Publisher
- Oxford University Press (OUP)
- Published
- 2008-11-27
- Volume
- 10
- Issue
- 2
- Pages
- 327-334
- ISSN
- 1465-4644 (ISSN-L)
- 1468-4357
- PMC
- PMC2648905
- OpenAlex
- W2160717726
- Cited by
- 113
- References
- 14
- Citations by year
- 2026: 6 · 2025: 10 · 2024: 9 · 2023: 8 · 2022: 10 · 2021: 19 · 2020: 8 · 2019: 5 · 2018: 3 · 2016: 1 · 2015: 5 · 2014: 4 · 2013: 6 · 2012: 5
- FWCI
- 2.66
- Type
- journal article
- Language
- en
- Open access
- hybrid
- doi.org
- Licence
- cc-by-nc
- Locations
- Biostatistics (publishedVersion, cc-by-nc)
- PubMed Central (publishedVersion, cc-by-nc)
- PubMed (publishedVersion)
- UCL Discovery (University College London) (submittedVersion)
- Funders
- Wellcome Trust (061858, 079895)
- National Institute for Health and Care Research (NF-SI-0508-10275)
- Cambridge Institute for Medical Research, University of Cambridge (079895)
- NIHR Cambridge Biomedical Research Centre
- Topics
- Life Sciences › Biochemistry, Genetics and Molecular Biology › Genetics › Genetic Associations and Epidemiology
- Life Sciences › Biochemistry, Genetics and Molecular Biology › Genetics › Genetic Mapping and Diversity in Plants and Animals
- Life Sciences › Biochemistry, Genetics and Molecular Biology › Genetics › Diabetes and associated disorders
- Keywords
- type 1 diabetes, RPS26, expression quantitative trait loci, colocalization, cis-regulation, chromosome 12q13, single nucleotide polymorphisms, causal inference
- MeSH terms
- Chromosome Mapping, Chromosomes, Human, Pair 12, Diabetes Mellitus, Type 1, Humans, Models, Genetic, Ribosomal Proteins, Genetic Predisposition to Disease, Polymorphism, Single Nucleotide, Quantitative Trait Loci, Genome-Wide Association Study
About these checks
Registry, retraction, Cites and statistics results are computed, not judged, with one exception: a printed reference that no index lists is read once by a model before it counts as a citation error. Claims are extracted by a model and kept only when their quote appears verbatim in the text; each cited source is then checked, with a model’s help, for whether it says what the claim relies on. Those verdicts can be wrong — read the claim’s quote and the cited source before relying on one.
Statistics and arithmetic are recomputed, not judged.
Confidence bands are shown only for fields calibrated on our annotated test set. None is calibrated yet, so no band is shown.
What counts as a claim ›How we measure confidence ›How we check this ›
Are you an author, or do you see a problem with this page? Request a review
