

The DOI matches its Crossref record; 59 of the 59 references it cites were found in a registry or an index; 16 of the 59 sources its claims cite were checked for support.
How We Transmit Memories to Other Brains: Constructing Shared Neural Representations Via Communication
Open accessPublished version of a preprint
Abstract
Humans are able to mentally construct an episode when listening to another person's recollection, even though they themselves did not experience the events. However, it is unknown how strongly the neural patterns elicited by mental construction resemble those found in the brain of the individual who experienced the original events. Using fMRI and a verbal communication task, we traced how neural patterns associated with viewing specific scenes in a movie are encoded, recalled, and then transferred to a group of naïve listeners. By comparing neural patterns across the 3 conditions, we report, for the first time, that event-specific neural patterns observed in the default mode network are shared across the encoding, recall, and construction of the same real-life episode. This study uncovers the intimate correspondences between memory encoding and event construction, and highlights the essential role our common language plays in the process of transmitting one's memories to other brains.
Overview
CoChat Summary
TL;DR
Using fMRI and a verbal communication task, this study traced scene-specific neural patterns from movie encoding to spoken recall to naïve listening. It reports that event-specific patterns in the default mode network are shared across encoding, recall, and mental construction of the same real-life episode.
Key findings
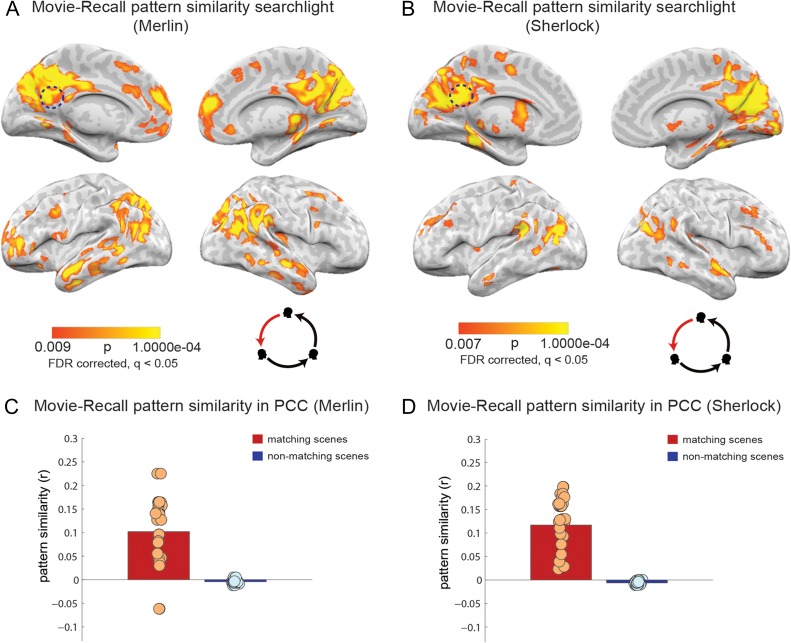
- Event-specific neural patterns in default mode network regions—including posterior medial cortex, medial prefrontal cortex, parahippocampal cortex, posterior parietal cortex, angular gyrus, precuneus, retrosplenial cortex, and PCC—were shared across movie-viewing, spoken recall, and listening, and replicated across both movies. A triple shared pattern analysis confirmed patterns shared across all 3 conditions.
- In PCC, movie-viewing-to-spoken-recall reinstatement was positive in 17/18 Merlin subjects and 18/18 Sherlock subjects; listening-to-movie-viewing similarity was positive in all Merlin subjects and 16/18 Sherlock subjects. Scene classification from PCC patterns reached 27% for Merlin and 22% for Sherlock versus 4.5% chance (P = 0.0002 and P = 0.001, 1-tailed).
- Speaker–listener neural alignment in PCC predicted listeners’ comprehension: R = 0.71, P = 0.001 for Merlin and R = 0.54, P = 0.022 for Sherlock. Speaker–listener lag peaked at r = 0.17 around 5 TRs (7.5 s) in Merlin and replicated at ~5 TRs in Sherlock.
- Listeners’ comprehension was best predicted by similarity to the actual speaker’s encoding patterns, relative to other viewers, in Merlin and among the top 3 in Sherlock.
Methods
- fMRI study with two audio–visual movies: Sherlock (24 min) and Merlin (25 min). One speaker watched and verbally recalled each movie in the scanner (18-min Sherlock and 15-min Merlin recordings); separate groups of naïve listeners heard the recordings. A total of 52 participants were scanned; exclusions included 4 for head motion >3 mm, 4 who fell asleep, 5 who failed the postscan memory test, and 2 who had watched the movie but did not report it.
- Analyses divided each movie into 22 scenes, averaged brain responses within each scene, and compared scene-specific patterns across movie-viewing, spoken-recall, and listening using searchlight pattern similarity (15 × 15 × 15 mm³ cubes), PCC and other ROI analyses, permutation tests, FDR correction at q = 0.05, classification, and a triple shared pattern analysis.
Limitations
- The paper states that results should be interpreted with caution given the relatively small number of subjects (n = 18) in each study, and that future studies are needed to understand how a speaker’s idiosyncratic encoding shapes transmission.
- The paper notes that the 3 neural patterns are similar but not identical; verbal descriptions were compressed and abstracted relative to the movie, and information may change meaningfully as it passes through the communication cycle.
- The paper reports that hippocampus did not show reliable pattern similarity in most comparisons, except recall–listening in Merlin, and that the auditory cortex control ROI did not exhibit reliable pattern similarity. Evident from the text: only one speaker was used, and the speaker focused on episodic narrative rather than fine sensory details, so low-level sensory reinstatement was not found.
Model-written summary. Check it against the paper before relying on it.
Integrity signals
Registry
Cites
Statistics
Figures




Verification
Claims the paper makes
8 Valid · 1 Not valid · 15 Not checked · 67 Own results and interpretations
At least one cited source doesn’t support this claim or points to a different paper, and none confirmed it — see the verdicts below.
In the paper
“Thus, the coupling between speaker and listener is only possible if the interlocutors have developed a shared understanding about the meaning and proper use of each spoken (or written) sign (Clark and Krych 2004; Pickering and Garrod 2004; Clark 2006).”
§ How We Transmit Memories to Other Brains: Constructing Shared Neural Representations Via Communication > Discussion
What the sources say
- Not checked yetcites Clark and Krych 2004
- Disputedcites Pickering and Garrod 2004 sourceExperimental — accuracy not yet measured
The paper contrasts its model with the view that establishing shared common ground is a precondition for communication (section 4, p. 11). It says alignment builds implicit common ground automatically and that interlocutors need not develop full common ground in routine conversation (section 4.1, pp. 11–12). This runs contrary to the claim that coupling is possible only after they have developed shared understanding of every sign. (LLM, conf=0.86)
Checked by a reasoning model — may be wrong.
- Not checked yetcites Clark 2006
plainstates a possible cause- Asserted: passes — The authors put it forward as true.
- Checkable: passes — It can be checked against evidence.
- Load-bearing: passes — The paper’s conclusions depend on it.
- Based: passes — The paper gives a reason why it holds.
The cited sources support only part of this claim — read each source’s verdict below.
In the paper
“Secondly, a number of studies suggest that the same high-order DMN areas exhibit increased activity during encoding and retrieval of episodic memories, and furthermore are active during the construction of imaginary and future events (Svoboda et al. 2006; Addis et al. 2007; Hassabis and Maguire 2007, 2009; Schacter et al. 2007; Szpunar et al. 2007; Spreng et al. 2009).”
§ How We Transmit Memories to Other Brains: Constructing Shared Neural Representations Via Communication > Introduction
What the sources say
- Partly supportedcites Svoboda et al. 2006 sourceExperimental — accuracy not yet measured
Section 3.1 reports a core network of regions activated during autobiographical remembering, supporting the retrieval part of the claim. The Introduction says the meta-analysis examines activation in autobiographical memory retrieval; our copy does not establish that the same regions increase activity during episodic encoding or identify them as high-order DMN areas. No page numbers are available in our copy. (LLM, conf=0.84)
- Partly supportedcites Addis et al. 2007 sourceExperimental — accuracy not yet measured
The Discussion (page not provided) reports extensive overlap between regions active during retrieval of past events and imagination of future events, particularly during elaboration. It does not show that those same areas increase activity during episodic-memory encoding; the study examined past-event retrieval and future-event imagination, not encoding. (LLM, conf=0.87)
- Not checked yetcites Hassabis and Maguire 2007
hedgedstates an association- Asserted: passes — The authors put it forward as true.
- Checkable: passes — It can be checked against evidence.
- Load-bearing: passes — The paper’s conclusions depend on it.
- Based: passes — The paper gives a reason why it holds.
- Partly supported
The sources with a verdict support this claim; the rest weren’t checked yet, have no full text we could read, or their verdicts aren’t rated yet.
In the paper
“Our finding of similar brain activity patterns between encoding and recall of a continuous movie narrative supports previous studies showing reinstatement of neural patterns during recall using simpler stimuli such as words, images, and short videos (Polyn et al. 2005; St-Laurent et al. 2014; Wing et al. 2014; Bird et al. 2015).”
§ How We Transmit Memories to Other Brains: Constructing Shared Neural Representations Via Communication > Results > Pattern Similarity Between Spoken-Recall and Movie-Viewing
What the sources say
- Not checked yetcites Polyn et al. 2005 source
- Supportedcites St-Laurent et al. 2014 source
Split into 2 atoms — 2 confirmed, 0 partially supported, 0 disputed, 0 misattributed, 0 unverifiable. Expand the claim to see per-atom verdicts.
- Supportedcites Wing et al. 2014 source
The Abstract describes participants viewing pictures of scenes during encoding and recalling them during retrieval; it reports item-level similarity between encoding and retrieval patterns as evidence of reactivation. This supports the image-based example attributed to Wing et al. in the multi-citation sentence, not a claim that Wing et al. studied a continuous movie narrative. (LLM, conf=0.92)
plainstates an associationn = 18- Asserted: passes — The authors put it forward as true.
- Checkable: passes — It can be checked against evidence.
- Load-bearing: unclear — It is unclear whether the paper’s conclusions depend on it.
- Based: passes — The paper gives a reason why it holds.
The cited sources support only part of this claim — read each source’s verdict below.
In the paper
“Secondly, a number of studies suggest that the same high-order DMN areas exhibit increased activity during encoding and retrieval of episodic memories, and furthermore are active during the construction of imaginary and future events (Svoboda et al. 2006; Addis et al. 2007; Hassabis and Maguire 2007, 2009; Schacter et al. 2007; Szpunar et al. 2007; Spreng et al. 2009).”
§ How We Transmit Memories to Other Brains: Constructing Shared Neural Representations Via Communication > Introduction
What the sources say
- Partly supportedcites Svoboda et al. 2006 sourceExperimental — accuracy not yet measured
The only part of this claim our copy of Svoboda et al. (2006) supports is the brief remark in 3.4.1 (Dissociating episodic from semantic autobiographical memory) that past and future autobiographical thought show a correspondence, and that one functional neuroimaging study found both conditions engaged anteromedial prefrontal and medial temporal regions — but that is reported from Okuda et al. (1998), not the meta-analysis's own result, and it concerns future thinking only. The paper does not address the construction of imaginary events at all, and it never frames its findings as a 'default mode network' or as 'high-order' areas: its own meta-analytic product (3.1, An overview of regional activation) is a 'core' AM network (medial and ventrolateral prefrontal cortices, medial and lateral temporal cortices, temporoparietal junction, retrosplenial/posterior cingulate, cerebellum) derived solely from autobiographical retrieval studies. Resting-state/DMN regions appear only as a caveat about reference conditions (3.2, noting Andreasen, Binder, Gusnard-type rest activations overlap with AM), which does not establish the claim's imaginal-construction point. (LLM, conf=0.68)
- Partly supportedcites Addis et al. 2007 sourceExperimental — accuracy not yet measured
Addis et al. (2007) do show shared substrates for past and future event CONSTRUCTION, but the Results conjunction (p. Results) limits this to left hippocampus, right inferior parietal lobule and occipital/cuneus cortex, with the parietal and occipital conjunctions reflecting 'significantly less deactivation' rather than reliable activation, and the Discussion (p. Discussion) notes occipital and lateral parietal ROIs 'exhibited minimal or negative percent signal change'. The high-order midline areas the claim refers to are placed by the paper at ELABORATION, not construction: parahippoccal/retrosplenial, posterior cingulate and precuneus showed an 'extensive swath of overlapping activity' only during elaboration, and left medial PFC 'may have [been] delayed ... until some amount of autobiographical information had been retrieved and a personal event constructed'. The paper also studied only cued future event construction, not imaginary events as a separate condition, and never frames its regions as the 'default mode network'. (LLM, conf=0.75)
- Not checked yetcites Hassabis and Maguire 2007
hedgedstates an association- Asserted: passes — The authors put it forward as true.
- Checkable: passes — It can be checked against evidence.
- Load-bearing: passes — The paper’s conclusions depend on it.
- Based: passes — The paper gives a reason why it holds.
- Partly supported
The cited sources support only part of this claim — read each source’s verdict below.
In the paper
“Accordingly, movie-viewing to spoken-recall pattern correlations were not found in low-level sensory areas, but instead were located in high-level DMN areas, which have been previously found to encode amodal abstract information (Binder et al. 2009; Honey et al. 2012; Regev et al. 2013).”
§ How We Transmit Memories to Other Brains: Constructing Shared Neural Representations Via Communication > Discussion
What the sources say
- Supportedcites Binder et al. 2009 source
The Semantic System of the Human Brain describes semantic regions as high-level integrative areas receiving multimodal input and calls them “amodal.” Semantic Processing and the “Default Network” says this semantic network closely resembles the default network and that the default network engages in semantic processing. Together, these passages support the attributed background claim; they do not address the citing authors’ movie-to-recall correlations. (LLM, conf=0.88)
- Partly supportedcites Honey et al. 2012 sourceExperimental — accuracy not yet measured
The Results section, “Identifying Regions Sensitive to Shared Content across Languages” (page not provided), reports shared responses to the same story content in higher-order regions, including the precuneus, despite differences between spoken languages. This supports abstract, form-tolerant content representation in some areas associated with the DMN, but the study compares spoken language with spoken language; it does not establish that those representations are amodal across sensory modalities. (LLM, conf=0.84)
- Partly supportedcites Regev et al. 2013 sourceExperimental — accuracy not yet measured
The Modality-invariant responses section reports similar responses to spoken and written narratives in the precuneus, a high-order region, supporting an interpretation that its response is abstracted from sensory input. But the Discussion also reports modality-selective responses in other high-order parietal and frontal areas; this paper does not establish amodal encoding across high-level DMN areas generally. (LLM, conf=0.84)
plainstates an association- Asserted: passes — The authors put it forward as true.
- Checkable: passes — It can be checked against evidence.
- Load-bearing: passes — The paper’s conclusions depend on it.
- Based: passes — The paper gives a reason why it holds.
- Supported
42 more claims · 1 with their cited sources checked
Create a free account to see all 91 claims and to verify the 43 references still open.
- Probably not a substantial claim. 28
- It may state two separate claims as one. 25
- The quote only partly states this claim. 2
Claims other papers make about this one
Each is checked against this paper’s own text: does it say what the citing paper says it does?
The cited source says what the claim attributes to it.
In the citing paper
“Strikingly, participants who had never seen the episode before showed spatio-temporally similar DMN activity to the speaker both as the speaker recalled the episode and as the speaker watched the episode (Fig. 4b,c).”
From The default mode network: where the idiosyncratic self meets the shared social world (2021) · cites this paper as [33]
In the citing paper
“Classification analysis showed that similarities in the DMN responses between the movie viewers, the speaker and the listeners were scene-specific and invariant to low-level sensory features (such as differences between the audiovisual movie and its spoken description), suggesting that these shared responses reflected the transmission of information.”
From The default mode network: where the idiosyncratic self meets the shared social world (2021) · cites this paper as [33]
In the citing paper
“The full circle of experience transmission from the speaker’s brain to the listener’s brain has also been demonstrated33 (Fig. 4a).”
From The default mode network: where the idiosyncratic self meets the shared social world (2021) · cites this paper as [33]
In the citing paper
“Moreover, listener comprehension was better predicted by the unique alignment between the listeners’ and the speaker’s response patterns as the speaker encoded the movie to memory, relative to the alignment to the responses of other participants who watched the movie but did not share their experience with the listeners.”
From The default mode network: where the idiosyncratic self meets the shared social world (2021) · cites this paper as [33]
In the citing paper
“The brain activity patterns that represent scenes extending over tens of seconds (e.g., a detective searching a suspect’s apartment for evidence) are largely the same, whether the information comes from watching a movie, hearing or reading a narrative description, or recalling the movie after having seen it (54, 55).”
From Placing language in an integrated understanding system: Next steps toward human-level performance in neural language models (2020) · cites this paper as [54]
Self-check
Percentages, sums and reported differences re-computed from the paper’s own numbers.
Each contradiction between two passages listed here was confirmed by an independent check.
Rated minor: it would not touch a result — a value no result rests on, a p-value that stays on the same side of the significance level, or a conflict that is clerical, resolved elsewhere in the paper, or outside its own findings.
In the paper
§ How We Transmit Memories to Other Brains: Constructing Shared Neural Representations Via Communication > Results > Relationship Between Pattern Similarity and Behavioral Performance
“We observed that the listeners’ comprehension levels were predicted the best when we compared the listeners’ neural patterns with those of the “actual speaker viewing the movie,” relative to all other 18 viewers (Fig. 6A); and among the top 3 in the replication study (Fig. 6C).”
§ How We Transmit Memories to Other Brains: Constructing Shared Neural Representations Via Communication > Materials and Methods > Data Analysis
“(B,D) Rank order correlation values of the same analysis as in A,C for each of the viewers (including the speaker, red circle).”
Rated minor: it would not touch a result — a value no result rests on, a p-value that stays on the same side of the significance level, or a conflict that is clerical, resolved elsewhere in the paper, or outside its own findings.
In the paper
§ How We Transmit Memories to Other Brains: Constructing Shared Neural Representations Via Communication > Materials and Methods > Data Analysis
“Figure 5B,C shows the correlation for the speaker's viewing and the listeners. Figure 5A,C depicts the sorted outcome r values of correlation for each movie viewer and show the speaker's viewing in red.”
§ How We Transmit Memories to Other Brains: Constructing Shared Neural Representations Via Communication > Materials and Methods > Data Analysis
“Figure: Figure 6. Pattern similarity of movie viewers to listeners—relationship to behavior. (A,C) Correlation between the comprehension score of listeners and degree of similarity between the speaker neural responses during the encoding phase (i.e., while watching the movie) and all listeners in PCC, for each movie. (B,D) Rank order correlation values of the same analysis as in A,C for each of the viewers (including the speaker, red circle).”
Rated minor: it would not touch a result — a value no result rests on, a p-value that stays on the same side of the significance level, or a conflict that is clerical, resolved elsewhere in the paper, or outside its own findings.
In the paper
§ How We Transmit Memories to Other Brains: Constructing Shared Neural Representations Via Communication > Materials and Methods > Data Analysis
“The results are presented for spoken-recall versus movie-viewing (Fig. 3C,D), spoken-recall versus listening (Fig. 4C,D), and movie-viewing versus listening (Fig. 6C,D).”
§ How We Transmit Memories to Other Brains: Constructing Shared Neural Representations Via Communication > Materials and Methods > Data Analysis
“Figure: Figure 5. Listening to movie-viewing pattern similarity analysis (A,B). Pattern similarity searchlight map, showing regions with significant between-participant, scene-specific correlations (P-values) between movie-viewing and listening (searchlight was a 5 × 5 × 5 voxel cube).”
Citations
Cites
Controlling the False Discovery Rate: A Practical and Powerful Approach to Multiple Testing
Benjamini, Y., & Hochberg, Y. (1995) · Journal of the Royal Statistical Society Series B: Statistical Methodology · doi:10.1111/j.2517-6161.1995.tb02031.x · Cited by 109,482 · cited 2×
“Thus individual p values were generated for each voxel (center of searchlight cube) and were corrected for multiple comparisons using False Discovery Rate [52], q 0.05.”
MethodInfluentialA default mode of brain function
Raichle, M. E., MacLeod, A. M., Snyder, A. Z., Powers, W. J., Gusnard, D. A., & Shulman, G. L. (2001) · Proceedings of the National Academy of Sciences · doi:10.1073/pnas.98.2.676 · Cited by 12,190
The Brain's Default Network: Anatomy, Function, and Relevance to Disease
Buckner, R. L., Andrews‐Hanna, J. R., & Schacter, D. L. (2008) · Annals of the New York Academy of Sciences · doi:10.1196/annals.1440.011 · Cited by 9,761
REMEMBERING: A STUDY IN EXPERIMENTAL AND SOCIAL PSYCHOLOGY
Bartlett, F. C., & Burt, C. (1933) · British Journal of Educational Psychology · doi:10.1111/j.2044-8279.1933.tb02913.x · Cited by 7,475
Binder, J. R., Desai, R. H., Graves, W. W., & Conant, L. L. (2009) · Cerebral Cortex · doi:10.1093/cercor/bhp055 · Cited by 4,060
Representational similarity analysis-connecting the branches of systems neuroscience
Kriegeskorte, N. (2008) · Frontiers in Systems Neuroscience · doi:10.3389/neuro.06.004.2008 · Cited by 3,355
Situation models in language comprehension and memory
Zwaan, R. A., & Radvansky, G. A. (1998) · Psychological Bulletin · doi:10.1037/0033-2909.123.2.162 · Cited by 2,877
Buckner, R. L., & Carroll, D. C. (2007) · Trends in Cognitive Sciences · doi:10.1016/j.tics.2006.11.004 · Cited by 2,691
Toward a mechanistic psychology of dialogue.
Pickering, M. J., & Garrod, S. (2004) · Behavioral and Brain Sciences · doi:10.1017/s0140525x04000056 · Cited by 2,678
Remembering the past to imagine the future: the prospective brain
Schacter, D. L., Addis, D. R., & Buckner, R. L. (2007) · Nature Reviews Neuroscience · doi:10.1038/nrn2213 · Cited by 2,394
Cited by
Discovering Event Structure in Continuous Narrative Perception and Memory
Baldassano, C., Chen, J., Zadbood, A., Pillow, J. W., Hasson, U., & Norman, K. A. (2017) · Neuron · doi:10.1016/j.neuron.2017.06.041 · Cited by 952
Self-citationThe default mode network: where the idiosyncratic self meets the shared social world
Yeshurun, Y., Nguyen, M., & Hasson, U. (2021) · Nature Reviews Neuroscience · doi:10.1038/s41583-020-00420-w · Cited by 682
Self-citationShared memories reveal shared structure in neural activity across individuals
Chen, J., Leong, Y. C., Honey, C. J., Yong, C. H., Norman, K. A., & Hasson, U. (2017) · Nature Neuroscience · doi:10.1038/nn.4450 · Cited by 645
Self-citationMeasuring shared responses across subjects using intersubject correlation
Nastase, S. A., Gazzola, V., Hasson, U., & Keysers, C. (2019) · Social Cognitive and Affective Neuroscience · doi:10.1093/scan/nsz037 · Cited by 407
Self-citationKeep it real: rethinking the primacy of experimental control in cognitive neuroscience
Nastase, S. A., Goldstein, A., & Hasson, U. (2020) · NeuroImage · doi:10.1016/j.neuroimage.2020.117254 · Cited by 344
“…subject’s personal social network (Parkinson et al., 2017, 2018; Hyon et al., 2020), probing memory using naturalistic recall (Chen et al., 2017; Zadbood et al., 2017; Heusser et al., 2018), comparing natural language across modalities and contexts (Stephens et al., 2010; Regev et al., 2013;…”
BackgroundSelf-citation
Metadata
- Authors
- Zadbood, A., Chen, J., Leong, Y. C., Norman, K. A., & Hasson, U.
- Affiliations
- Princeton University (US)
- Johns Hopkins University (US)
- Stanford University (US)
- Corresponding author
- Zadbood, A.
- Venue
- Cerebral Cortex
- Publisher
- Oxford University Press (OUP)
- Published
- 2017-08-11
- Volume
- 27
- Issue
- 10
- Pages
- 4988-5000
- ISSN
- 1047-3211 (ISSN-L)
- 1460-2199
- PMC
- PMC6057550
- OpenAlex
- W2949078032
- Cited by
- 281
- References
- 58
- Citations by year
- 2026: 25 · 2025: 17 · 2024: 27 · 2023: 58 · 2022: 33 · 2021: 25 · 2020: 56 · 2019: 23 · 2018: 11 · 2017: 5
- FWCI
- 14.90
- Type
- journal article
- Language
- en
- Open access
- hybrid
- doi.org
- Licence
- Locations
- Cerebral Cortex (publishedVersion, cc-by-nc)
- bioRxiv (Cold Spring Harbor Laboratory) (acceptedVersion, cc-by-nc-nd)
- Europe PMC (PubMed Central) (publishedVersion, cc-by-nc)
- PubMed Central (publishedVersion, cc-by-nc)
- PubMed (publishedVersion)
- Funders
- The National Institutes of Health (1R01MH112357-01, 1R01MH112566-01)
- Topics
- Life Sciences › Neuroscience › Cognitive Neuroscience › Memory Processes and Influences
- Life Sciences › Neuroscience › Cognitive Neuroscience › Memory and Neural Mechanisms
- Social Sciences › Psychology › Experimental and Cognitive Psychology › Cognitive Functions and Memory
- Keywords
- memory transmission, shared neural representations, verbal communication, default mode network, memory encoding, memory retrieval, language and memory
- MeSH terms
- Adolescent, Adult, Brain, Brain Mapping, Communication, Female, Humans, Magnetic Resonance Imaging, Male, Middle Aged, Mental Recall, Young Adult, Memory, Episodic
About these checks
Registry, retraction, Cites and statistics results are computed, not judged, with one exception: a printed reference that no index lists is read once by a model before it counts as a citation error. Claims are extracted by a model and kept only when their quote appears verbatim in the text; each cited source is then checked, with a model’s help, for whether it says what the claim relies on. Those verdicts can be wrong — read the claim’s quote and the cited source before relying on one.
The claim verdicts this report counts are experimental: their accuracy is not yet measured.
A language model drew the claims from the paper on 2026-10-05, under version 3 of the claim definition (model deepseek-v4.1-flash, prompt extract-v3).
A second model labelled each claim on 2026-10-05 (model jev-1.13-20260917, definition revision gold-guideline-v0.2).
Cited sources are checked with a language model’s help (gpt-6-sol and qwen3.8-omni-flash).
Statistics and arithmetic are recomputed, not judged.
Confidence bands are shown only for fields calibrated on our annotated test set. None is calibrated yet, so no band is shown.
What counts as a claim ›How we measure confidence ›How we check this ›
Are you an author, or do you see a problem with this page? Request a review
How to cite
Cite CoChat for the checks on this page, and the paper for its own findings.
- This page
- CoChat. (2026). Citation check: How We Transmit Memories to Other Brains: Constructing Shared Neural Representations Via Communication. https://app.cochat.ai/papers/10.1093/cercor/bhx202
- The paper
- Zadbood, A., Chen, J., Leong, Y. C., Norman, K. A., & Hasson, U. (2017). How We Transmit Memories to Other Brains: Constructing Shared Neural Representations Via Communication. Cerebral Cortex. https://doi.org/10.1093/cercor/bhx202
Data sources
Bibliographic data: Semantic Scholar, OpenAlex, Crossref.
Contains information from the Semantic Scholar Academic Graph Datasets, made available under the ODC Attribution License (ODC-BY 1.0).
Semantic Scholar’s data is described in: Kinney, R., et al. (2023). The Semantic Scholar Open Data Platform. arXiv:2301.10140.
