

The DOI matches its Crossref record; 64 of the 65 references it cites were found in a registry or an index.
Regional and global contributions of air pollution to risk of death from COVID-19
Open accessAbstract
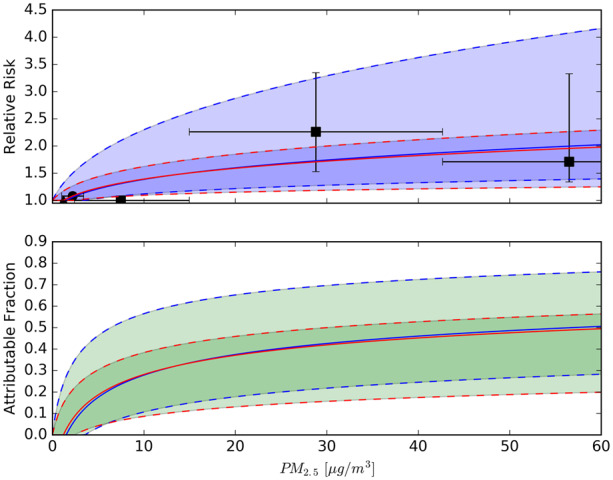
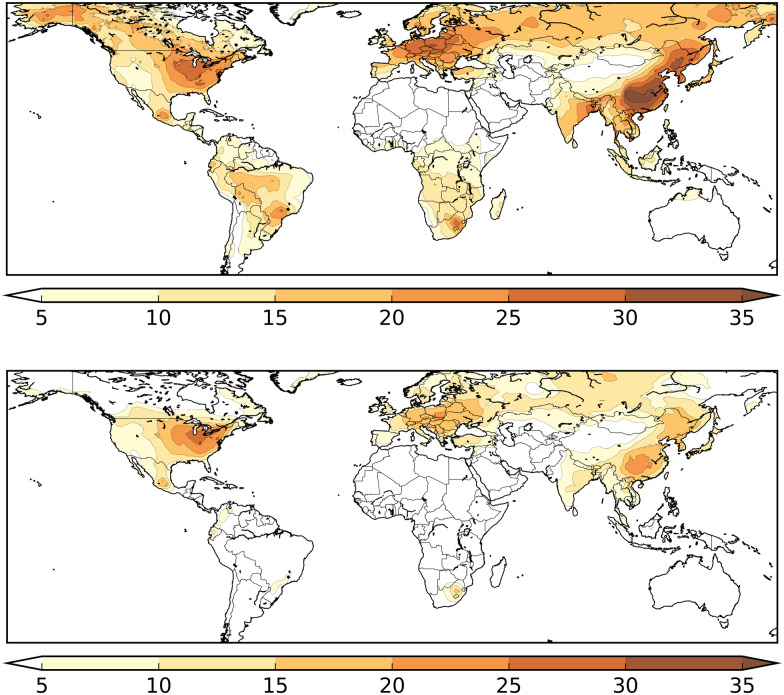
Aims: The risk of mortality from the coronavirus disease that emerged in 2019 (COVID-19) is increased by comorbidity from cardiovascular and pulmonary diseases. Air pollution also causes excess mortality from these conditions. Analysis of the first severe acute respiratory syndrome coronavirus (SARS-CoV-1) outcomes in 2003, and preliminary investigations of those for SARS-CoV-2 since 2019, provide evidence that the incidence and severity are related to ambient air pollution. We estimated the fraction of COVID-19 mortality that is attributable to the long-term exposure to ambient fine particulate air pollution. Methods and results: We characterized global exposure to fine particulates based on satellite data, and calculated the anthropogenic fraction with an atmospheric chemistry model. The degree to which air pollution influences COVID-19 mortality was derived from epidemiological data in the USA and China. We estimate that particulate air pollution contributed ∼15% (95% confidence interval 7–33%) to COVID-19 mortality worldwide, 27% (13 – 46%) in East Asia, 19% (8–41%) in Europe, and 17% (6–39%) in North America. Globally, ∼50–60% of the attributable, anthropogenic fraction is related to fossil fuel use, up to 70–80% in Europe, West Asia, and North America. Conclusion: Our results suggest that air pollution is an important cofactor increasing the risk of mortality from COVID-19. This provides extra motivation for combining ambitious policies to reduce air pollution with measures to control the transmission of COVID-19.
Overview
The claims and statistics of this paper haven’t been checked yet.
Run the check — free, no account needed. It reads the open-access text and checks the sources it cites.
Integrity signals
Registry
Cites
Statistics
Figures
Verification
Claims the paper makes
The claims and statistics of this paper haven’t been checked yet.
Run the check — free, no account needed. It reads the open-access text and checks the sources it cites.
Self-check
Percentages, sums and reported differences re-computed from the paper’s own numbers.
The self-check needs the paper’s full text.
Citations
Cites
A pneumonia outbreak associated with a new coronavirus of probable bat origin
Zhou, P., Yang, X.-L., Wang, X.-G., Hu, B., Zhang, L., Zhang, W., Si, H.-R., Zhu, Y., Li, B., Huang, C.-L., et al. (2020) · Nature · doi:10.1038/s41586-020-2012-7 · Cited by 21,969
Richardson, S., Hirsch, J. S., Narasimhan, M., Crawford, J. M., McGinn, T., Davidson, K. W., and the Northwell COVID-19 Research Consortium, Barnaby, D. P., Becker, L. B., Chelico, J. D., et al. (2020) · JAMA · doi:10.1001/jama.2020.6775 · Cited by 9,254
A novel coronavirus outbreak of global health concern
Wang, C., Horby, P. W., Hayden, F. G., & Gao, G. F. (2020) · The Lancet · doi:10.1016/s0140-6736(20)30185-9 · Cited by 7,700
Factors associated with COVID-19-related death using OpenSAFELY
Williamson, E. J., Walker, A. J., Bhaskaran, K., Bacon, S., Bates, C., Morton, C. E., Curtis, H. J., Mehrkar, A., Evans, D., Inglesby, P., et al. (2020) · Nature · doi:10.1038/s41586-020-2521-4 · Cited by 6,674
Cohen, A. J., Brauer, M., Burnett, R., Anderson, H. R., Frostad, J., Estep, K., Balakrishnan, K., Brunekreef, B., Dandona, L., Dandona, R., et al. (2017) · The Lancet · doi:10.1016/s0140-6736(17)30505-6 · Cited by 6,583
Brook, R. D., Rajagopalan, S., Pope, C. A., Brook, J. R., Bhatnagar, A., Diez-Roux, A. V., Holguin, F., Hong, Y., Luepker, R. V., Mittleman, M. A., et al. (2010) · Circulation · doi:10.1161/cir.0b013e3181dbece1 · Cited by 6,548
Endothelial cell infection and endotheliitis in COVID-19
Varga, Z., Flammer, A. J., Steiger, P., Haberecker, M., Andermatt, R., Zinkernagel, A. S., Mehra, M. R., Schuepbach, R. A., Ruschitzka, F., & Moch, H. (2020) · The Lancet · doi:10.1016/s0140-6736(20)30937-5 · Cited by 6,358
Pulmonary Vascular Endothelialitis, Thrombosis, and Angiogenesis in Covid-19
Ackermann, M., Verleden, S. E., Kuehnel, M., Haverich, A., Welte, T., Laenger, F., Vanstapel, A., Werlein, C., Stark, H., Tzankov, A., et al. (2020) · New England Journal of Medicine · doi:10.1056/nejmoa2015432 · Cited by 5,613
The Lancet Commission on pollution and health
Landrigan, P. J., Fuller, R., Acosta, N. J. R., Adeyi, O., Arnold, R., Basu, N. (., Baldé, A. B., Bertollini, R., Bose-O'Reilly, S., Boufford, J. I., et al. (2018) · The Lancet · doi:10.1016/s0140-6736(17)32345-0 · Cited by 4,929
Self-citationAssociation of cardiac injury with mortality in hospitalized patients with COVID-19 in Wuhan, China
Shi, S., Qin, M., Shen, B., Cai, Y., Liu, T., Yang, F., Gong, W., Liu, X., Liang, J., Zhao, Q., et al. (2020) · JAMA Cardiology · doi:10.1001/jamacardio.2020.0950 · Cited by 4,349
Research works printed but not linked: 1
- Ostro, 2004, World Health Organization Protection of the Human Environment
Cited by
Sorted by citations
Items 401–462 of 462
10. Medische ethiek en milieu-ethiek
Hens, K. (2023) · Open Book Publishers · doi:10.11647/obp.0370.10
14. Zorgende verantwoordelijkheid
Hens, K. (2023) · Open Book Publishers · doi:10.11647/obp.0370.14
Voorwoord: Van Rensselaer Potter
Hens, K. (2023) · Open Book Publishers · doi:10.11647/obp.0370.22
Hens, K. (2023) · Open Book Publishers · doi:10.11647/obp.0370.12
1. Een fundament voor de bio-ethiek: Van Rensselaer Potters nalatenschap
Hens, K. (2023) · Open Book Publishers · doi:10.11647/obp.0370.01
Hens, K. (2023) · Open Book Publishers · doi:10.11647/obp.0370.03
Hens, K. (2023) · Open Book Publishers · doi:10.11647/obp.0370.05
Hens, K. (2023) · Open Book Publishers · doi:10.11647/obp.0370.17
8. Tijd, cultuur en creativiteit
Hens, K. (2023) · Open Book Publishers · doi:10.11647/obp.0370.08
20. Creativiteit: Een game dat bio-ethici inspireert
Hens, K. (2023) · Open Book Publishers · doi:10.11647/obp.0370.20
18. Ontwikkeling: Autismeonderzoek
Hens, K. (2023) · Open Book Publishers · doi:10.11647/obp.0370.18
Hens, K. (2023) · Open Book Publishers · doi:10.11647/obp.0370.04
2. Overzicht van de argumentatie
Hens, K. (2023) · Open Book Publishers · doi:10.11647/obp.0370.02
11. Ziekten, stoornissen, handicaps en normen
Hens, K. (2023) · Open Book Publishers · doi:10.11647/obp.0370.11
Hens, K. (2023) · Open Book Publishers · doi:10.11647/obp.0370.13
Hens, K. (2023) · Open Book Publishers · doi:10.11647/obp.0370
Hens, K. (2023) · Open Book Publishers · doi:10.11647/obp.0370.15
6. Een hond is een hond is een hond: Over natuur en waarden
Hens, K. (2023) · Open Book Publishers · doi:10.11647/obp.0370.06
19. Trouble: Krokodillen en muizen
Hens, K. (2023) · Open Book Publishers · doi:10.11647/obp.0370.19
Gruev, I. T., & Tsanova, V. (2023) · Bulgarian Cardiology · doi:10.3897/bgcardio.29.e109781
Epidemiología sociocultural de la crisis del COVID-19
Plaza, R. G. (2023) · Gredos (University of Salamanca) · doi:10.14201/gredos.153227
bardshahi, A. M., Jaafarzadeh, N., Tabatabaie, T., & Amiri, F. (2023) · Research Square · doi:10.21203/rs.3.rs-3283577/v1
Environmental Sustainability of Cardiac Imaging
Mangia, C., & Picano, E. (2023) · Springer eBooks · doi:10.1007/978-3-031-31062-1_42
Waiting times for hip fracture surgery
(2020) · Health at a glance. Europe · doi:10.1787/4315b545-en
AIR QUALITY MONITORING SYSTEM DURING CORONA PANDEMIC
Saeed1, I. A., Arif, H., Raza, M. A., Ahmad, M., Aimen, & Gul, M. (2023) · Pakistan Journal of Scientific Research · doi:10.57041/pjosr.v3i1.974
Luftverschmutzung, Lärm und Hypertonie
Münzel, T. F., Daiber, A., & Hahad, O. (2024) · Herz · doi:10.1007/s00059-024-05234-5
Self-citationDETERMINING THE LOCAL SPATIAL RELATIONSHIPS BETWEEN COVID-19 AND NO2 USING SENTINEL 5P AND MGWR
Universiti Teknologi, M. A. R. A., RAHIM, A., Narashid, R. H., Universiti Teknologi, M. A. R. A., YASIM, S. N. M., Universiti Teknologi, M. A. R. A., Zaki, N. A. M., Universiti Teknologi, M. A. R. A., Hashim, S., Universiti Teknologi, M. A. R. A., et al. (2023) · Journal of Sustainability Science and Management · doi:10.46754/jssm.2023.12.008
Socioeconomic and sociodemographic correlations to COVID-19 variability in the United States in 2020
Golosov, N., Wang, S., Yu, M., Karle, N. N., Ideki, O., Abdul-Hamid, B., & Blaszczak-Boxe, C. (2024) · Frontiers in Public Health · doi:10.3389/fpubh.2024.1359192
Geoenvironmental variables as causal cofactors of diseases of unknown etiology
Davies, T. C. (2024) · Elsevier eBooks · doi:10.1016/b978-0-12-818748-7.00013-7
Ventilation and airborne particles in classrooms: Implications from the COVID-19 pandemic
Gabriel, M. F., Felgueiras, F., & Marques, G. (2024) · Elsevier eBooks · doi:10.1016/b978-0-323-95646-8.00032-9
KnowAir: A Low-Cost PM2.5 Sensor Citizen-Based Air Pollution Monitoring System for Real-Time
Saleh, E. M., Al-Werfalli, S., Imbarak, T., Elakeili, S., & Elmajpri, H. (2024) · Communications in computer and information science · doi:10.1007/978-3-031-62624-1_13
OECD, & Union, E. (2020) · Health at a glance. Europe · doi:10.1787/818d288b-pl
OECD, & Union, E. (2020) · Health at a glance. Europe · doi:10.1787/cab3ab19-de
(2020) · Health at a glance. Europe · doi:10.1787/da5bba97-en
Tobacco and cannabis smoking among children and adolescents
(2020) · Health at a glance. Europe · doi:10.1787/77bdc401-en
Vambe, M., Coopoosamy, R. M., Naidoo, K., & Theophilus, D. (2024) · Student s Journal of Health Research Africa · doi:10.51168/sjhrafrica.v5i9.1287
The “pharmakon” of prevention: artificial immunity in the covid-19 pandemic
Varino, S. (2024) · História Ciências Saúde-Manguinhos · doi:10.1590/s0104-59702024000100055
Velasco, E., Retama, A., & Stratoulias, D. (2024) · SpringerBriefs in earth system sciences · doi:10.1007/978-3-031-69088-4_1
Cardiovascular Effects of Air Pollutants
Vallero, D. A. (2025) · Elsevier eBooks · doi:10.1016/b978-0-443-31446-9.00023-7
Vitucci, E. C. M., Simmons, A., Martin, E. M., & McCullough, S. D. (2024) · Figshare · doi:10.6084/m9.figshare.26691826
Tchicaya, A., Lorentz, N., Omrani, H., de Lanchy, G., & Leduc, K. (2021) · Figshare · doi:10.6084/m9.figshare.16576025
Dellicour, S., Linard, C., Goethem, N. V., Da Re, D., Artois, J., Bihin, J., Schaus, P., Massonnet, F., Oyen, H. J. V., Vanwambeke, S., et al. (2021) · Figshare · doi:10.6084/m9.figshare.14782539
Dellicour, S., Linard, C., Goethem, N. V., Da Re, D., Artois, J., Bihin, J., Schaus, P., Massonnet, F., Oyen, H. J. V., Vanwambeke, S., et al. (2021) · Figshare · doi:10.6084/m9.figshare.14782536
Vitucci, E. C. M., Simmons, A., Martin, E. M., & McCullough, S. D. (2024) · Figshare · doi:10.6084/m9.figshare.26691829
Dellicour, S., Linard, C., Goethem, N. V., Da Re, D., Artois, J., Bihin, J., Schaus, P., Massonnet, F., Oyen, H. J. V., Vanwambeke, S., et al. (2021) · Figshare · doi:10.6084/m9.figshare.14782545
Vitucci, E. C. M., Simmons, A., Martin, E. M., & McCullough, S. D. (2024) · Figshare · doi:10.6084/m9.figshare.26691832
Vitucci, E. C. M., Simmons, A., Martin, E. M., & McCullough, S. D. (2024) · Figshare · doi:10.6084/m9.figshare.26691823
Dellicour, S., Linard, C., Goethem, N. V., Da Re, D., Artois, J., Bihin, J., Schaus, P., Massonnet, F., Oyen, H. J. V., Vanwambeke, S., et al. (2021) · Figshare · doi:10.6084/m9.figshare.14782542
Vitucci, E. C. M., Simmons, A., Martin, E. M., & McCullough, S. D. (2024) · Figshare · doi:10.6084/m9.figshare.26691835
Can not breathe: exposure and health effects of poor indoor air quality
Banic, I., & Turkalj, M. (2025) · Elsevier eBooks · doi:10.1016/b978-0-443-26643-0.00020-0
Mucosal Wound Repair: Reinforcement of Respiratory Mucus Barrier Function by Inorganic Polyphosphate
Wang, X., Schröder, H. C., Neufurth, M., & Müller, W. E. G. (2026) · Progress in molecular and subcellular biology · doi:10.1007/978-3-032-17771-1_6
Agrawal, C., Kumar, R., Karan, A., Kisku, N., Kumar, R., & Gupta, P. S. P. (2026) · The Indian Journal of Chest Diseases and Allied Sciences · doi:10.5005/jp-journals-11007-0182
De l'origine des maladies : la médecine environnementale : une nouvelle grille de lecture
Reis, J. J. (2022) · theses.fr (ABES) · doi:10.70675/b037ce62z054bz4048z9f93ze0a70c6c1357
Sun, G., Sun, L., & Zhou, Y. (2026) · The Journal of Climate Change and Health · doi:10.1016/j.joclim.2026.100681
Menon, G. R., Jose, S. A., Chun, A. Y., Jirawattanapanit, A., & Lee, H. (2026) · BMC Public Health · doi:10.1186/s12889-026-27995-w
Qi, X., Lu, J., Wang, X., & Xu, X. (2026) · Journal of environmental chemical engineering · doi:10.1016/j.jece.2026.124429
Air pollution and mortality in European regions and cities: the effects of smart cities projects
Casamassima, A., Castells‐Quintana, D., & Simeone, E. (2026) · Environmental Impact Assessment Review · doi:10.1016/j.eiar.2026.108671 · Cited by 2
Safe, Sustainable, and Ready: Climate-Resilient Healthcare Facilities in South Asia
Mudassir, M., Tandon, S., Bhutani, S., & Kumar, H. (2026) · Disaster risk reduction · doi:10.1007/978-981-95-9709-3_11
Enhanced deep learning networks integrated by fractals for air quality index analysis
Nandhini, S. K., & Mariappan, L. T. (2026) · Frontiers in Artificial Intelligence · doi:10.3389/frai.2026.1892338
An ever healthier Union? Increasing regional health resilience through Cohesion Policy
Bayerlein, M. (2026) · Spatial Economic Analysis · doi:10.1080/17421772.2026.2713146 · Cited by 1
Musala, M. K., Finn, B. M., Mugaruka, M. A., Matthieu, M. T., Kidinda, L. K., Jean-Noël, M. K., Kasongo, J., Kanda, J.-M., Kayembe, M. K. W., & Kaniki, A. T. (2026) · Environment Development and Sustainability · doi:10.1007/s10668-026-08147-x
Metadata
- Authors
- Pozzer, A., Dominici, F., Haines, A., Witt, C., Münzel, T., & Lelieveld, J.
- Affiliations
- The Abdus Salam International Centre for Theoretical Physics (ICTP) (IT)
- Harvard University (US)
- London School of Hygiene & Tropical Medicine (GB)
- Charité – Universitätsmedizin Berlin (DE)
- University Medical Center of the Johannes Gutenberg University Mainz (DE)
- Cyprus Institute (CY)
- Corresponding author
- Münzel, Thomas
- Lelieveld, Jos
- Venue
- Cardiovascular Research
- Publisher
- Oxford University Press (OUP)
- Published
- 2020-10-26
- Volume
- 116
- Issue
- 14
- Pages
- 2247-2253
- ISSN
- 0008-6363 (ISSN-L)
- 1755-3245
- PMC
- PMC7797754
- OpenAlex
- W3105596189
- Cited by
- 463
- References
- 65
- Citations by year
- 2026: 13 · 2025: 11 · 2024: 26 · 2023: 67 · 2022: 102 · 2021: 129 · 2020: 114
- FWCI
- 41.22
- Type
- journal article
- Language
- en
- Open access
- hybrid
- doi.org
- Licence
- Locations
- Cardiovascular Research (publishedVersion, cc-by-nc)
- Europe PMC (PubMed Central) (publishedVersion, other-oa)
- PubMed Central (publishedVersion, cc-by-nc)
- PubMed (publishedVersion)
- LSHTM Research Online (London School of Hygiene and Tropical Medicine) (acceptedVersion)
- MPG.PuRe (Max Planck Society) (submittedVersion)
- Funders
- DZHK
- German Center for Cardiovascular Research
- Partner Site Rhine-Main
- Topics
- Physical Sciences › Environmental Science › Health, Toxicology and Mutagenesis › Air Quality and Health Impacts
- Physical Sciences › Environmental Science › Global and Planetary Change › COVID-19 impact on air quality
- Health Sciences › Medicine › Pulmonary and Respiratory Medicine › Infection Control and Ventilation
- Keywords
- COVID-19 mortality, air pollution, PM2.5, ambient air pollution exposure, attributable fraction, fossil fuel consumption, anthropogenic emissions, cardiovascular comorbidity, SARS-CoV-2, air quality policy
- MeSH terms
- COVID-19, Air Pollutants, Air Pollution, Asia, Environmental Exposure, Europe, Humans, Models, Theoretical, North America, Risk Factors, Time Factors, Global Health, Risk Assessment, Particulate Matter
About these checks
Registry, retraction, Cites and statistics results are computed, not judged, with one exception: a printed reference that no index lists is read once by a model before it counts as a citation error. Claims are extracted by a model and kept only when their quote appears verbatim in the text; each cited source is then checked, with a model’s help, for whether it says what the claim relies on. Those verdicts can be wrong — read the claim’s quote and the cited source before relying on one.
Statistics and arithmetic are recomputed, not judged.
Confidence bands are shown only for fields calibrated on our annotated test set. None is calibrated yet, so no band is shown.
What counts as a claim ›How we measure confidence ›How we check this ›
Are you an author, or do you see a problem with this page? Request a review
