

The DOI matches its Crossref record; 74 of the 74 references it cites were found in a registry or an index.
T and Z , partial seed coat patterning genes in common bean, provide insight into the structure and protein interactions of a plant MBW complex
Open accessPublished version of a preprint
Abstract
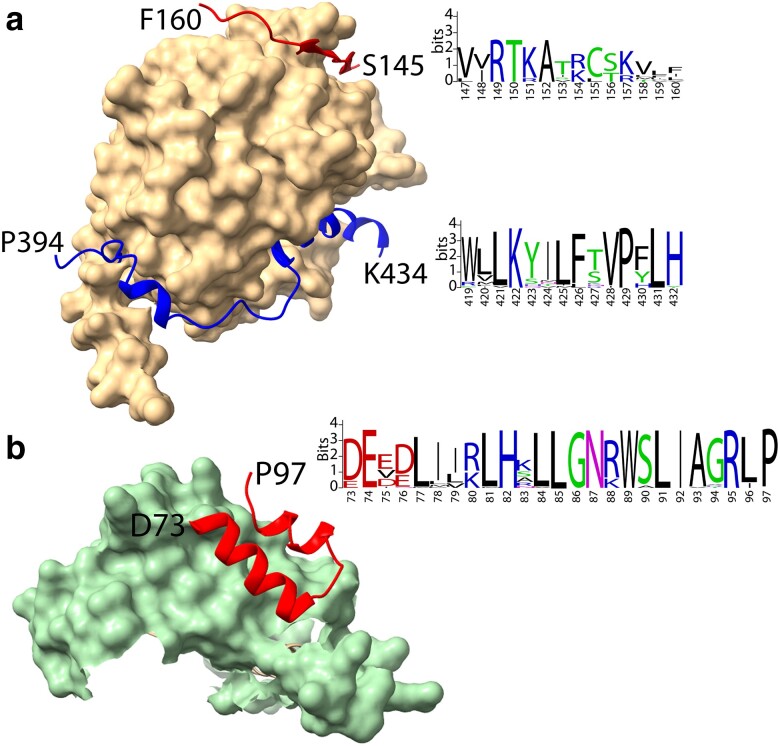
Flavonoids are secondary metabolites associated with plant seed coat and flower color. These compounds provide health benefits to humans as anti-inflammatory and antioxidant compounds. The expression of the late biosynthetic genes in the flavonoid pathway is controlled by a ternary MBW protein complex consisting of interfacing MYB, beta-helix–loop–helix (bHLH), and WD40 Repeat (WDR) proteins. P, the master regulator gene of the flavonoid expression in common bean (Phaseolus vulgaris L.), was recently determined to encode a bHLH protein. The T and Z genes control the distribution of color in bean seeds and flowers and have historically been considered regulators of the flavonoid gene expression. T and Z candidates were identified using reverse genetics based on genetic mapping, phylogenetic analysis, and mutant analysis. Domain and AlphaFold2 structure analyses determined that T encodes a seven-bladed β-propeller WDR protein, while Z encodes a R2R3 MYB protein. Deletions and SNPs in T and Z mutants, respectively, altered the 3D structure of these proteins. Modeling of the Z MYB/P bHLH/T WDR MBW complex identified interfacing sequence domains and motifs in all three genes that are conserved in dicots. One Z MYB motif is a possible beta-molecular recognition feature (β-MoRF) that only appears in a structured state when Z MYB is modeled as a component of a MBW complex. Complexes containing mutant T and Z proteins changed the interaction of members of the complex in ways that would alter their role in regulating the expression of genes in the flavonoid pathway.
Overview
The claims and statistics of this paper haven’t been checked yet.
Run the check — free, no account needed. It reads the open-access text and checks the sources it cites.
Integrity signals
Registry
Cites
Statistics
Figures
Verification
Claims the paper makes
The claims and statistics of this paper haven’t been checked yet.
Run the check — free, no account needed. It reads the open-access text and checks the sources it cites.
Self-check
Percentages, sums and reported differences re-computed from the paper’s own numbers.
The self-check needs the paper’s full text.
Citations
Cites
MUSCLE: multiple sequence alignment with high accuracy and high throughput
Edgar, R. C. (2004) · Nucleic Acids Research · doi:10.1093/nar/gkh340 · Cited by 44,662
MEGA7: Molecular Evolutionary Genetics Analysis Version 7.0 for Bigger Datasets
Kumar, S., Stecher, G., & Tamura, K. (2016) · Molecular Biology and Evolution · doi:10.1093/molbev/msw054 · Cited by 44,059
Highly accurate protein structure prediction with AlphaFold
Jumper, J., Evans, R., Pritzel, A., Green, T., Figurnov, M., Ronneberger, O., Tunyasuvunakool, K., Bates, R., Žídek, A., Potapenko, A., et al. (2021) · Nature · doi:10.1038/s41586-021-03819-2 · Cited by 43,764
WebLogo: A Sequence Logo Generator: Figure 1
Crooks, G. E., Hon, G., Chandonia, J.-M., & Brenner, S. E. (2004) · Genome Research · doi:10.1101/gr.849004 · Cited by 12,386
Inference of Macromolecular Assemblies from Crystalline State
Krissinel, E., & Henrick, K. (2007) · Journal of Molecular Biology · doi:10.1016/j.jmb.2007.05.022 · Cited by 9,984
The Angiosperm Phylogeny Group (2016) · Botanical Journal of the Linnean Society · doi:10.1111/boj.12385 · Cited by 9,555
UCSF ChimeraX: Structure visualization for researchers, educators, and developers
Pettersen, E. F., Goddard, T. D., Huang, C. C., Meng, E. C., Couch, G. S., Croll, T. I., Morris, J. H., & Ferrin, T. E. (2021) · Protein Science · doi:10.1002/pro.3943 · Cited by 9,514
ColabFold - Making protein folding accessible to all
Mirdita, M., Schütze, K., Moriwaki, Y., Heo, L., Ovchinnikov, S., & Steinegger, M. (2021) · doi:10.1101/2021.08.15.456425 · Cited by 9,391
MYB transcription factors in Arabidopsis
Dubos, C., Stracke, R., Grotewold, E., Weisshaar, B., Martin, C., & Lepiniec, L. (2010) · Trends in Plant Science · doi:10.1016/j.tplants.2010.06.005 · Cited by 4,865
MMseqs2 enables sensitive protein sequence searching for the analysis of massive data sets
Steinegger, M., & Söding, J. (2017) · Nature Biotechnology · doi:10.1038/nbt.3988 · Cited by 4,840
Protein complex prediction with AlphaFold-Multimer
Evans, R., O’Neill, M., Pritzel, A., Antropova, N., Senior, A., Green, T., Žídek, A., Bates, R., Blackwell, S., Yim, J., et al. (2021) · doi:10.1101/2021.10.04.463034 · Cited by 3,808
Murre, C., McCaw, P. S., & Baltimore, D. (1989) · Cell · doi:10.1016/0092-8674(89)90682-x · Cited by 2,635
Paysan‐Lafosse, T., Blum, M., Chuguransky, S., Grego, T., Pinto, B. L., Salazar, G. A., Bileschi, M. L., Bork, P., Bridge, A. J., Colwell, L. J., et al. (2022) · Nucleic Acids Research · doi:10.1093/nar/gkac993 · Cited by 2,522
Gonzalez, A., Zhao, M., Leavitt, J. M., & Lloyd, A. M. (2008) · The Plant Journal · doi:10.1111/j.1365-313x.2007.03373.x · Cited by 1,896
A reference genome for common bean and genome-wide analysis of dual domestications
Schmutz, J., McClean, P. E., Mamidi, S., Wu, G. A., Cannon, S. B., Grimwood, J., Jenkins, J. W., Shu, S., Song, Q., Chavarro, C. M., et al. (2014) · Nature Genetics · doi:10.1038/ng.3008 · Cited by 1,357
Self-citationEvolutionary and comparative analysis of MYB and bHLH plant transcription factors
Feller, A., Machemer, K., Braun, E. L., & Grotewold, E. (2011) · The Plant Journal · doi:10.1111/j.1365-313x.2010.04459.x · Cited by 1,348
The staden sequence analysis package
Staden, R. (1996) · Molecular Biotechnology · doi:10.1007/bf02900361 · Cited by 1,270
The WD repeat: a common architecture for diverse functions
Smith, T. F., Gaitatzes, C., Saxena, K., & Neer, E. J. (1999) · Trends in Biochemical Sciences · doi:10.1016/s0968-0004(99)01384-5 · Cited by 1,253
Stracke, R., Ishihara, H., Huep, G., Barsch, A., Mehrtens, F., Niehaus, K., & Weisshaar, B. (2007) · The Plant Journal · doi:10.1111/j.1365-313x.2007.03078.x · Cited by 1,182
Walker, A. R., Davison, P. A., Bolognesi-Winfield, A. C., James, C. M., Srinivasan, N., Blundell, T. L., Esch, J. J., Marks, M. D., & Gray, J. C. (1999) · The Plant Cell · doi:10.1105/tpc.11.7.1337 · Cited by 958
DISOPRED3: precise disordered region predictions with annotated protein-binding activity
Jones, D. T., & Cozzetto, D. (2014) · Bioinformatics · doi:10.1093/bioinformatics/btu744 · Cited by 882
Nési, N., Jond, C., Debeaujon, I., Caboche, M. M., & Lepiniec, L. (2001) · The Plant Cell · doi:10.1105/tpc.010098 · Cited by 860
A network of redundant bHLH proteins functions in all TTG1-dependent pathways of Arabidopsis
Zhang, F., Gonzalez, A., Zhao, M., Payne, C. T., & Lloyd, A. (2003) · Development · doi:10.1242/dev.00681 · Cited by 799
Intrinsic Disorder in Transcription Factors
Liu, J., Perumal, N. B., Oldfield, C. J., Su, E. W., Uversky, V. N., & Dunker, A. K. (2006) · Biochemistry · doi:10.1021/bi0602718 · Cited by 792
Analysis of Molecular Recognition Features (MoRFs)
Mohan, A., Oldfield, C. J., Radivojac, P., Vacic, V., Cortese, M. S., Dunker, A. K., & Uversky, V. N. (2006) · Journal of Molecular Biology · doi:10.1016/j.jmb.2006.07.087 · Cited by 751
Payne, C. T., Zhang, F., & Lloyd, A. M. (2000) · Genetics · doi:10.1093/genetics/156.3.1349 · Cited by 751
Nesi, N., Debeaujon, I., Jond, C., Pelletier, G., Caboche, M., & Lepiniec, L. (2000) · The Plant Cell · doi:10.1105/tpc.12.10.1863 · Cited by 747
The photomorphogenic repressors COP1 and DET1: 20 years later
Lau, O. S., & Deng, X. W. (2012) · Trends in Plant Science · doi:10.1016/j.tplants.2012.05.004 · Cited by 645
Erdős, G., Pajkos, M., & Dosztányi, Z. (2021) · Nucleic Acids Research · doi:10.1093/nar/gkab408 · Cited by 608
MYBL2 is a new regulator of flavonoid biosynthesis in Arabidopsis thaliana
Dubos, C., Gourrierec, J. L., Baudry, A., Huep, G., Lanet, E., Debeaujon, I., Routaboul, J., Alboresi, A., Weißhaar, B., & Lepiniec, L. (2008) · The Plant Journal · doi:10.1111/j.1365-313x.2008.03564.x · Cited by 586
Lee, M. M., & Schiefelbein, J. (1999) · Cell · doi:10.1016/s0092-8674(00)81536-6 · Cited by 584
Goff, S. A., Cone, K. C., & Chandler, V. L. (1992) · Genes & Development · doi:10.1101/gad.6.5.864 · Cited by 408
Stracke, R., Jahns, O., Keck, M., Tohge, T., Niehaus, K., Fernie, A. R., & Weißhaar, B. (2010) · New Phytologist · doi:10.1111/j.1469-8137.2010.03421.x · Cited by 357
WD40 Repeat Proteins: Signalling Scaffold with Diverse Functions
Jain, B. P., & Pandey, S. (2018) · The Protein Journal · doi:10.1007/s10930-018-9785-7 · Cited by 313
Zhou, H., Lin‐Wang, K., Wang, F., Espley, R. V., Ren, F., Zhao, J., Ogutu, C. O., He, H., Jiang, Q., Allan, A. C., et al. (2018) · New Phytologist · doi:10.1111/nph.15486 · Cited by 311
Advance of the negative regulation of anthocyanin biosynthesis by MYB transcription factors
Chen, L., Hu, B., Qin, Y., Hu, G., & Zhao, J. (2019) · Plant Physiology and Biochemistry · doi:10.1016/j.plaphy.2019.01.024 · Cited by 286
Goff, S. A., Klein, T. M., Roth, B. A., Fromm, M. E., Cone, K. C., Radicella, J. P., & Chandler, V. L. (1990) · The EMBO Journal · doi:10.1002/j.1460-2075.1990.tb07431.x · Cited by 256
The allosteric ligand site in the Vmax-type cooperative enzyme phosphoglycerate dehydrogenase
Schuller, D. J., Grant, G. A., & Banaszak, L. J. (1995) · Nature Structural Biology · doi:10.1038/nsb0195-69 · Cited by 250
R2R3 MYB Transcription Factors – Functions outside the DNA-Binding Domain
Millard, P. S., Kragelund, B. B., & Burow, M. (2019) · Trends in Plant Science · doi:10.1016/j.tplants.2019.07.003 · Cited by 182
Koenen, E. J. M., Ojeda, D. I., Steeves, R., Migliore, J., Bakker, F. T., Wieringa, J. J., Kidner, C. A., Hardy, O. J., Pennington, R. T., Bruneau, A., et al. (2019) · New Phytologist · doi:10.1111/nph.16290 · Cited by 176
McClean, P. E. (2002) · Journal of Heredity · doi:10.1093/jhered/93.2.148 · Cited by 168
Self-citationPang, Y., Wenger, J. P., Saathoff, K., Peel, G. J., Wen, J., Huhman, D. V., Allen, S. N., Tang, Y., Cheng, X., Tadege, M., et al. (2009) · PLANT PHYSIOLOGY · doi:10.1104/pp.109.144022 · Cited by 164
Identification of Mendel's White Flower Character
Hellens, R. P., Moreau, C., Lin‐Wang, K., Schwinn, K. E., Thomson, S. J., Fiers, M. W. E. J., Frew, T. J., Murray, S. R., Hofer, J. M. I., Jacobs, J. M. E., et al. (2010) · PLoS ONE · doi:10.1371/journal.pone.0013230 · Cited by 163
A Phaseolus vulgaris Diversity Panel for Andean Bean Improvement
Cichy, K. A., Porch, T. G., Beaver, J. S., Cregan, P. B., Fourie, D., Glahn, R. P., Grusak, M. A., Kamfwa, K., Katuuramu, D. N., McClean, P., et al. (2015) · Crop Science · doi:10.2135/cropsci2014.09.0653 · Cited by 163
Self-citationMeng, Y., Wang, Z., Wang, Y., Wang, C., Zhu, B., Liu, H., Ji, W., Wen, J., Chu, C., Tadege, M., et al. (2019) · The Plant Cell · doi:10.1105/tpc.19.00480 · Cited by 162
MYB5 and MYB14 Play Pivotal Roles in Seed Coat Polymer Biosynthesis in Medicago truncatula
Liu, C., Jun, J. H., & Dixon, R. A. (2014) · PLANT PHYSIOLOGY · doi:10.1104/pp.114.241877 · Cited by 158
Liu, Y., Hou, H., Jiang, X., Wang, P., Dai, X., Chen, W., Gao, L., & Xia, T. (2018) · International Journal of Molecular Sciences · doi:10.3390/ijms19061686 · Cited by 152
Wu, S., Tohge, T., Inostroza, A. C., Tong, H., Tenenboim, H., Kooke, R., Méret, M., Keurentjes, J. J. B., Nikoloski, Z., Fernie, A. R., et al. (2017) · Molecular Plant · doi:10.1016/j.molp.2017.08.012 · Cited by 150
Moghaddam, S. M., Mamidi, S., Osorno, J. M., Lee, R., Brick, M. A., Kelly, J. D., Miklas, P. N., Urrea, C. A., Song, Q., Cregan, P. B., et al. (2016) · The Plant Genome · doi:10.3835/plantgenome2016.02.0012 · Cited by 148
Self-citationFeller, A., Hernandez, J. M., & Grotewold, E. (2006) · Journal of Biological Chemistry · doi:10.1074/jbc.m603262200 · Cited by 145
Gao, Y., Liu, J., Chen, Y., Tang, H., Wang, Y., He, Y., Ou, Y., Sun, X., Wang, S., & Yao, Y. (2018) · Horticulture Research · doi:10.1038/s41438-018-0032-3 · Cited by 136
Kong, Q., Pattanaik, S., Feller, A., Werkman, J. R., Chai, C., Wang, Y., Erich Grotewold, A., & Yuan, L. (2012) · Proceedings of the National Academy of Sciences · doi:10.1073/pnas.1205513109 · Cited by 115
McClean, P. E., Bett, K. E., Stonehouse, R., Lee, R., Pflieger, S., Moghaddam, S. M., Geffroy, V., Miklas, P. N., & Mamidi, S. (2018) · New Phytologist · doi:10.1111/nph.15259 · Cited by 110
Self-citationStructural insights into target DNA recognition by R2R3-MYB transcription factors
Wang, B., Luo, Q., Li, Y., Yin, L., Zhou, N., Li, X., Gan, J., & Dong, A. (2019) · Nucleic Acids Research · doi:10.1093/nar/gkz1081 · Cited by 95
TRANSPARENT TESTA GLABRA 1-Dependent Regulation of Flavonoid Biosynthesis
Zhang, B., & Schrader, A. (2017) · Plants · doi:10.3390/plants6040065 · Cited by 80
Structural insights into partner selection for MYB and bHLH transcription factor complexes
Wang, B., Luo, Q., Li, Y., Du, K., Wu, Z., Li, T., Shen, W., Huang, C., Gan, J., & Dong, A. (2022) · Nature Plants · doi:10.1038/s41477-022-01223-w · Cited by 74
The interaction of MYB, bHLH and WD40 transcription factors in red pear (Pyrus pyrifolia) peel
Cui, D., Zhao, S., Xu, H., Allan, A. C., Zhang, X., Fan, L., Chen, L., Su, J., Shu, Q., & Li, K. (2021) · Plant Molecular Biology · doi:10.1007/s11103-021-01160-w · Cited by 70
Broucke, E., Dang, T. T. V., Li, Y., Hulsmans, S., Leene, J. V., Jaeger, G. D., Hwang, I., den Ende, W. V., & Rolland, F. (2023) · The Plant Journal · doi:10.1111/tpj.16312 · Cited by 63
Genetics of Seed Coat Color and Pattern in Common Bean
Bassett, M. J. (2007) · Plant breeding reviews · doi:10.1002/9780470168028.ch8 · Cited by 62
Lu, N., Rao, X., Li, Y., Jun, J. H., & Dixon, R. A. (2021) · Plant Biotechnology Journal · doi:10.1111/pbi.13562 · Cited by 60
Structural insights into target DNA recognition by R2R3-type MYB transcription factor
Wang, B., & Luo, Q. (2019) · Worldwide Protein Data Bank · doi:10.2210/pdb6kks/pdb · Cited by 59
Thompson, J. R., Bell, J. K., Bratt, J. M., Grant, G. A., & Banaszak, L. J. (2005) · Biochemistry · doi:10.1021/bi047944b · Cited by 57
A new system for fast and quantitative analysis of heterologous gene expression in plants
Thévenin, J., Dubos, C., Xu, W., Gourrierec, J. L., Kelemen, Z., Charlot, F., Nogué, F., Lepiniec, L., & Dubreucq, B. (2011) · New Phytologist · doi:10.1111/j.1469-8137.2011.03936.x · Cited by 57
Jiang, W., Yin, Q., Liu, J., Su, X., Han, X., Li, Q., Zhang, J., & Pang, Y. (2023) · Plant Communications · doi:10.1016/j.xplc.2023.100777 · Cited by 45
Bastardierungsversuche an Levkojen, Erbsen und Bohnen mit Rücksicht auf die Faktorenlehre
Tschermak, E. V. (1912) · Molecular Genetics and Genomics · doi:10.1007/bf01910333 · Cited by 42
Gutiérrez, N., & Torres, A. M. (2019) · Scientific Reports · doi:10.1038/s41598-019-52575-x · Cited by 39
Madrera, R. R., & Valles, B. S. (2019) · Journal of Food Composition and Analysis · doi:10.1016/j.jfca.2019.103334 · Cited by 37
McClean, P. E., Lee, R., Howe, K., Osborne, C., Grimwood, J., Levy, S. A., Haugrud, A. R. P., Plott, C., Robinson, M., Skiba, R. M., et al. (2022) · Frontiers in Plant Science · doi:10.3389/fpls.2022.869582 · Cited by 31
Self-citationEmerson, R. A. (1909) · Journal of Heredity · doi:10.1093/jhered/os-5.1.368 · Cited by 30
Brady, L., Basset, M. J., & McClean, P. E. (1998) · Crop Science · doi:10.2135/cropsci1998.0011183x003800040031x · Cited by 29
Self-citationYang, J., Song, H. D., Chen, Y., Chen, B., Kim, M., Kim, P., Kawabata, S., Li, Y., & Wang, Y. (2021) · Plant Physiology and Biochemistry · doi:10.1016/j.plaphy.2021.02.011 · Cited by 24
Lee, Y. S., Herrera-Tequia, A., Silwal, J., Geiger, J. H., & Erich Grotewold, A. (2021) · Journal of Biological Chemistry · doi:10.1016/j.jbc.2021.100708 · Cited by 16
Bassett, M. J., Shearon, C., & McClean, P. (1999) · Journal of the American Society for Horticultural Science · doi:10.21273/jashs.124.6.649 · Cited by 14
Self-citationZUR GENETIK VON PHASEOLUS VULGARIS
LAMPRECHT, H. (2010) · Hereditas · doi:10.1111/j.1601-5223.1932.tb02577.x · Cited by 5
Research works printed but not linked: 3
- Bassett, 2001, Inheritance of the Fib gene from 5-593 for fibula arcs pattern of partly colored seed coat in the background genotype t P [C r] Z J G B V Rk, Annu Rep Bean Improv Coop, 44, 171
- Bassett, 2011, The genetics of the color pattern of seed coats in G19833, a Liborino class common bean, Annu Rep Bean Improv Coop, 54, 50
- Prakken, 1974, Meded. Landbouwhogeschool Wageningen, 1
Metadata
- Authors
- McClean, P. E., Roy, J., Colbert, C. L., Osborne, C., Lee, R., Miklas, P. N., & Osorno, J. M.
- Affiliations
- North Dakota State University (US)
- Agricultural Research Service (US)
- Corresponding author
- McClean, Phillip E
- Venue
- G3: Genes, Genomes, Genetics
- Publisher
- Oxford University Press (OUP)
- Published
- 2024-08-21
- Volume
- 14
- Issue
- 10
- ISSN
- 2160-1836 (ISSN-L)
- PMC
- PMC11457125
- OpenAlex
- W4401782765
- Cited by
- 13
- References
- 74
- Citations by year
- 2026: 7 · 2025: 6
- FWCI
- 1.77
- Type
- journal article
- Language
- en
- Open access
- gold
- doi.org
- Licence
- Locations
- G3 Genes Genomes Genetics (publishedVersion, cc-by)
- bioRxiv (Cold Spring Harbor Laboratory) (acceptedVersion)
- PubMed Central (publishedVersion, cc-by)
- PubMed (publishedVersion)
- Funders
- USDA
- Topics
- Life Sciences › Biochemistry, Genetics and Molecular Biology › Molecular Biology › Plant Gene Expression Analysis
- Life Sciences › Agricultural and Biological Sciences › Plant Science › Plant Molecular Biology Research
- Life Sciences › Biochemistry, Genetics and Molecular Biology › Genetics › Genetic Mapping and Diversity in Plants and Animals
- Keywords
- T gene, flavonoid biosynthesis, MBW complex, MYB, bHLH, WD40 repeats, Phaseolus vulgaris, protein-protein interaction, protein structure, flower color, seed color
- MeSH terms
- Flavonoids, Models, Molecular, Mutation, Phylogeny, Plant Proteins, Protein Binding, Seeds, Genes, Plant, Gene Expression Regulation, Plant, Phaseolus, Basic Helix-Loop-Helix Transcription Factors, Basic Helix-Loop-Helix Proteins
About these checks
Registry, retraction, Cites and statistics results are computed, not judged, with one exception: a printed reference that no index lists is read once by a model before it counts as a citation error. Claims are extracted by a model and kept only when their quote appears verbatim in the text; each cited source is then checked, with a model’s help, for whether it says what the claim relies on. Those verdicts can be wrong — read the claim’s quote and the cited source before relying on one.
Statistics and arithmetic are recomputed, not judged.
Confidence bands are shown only for fields calibrated on our annotated test set. None is calibrated yet, so no band is shown.
What counts as a claim ›How we measure confidence ›How we check this ›
Are you an author, or do you see a problem with this page? Request a review
Data sources
Bibliographic data: Semantic Scholar, OpenAlex, Crossref.
Contains information from the Semantic Scholar Academic Graph Datasets, made available under the ODC Attribution License (ODC-BY 1.0).
Semantic Scholar’s data is described in: Kinney, R., et al. (2023). The Semantic Scholar Open Data Platform. arXiv:2301.10140.
